Download to read offline


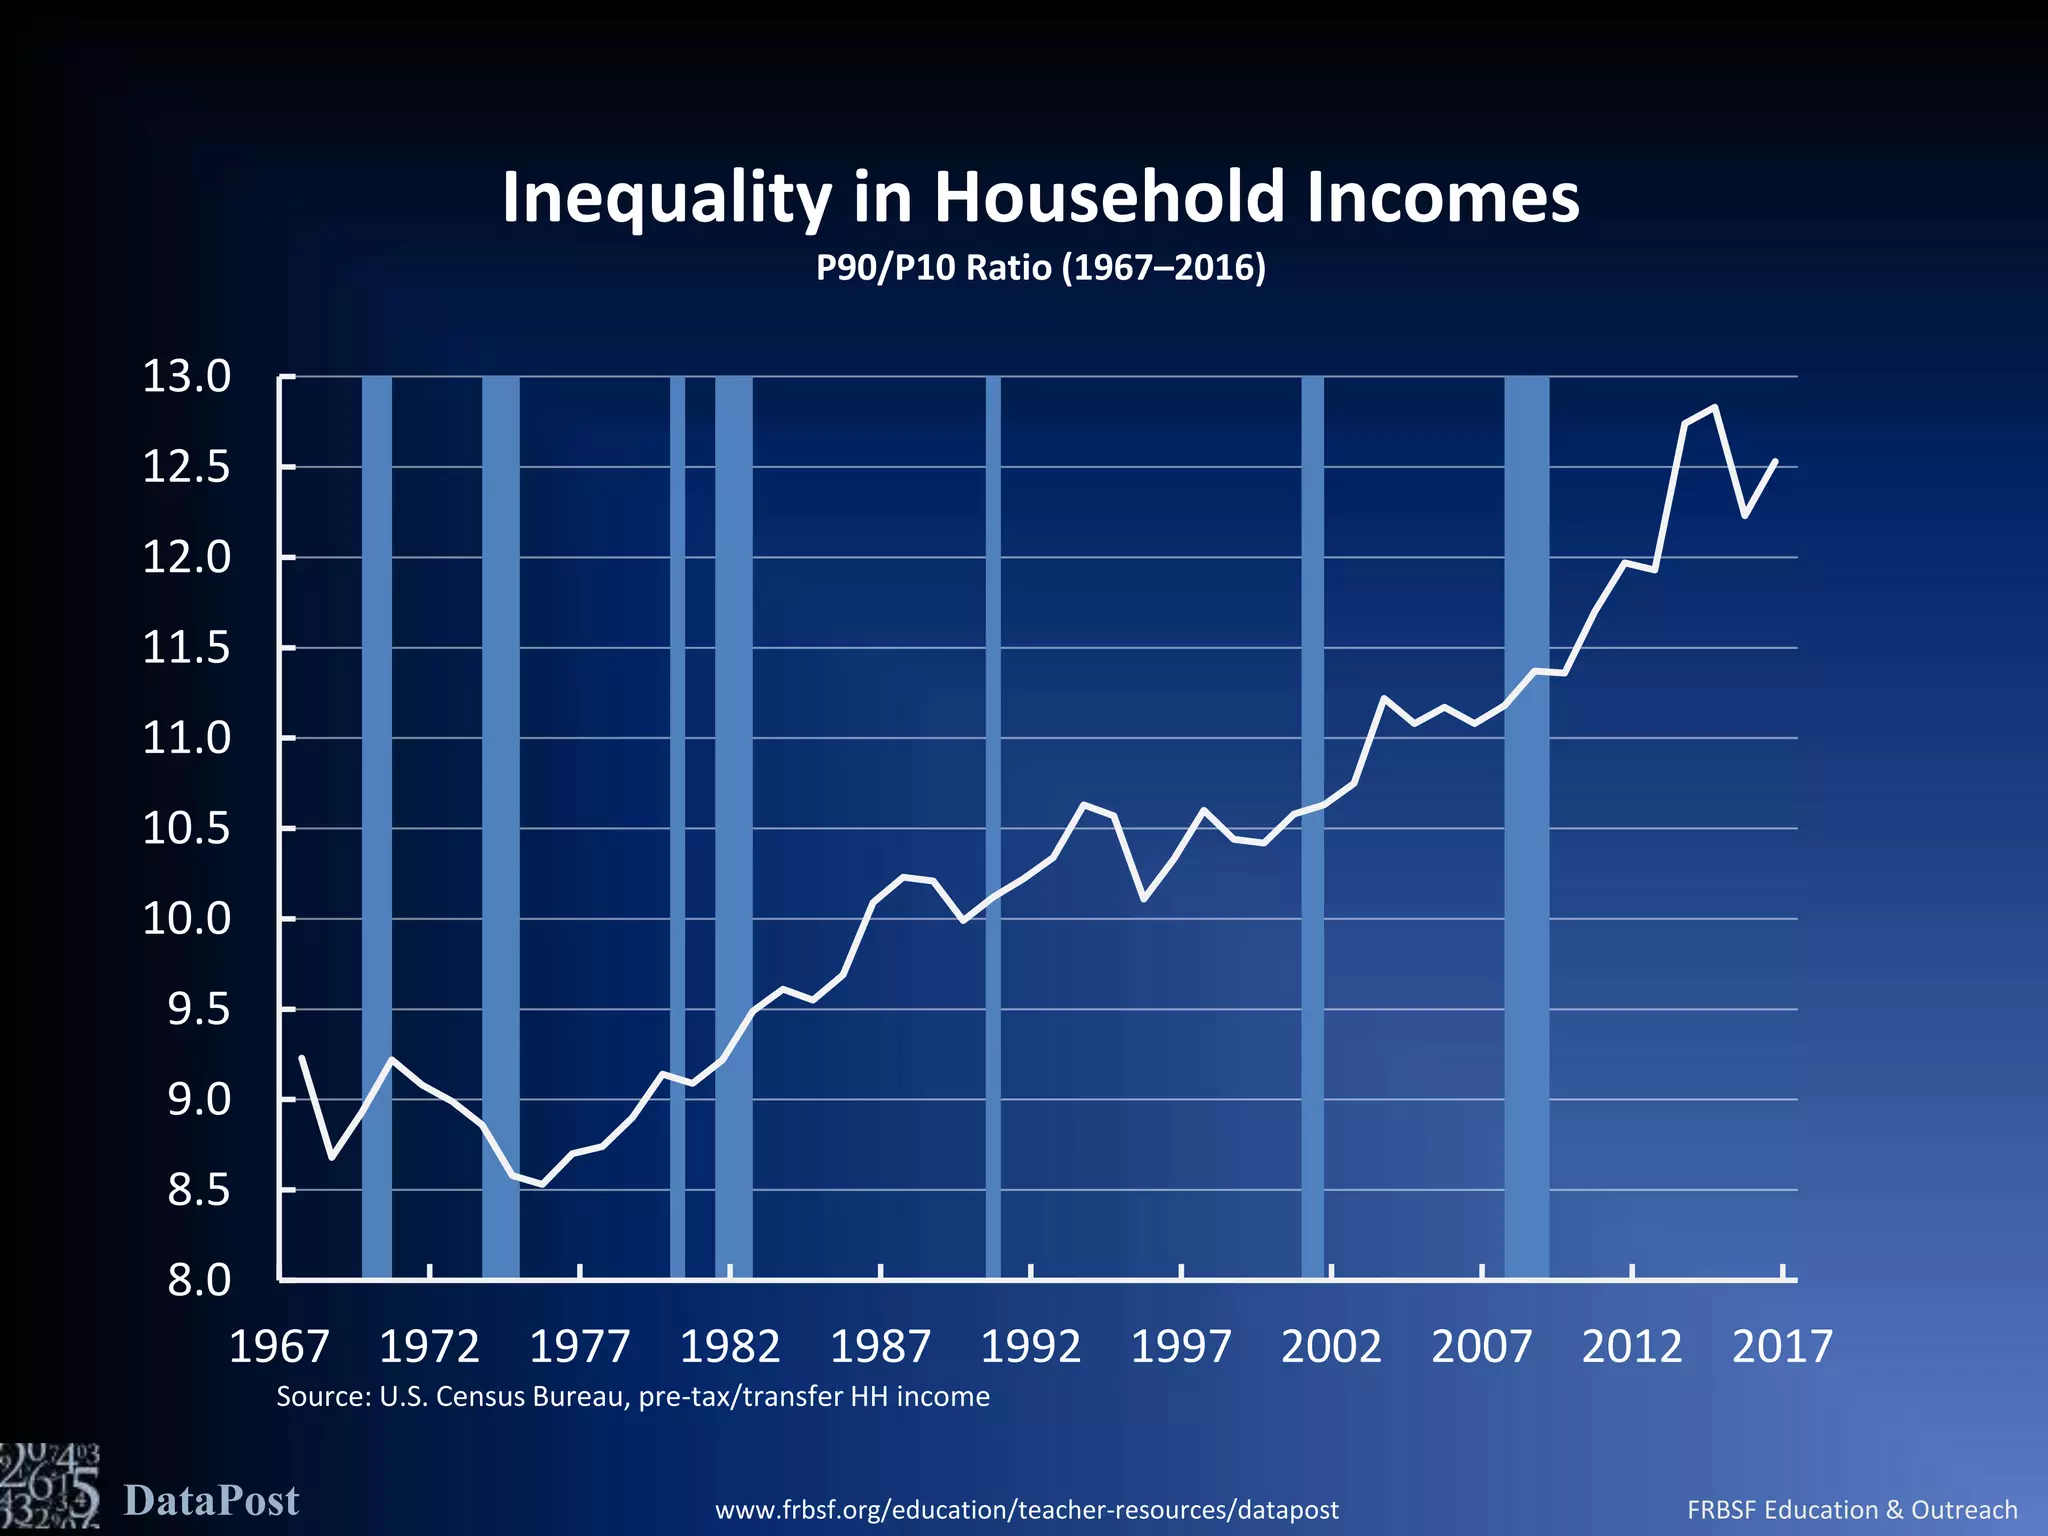


This document discusses income inequality in the United States based on 2016 household income data from the U.S. Census Bureau. It shows that in 2016, the top 10% of households earned over $170,000 while the bottom 10% earned less than $14,000. The ratio of income between the 90th and 10th percentiles (P90/P10 ratio) was 12.53, indicating that the top 10% earned over 12 times as much as the bottom 10%. This ratio has been rising steadily since 1975 and peaked in 2016, showing growing income inequality over time.


