Download to read offline


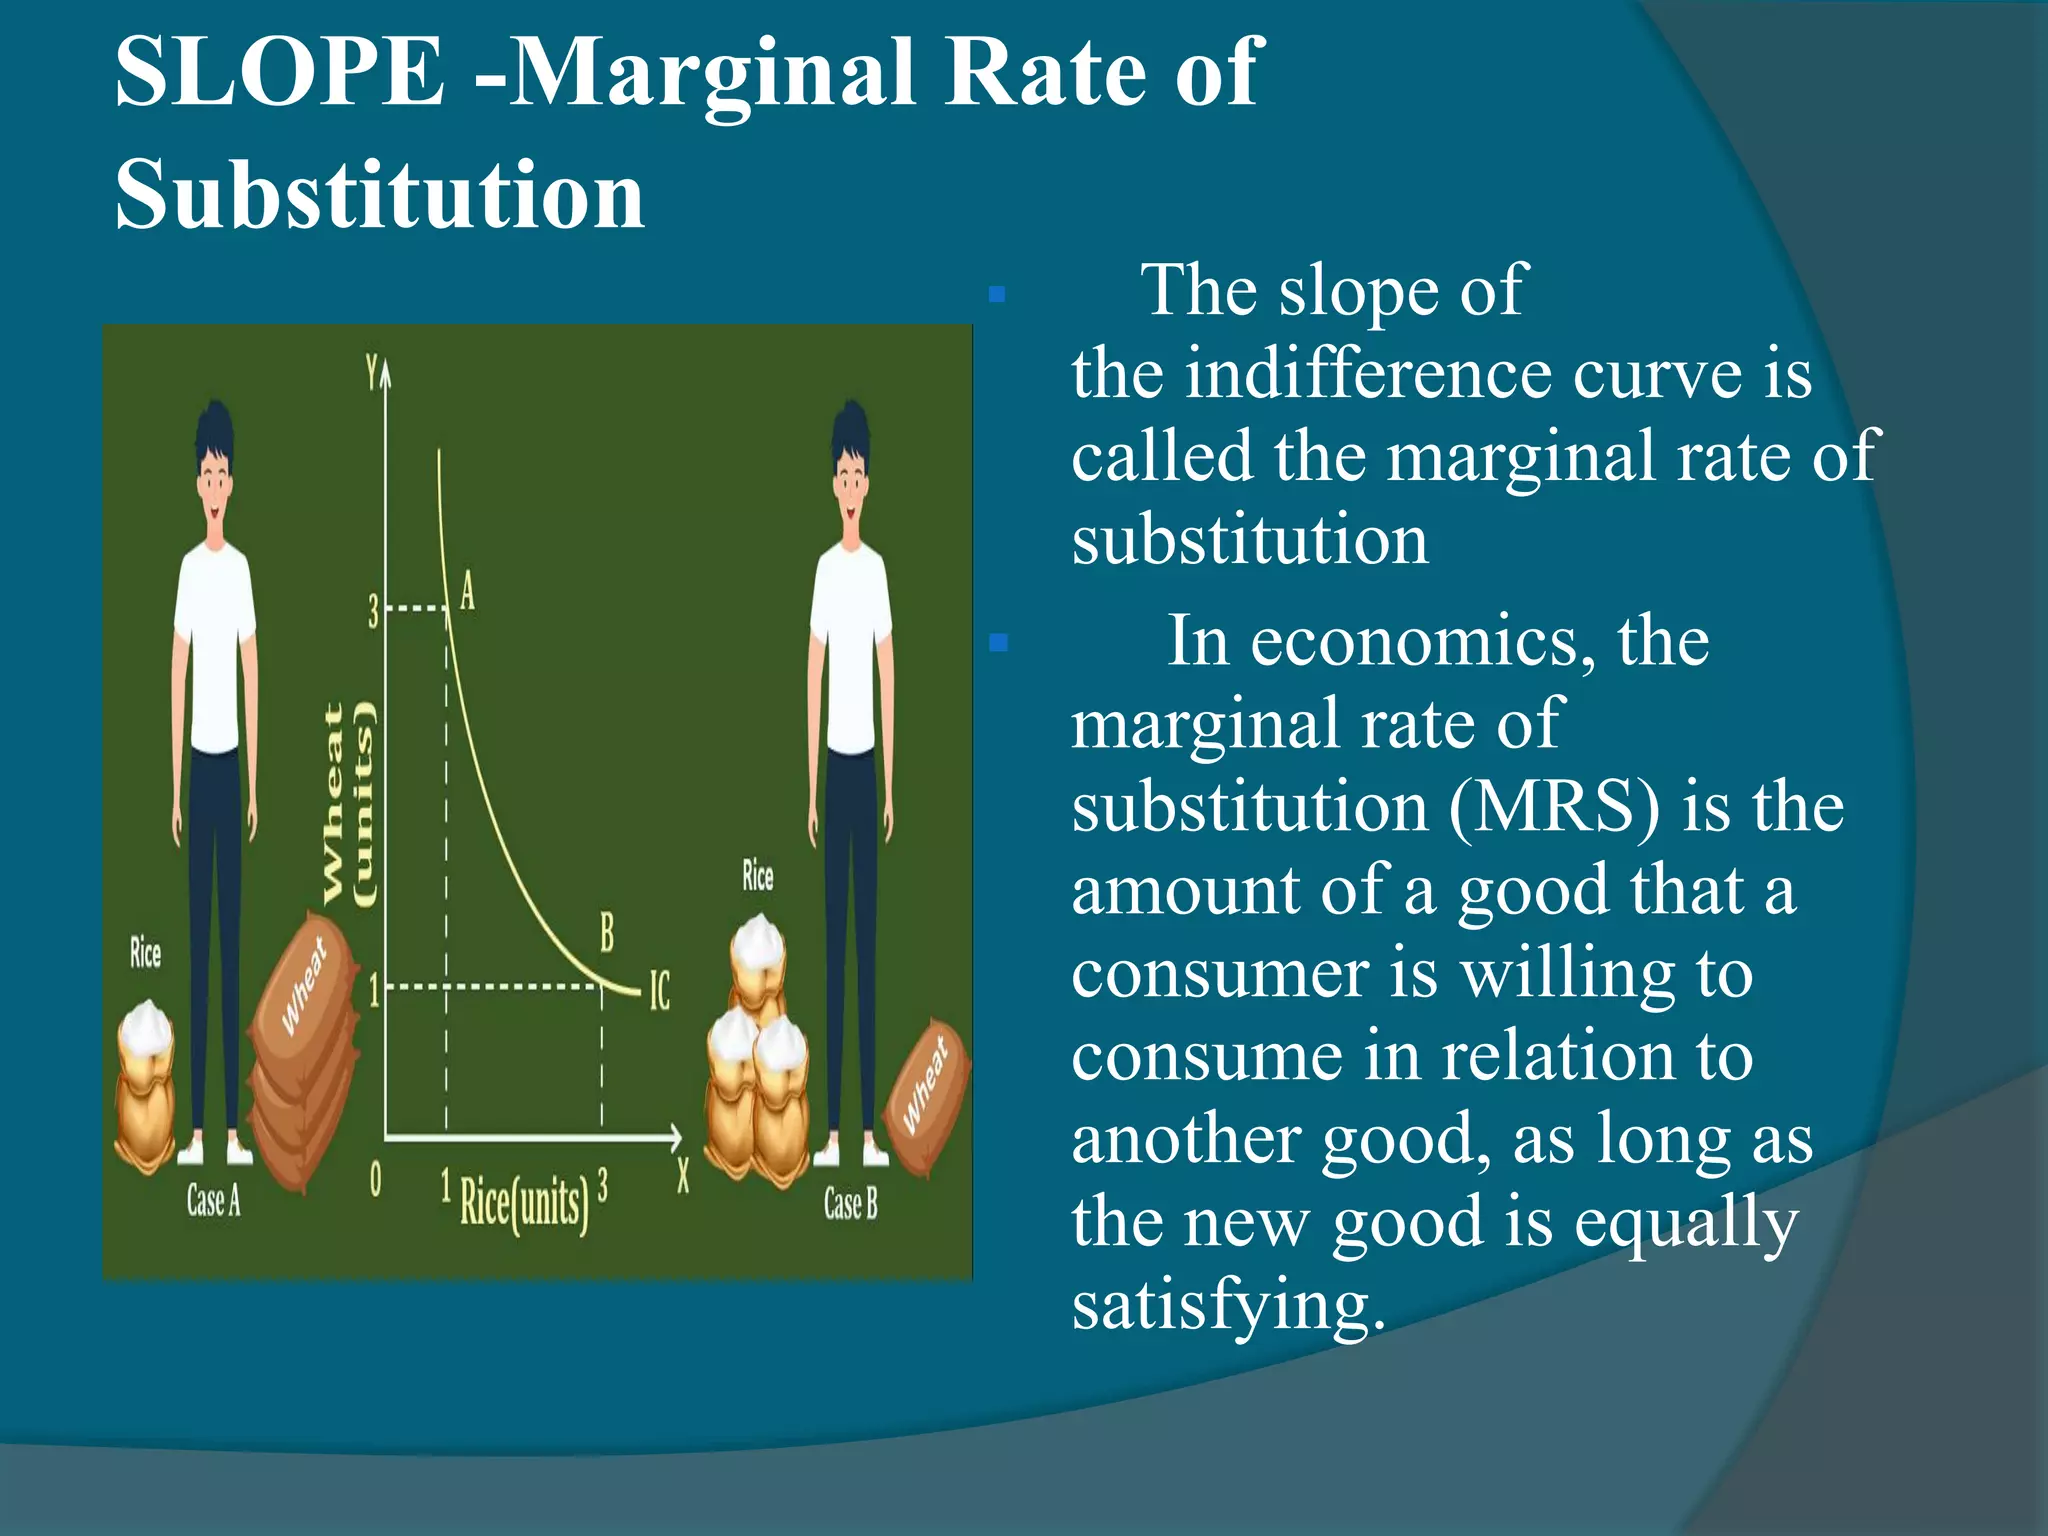
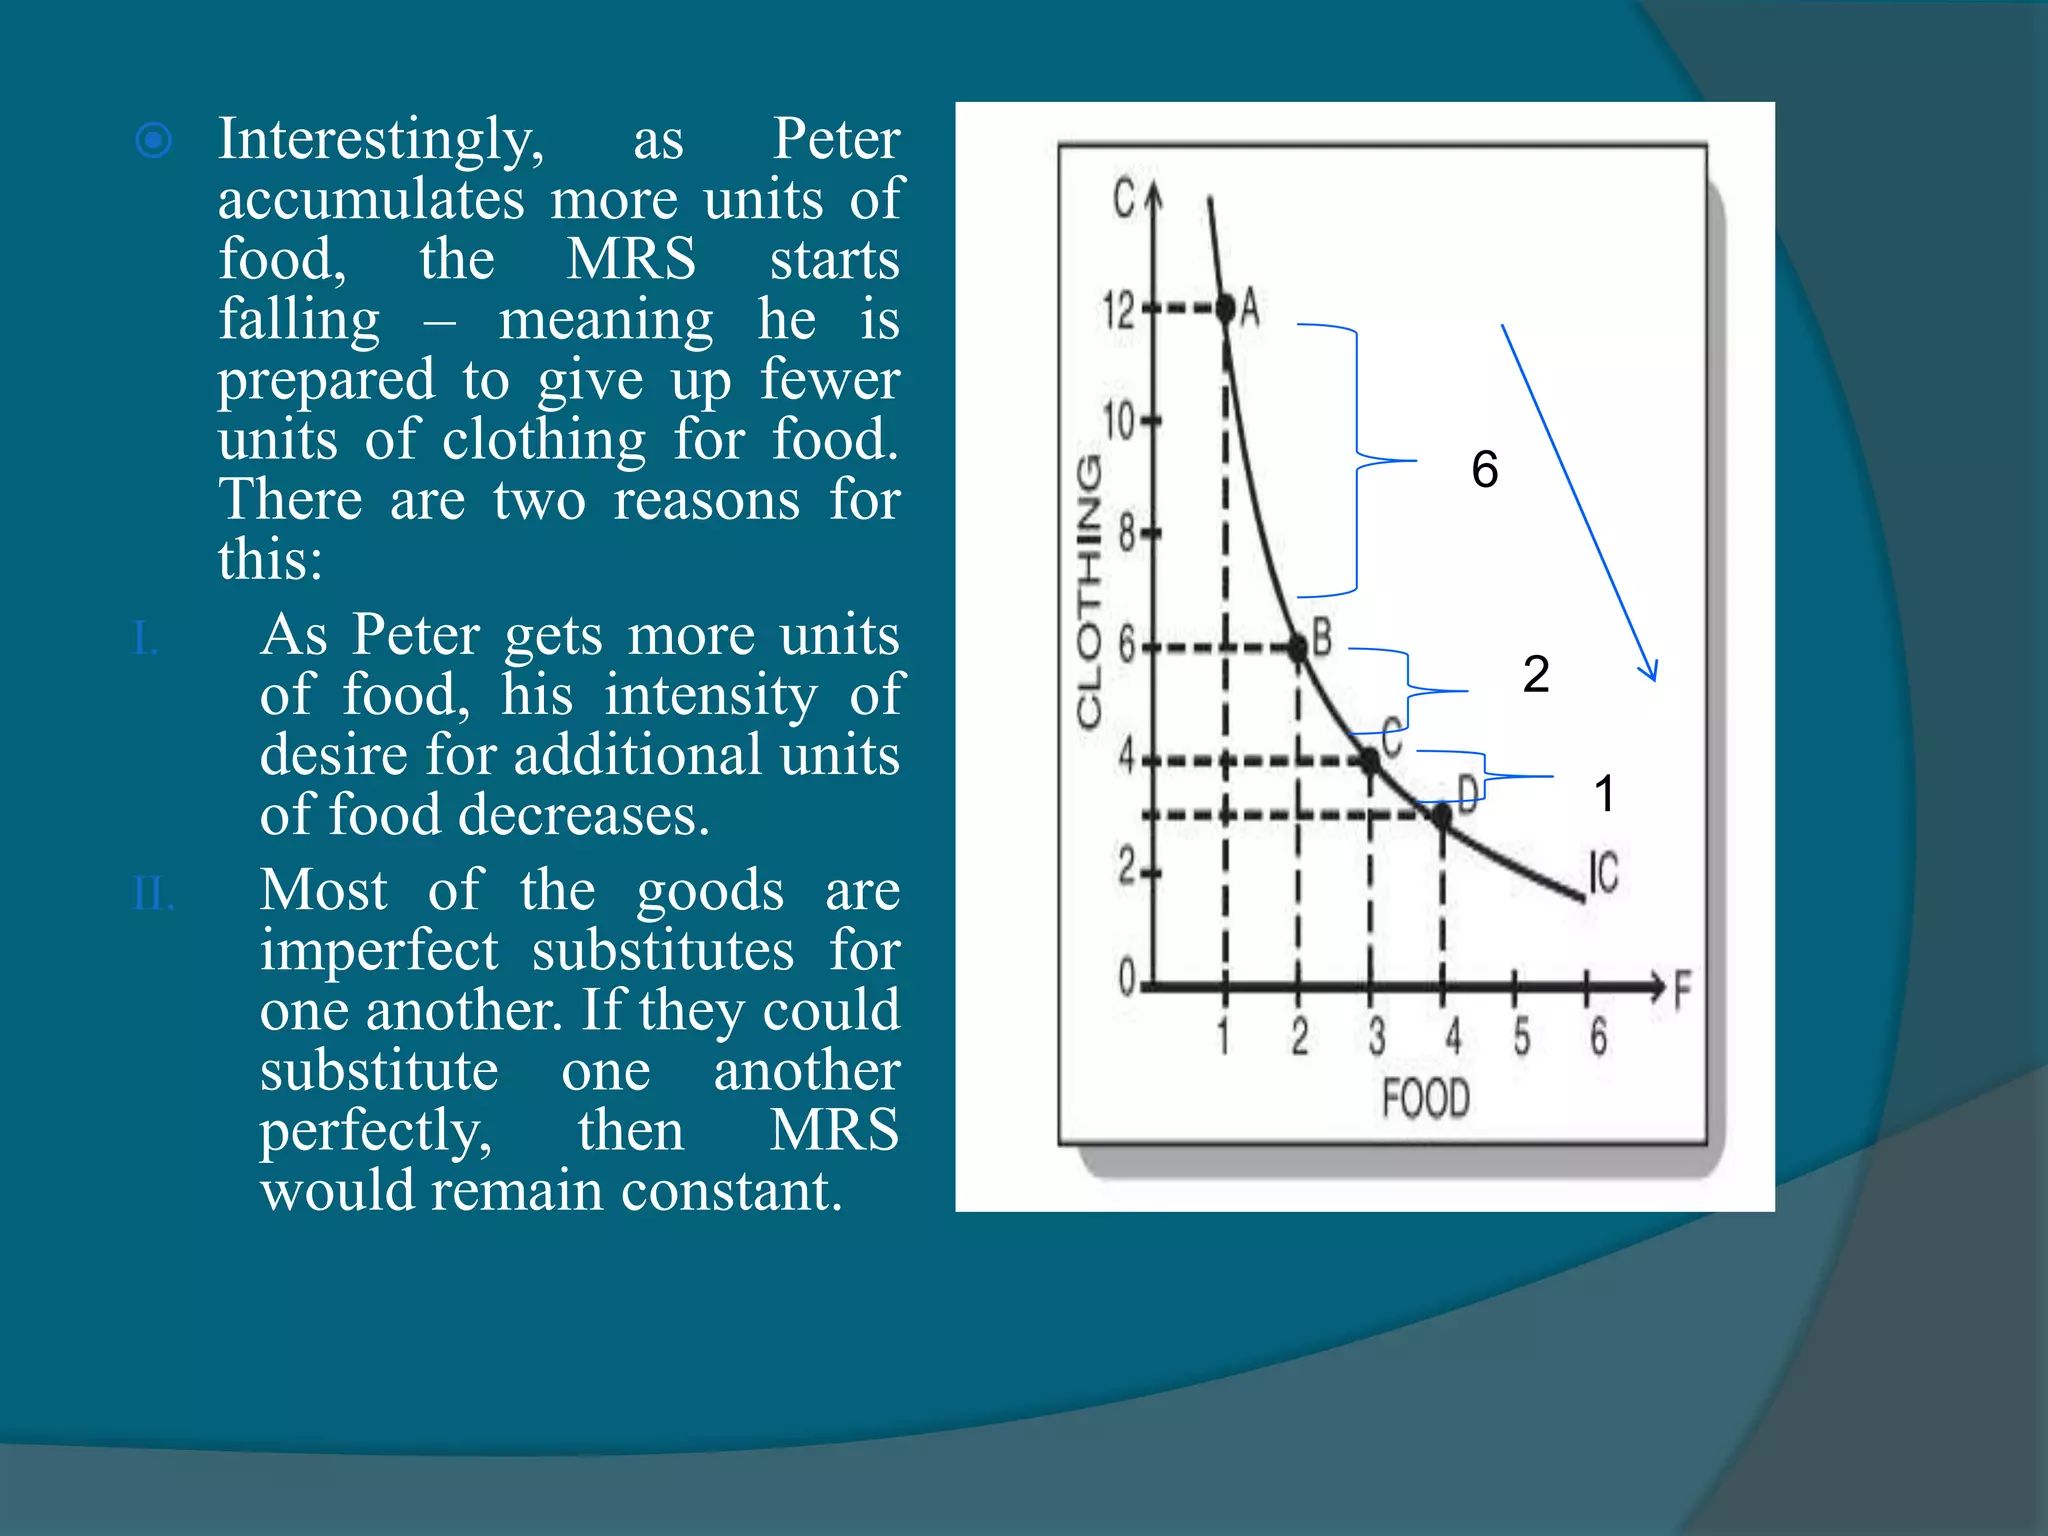


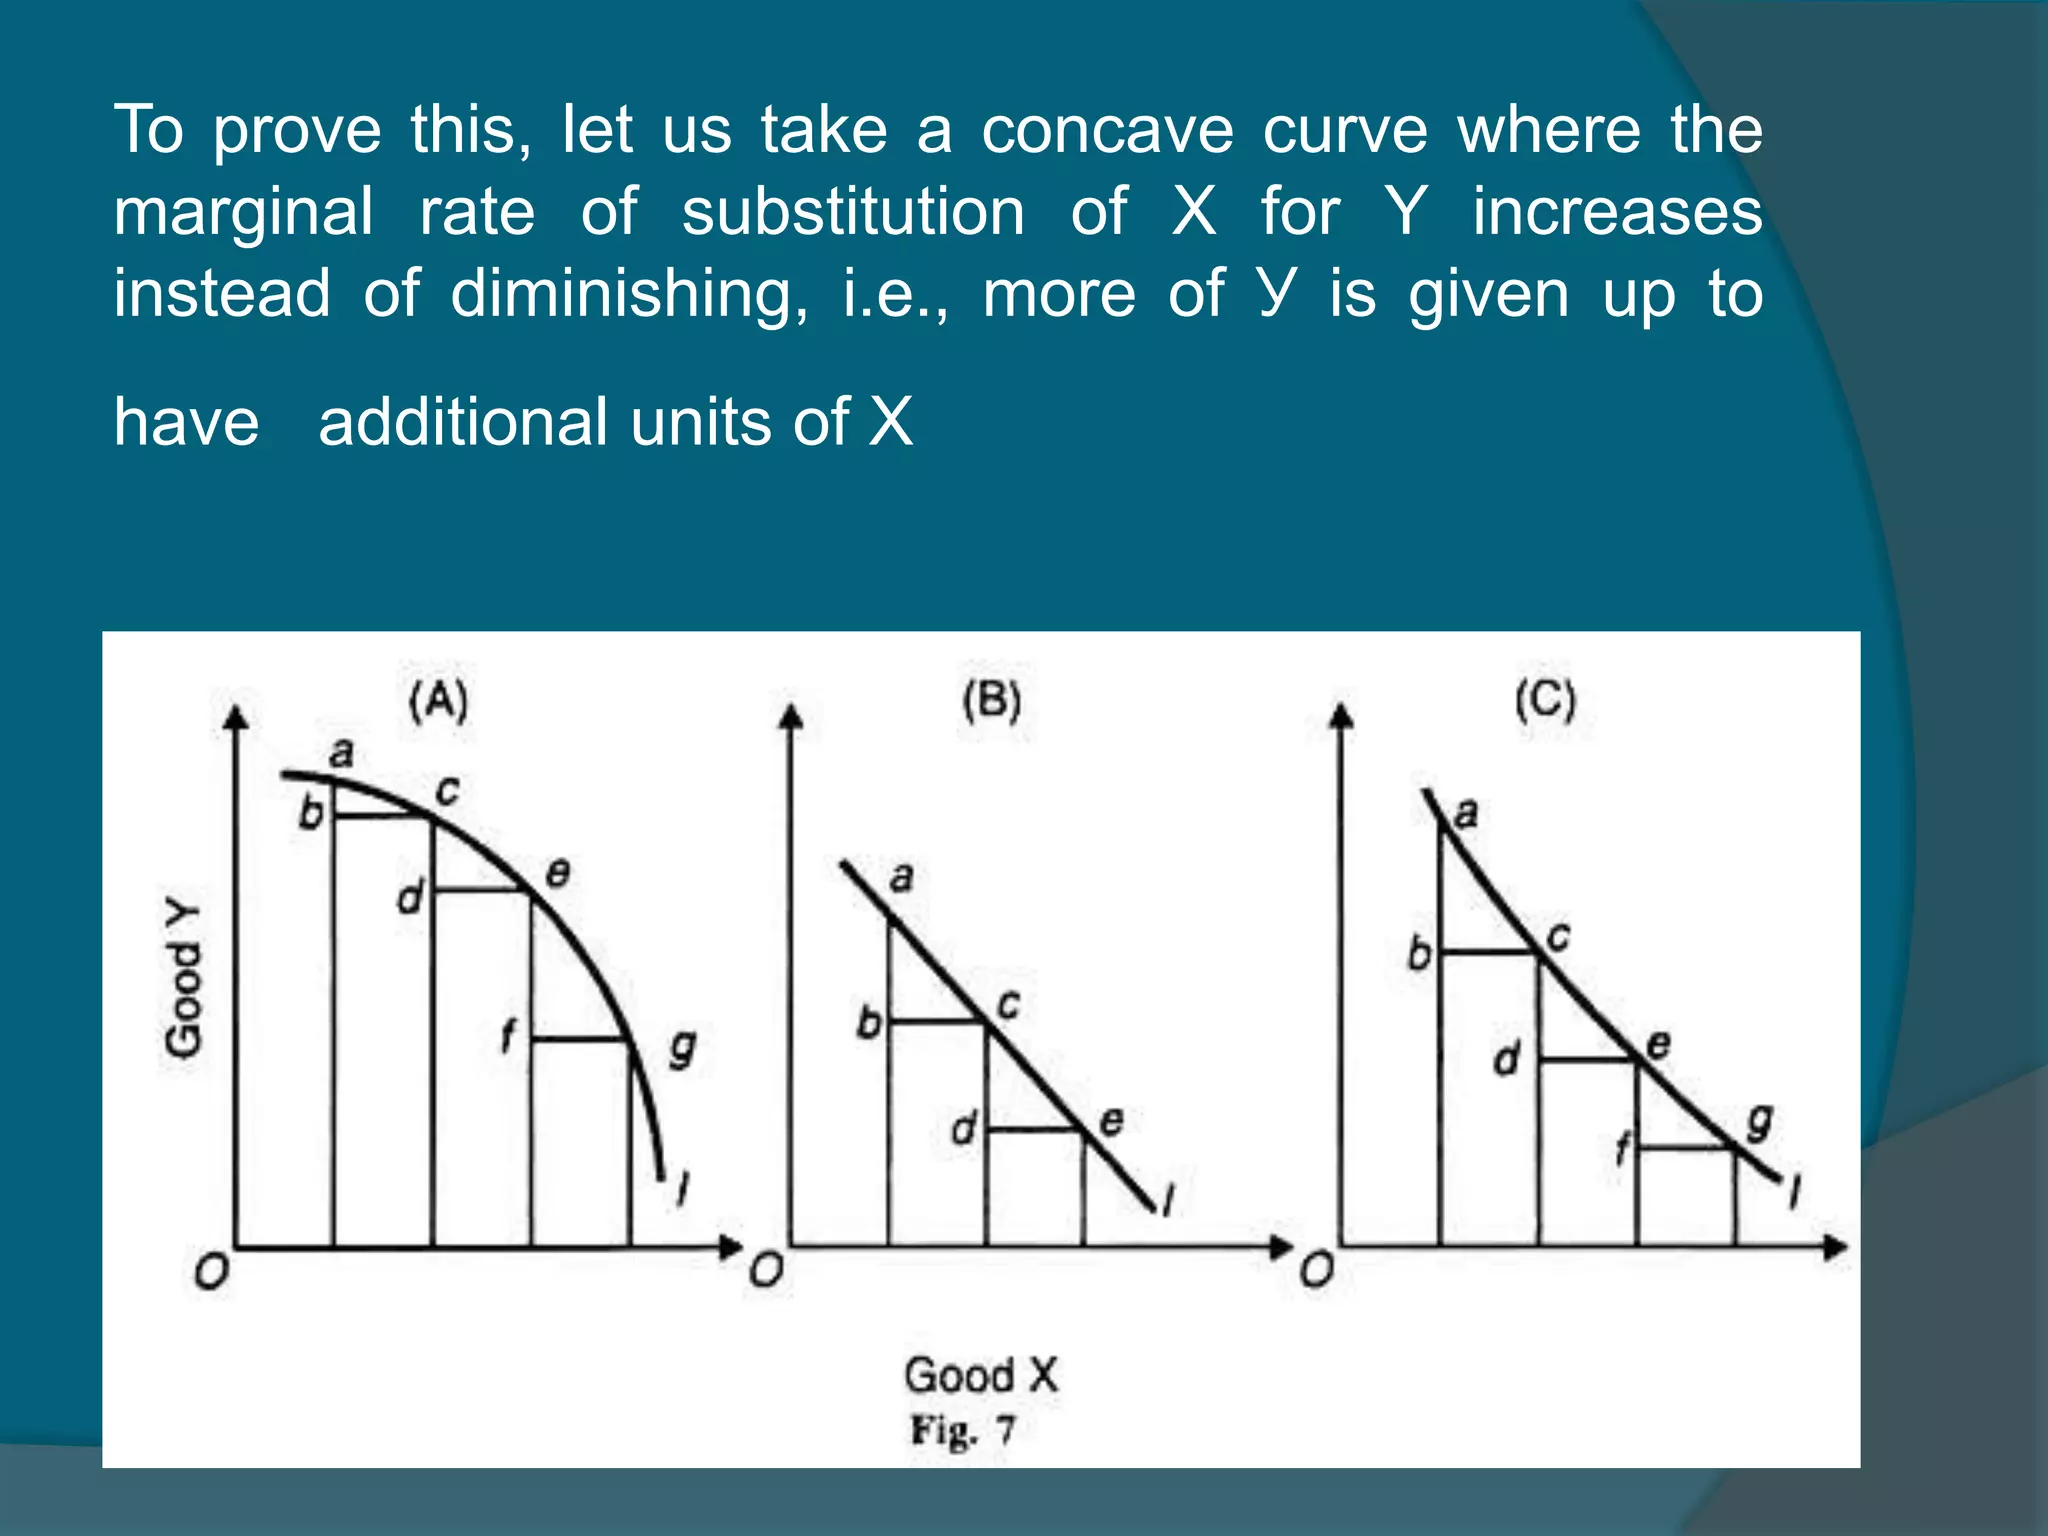
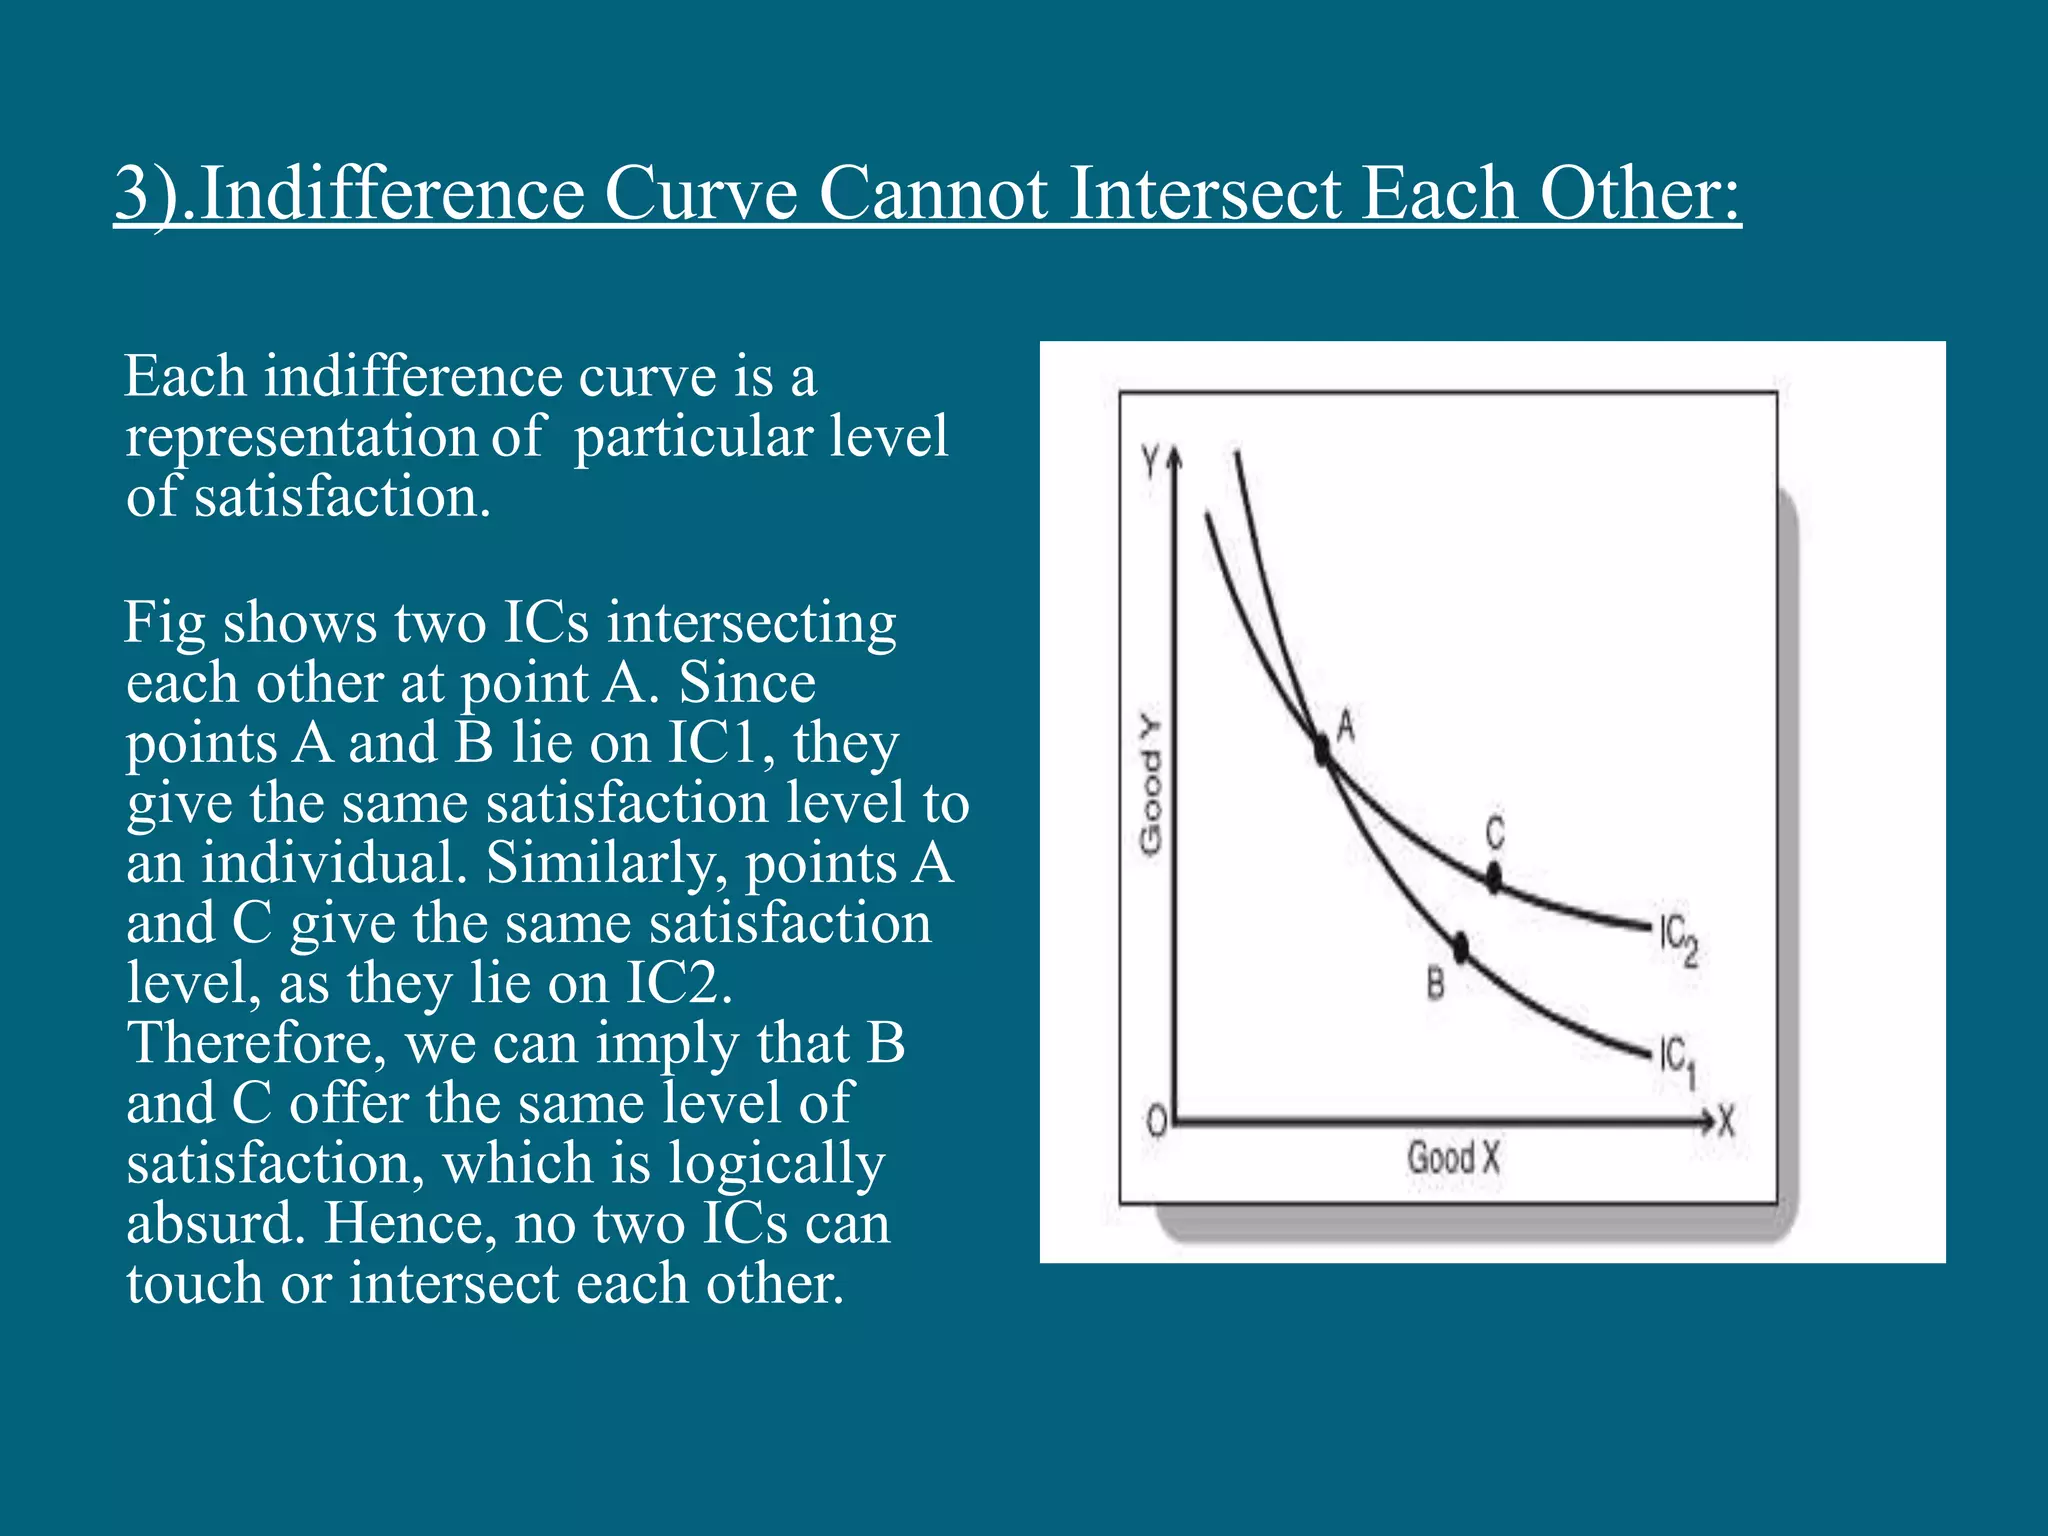
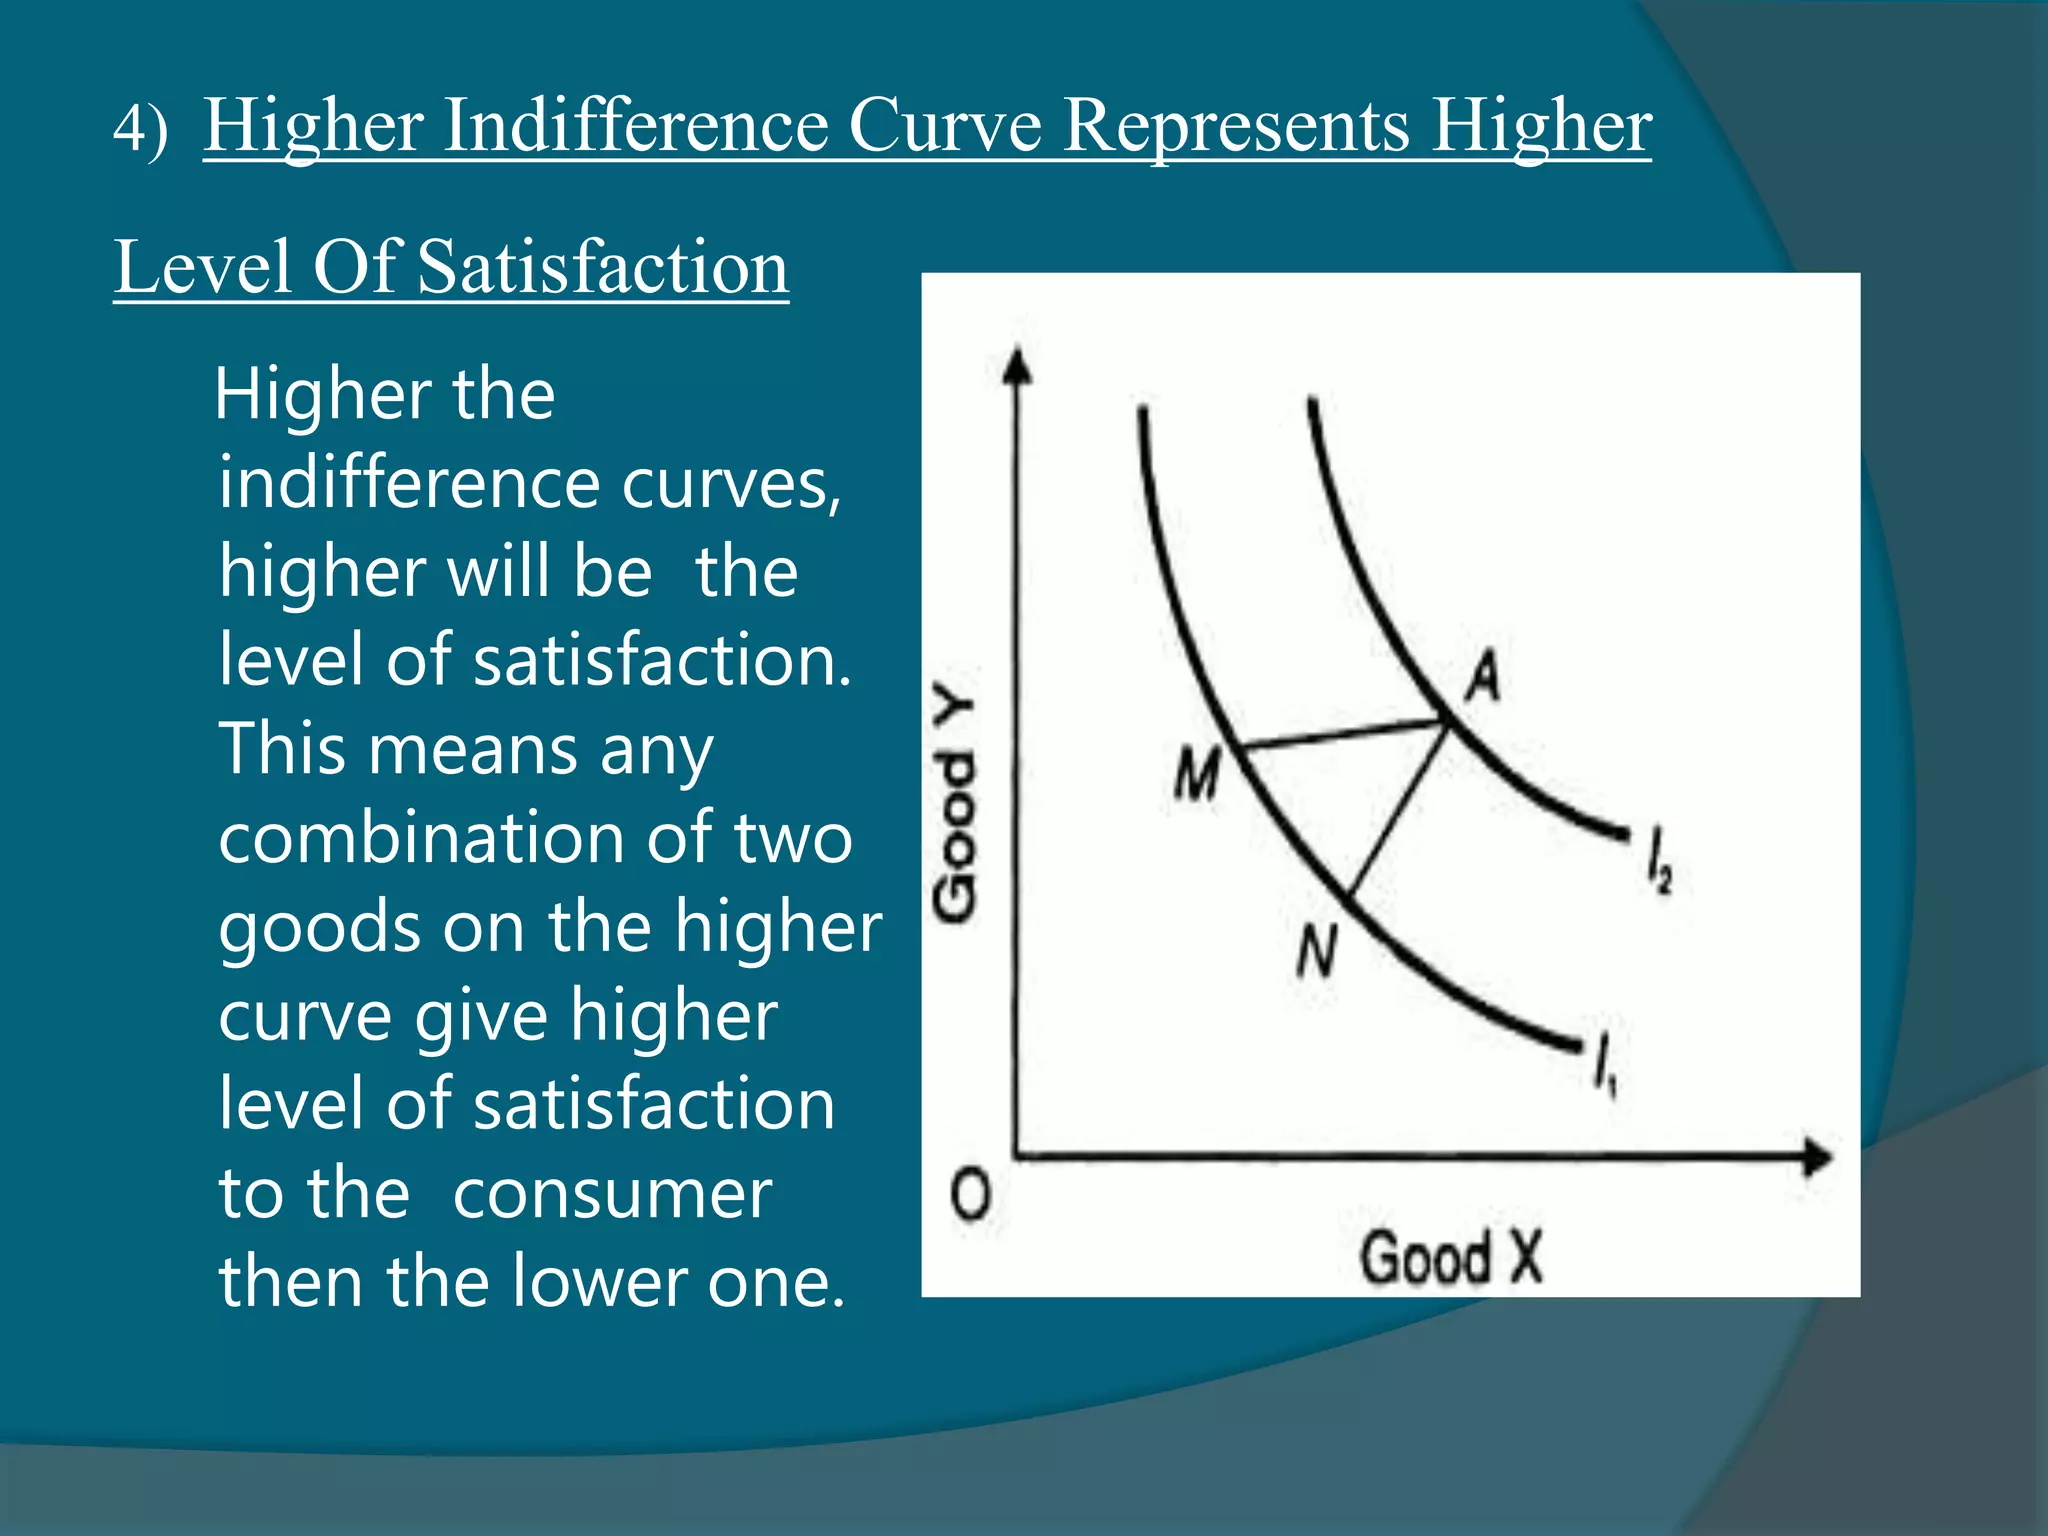


The concept of indifference curves was developed by Francis Ysidro Edgeworth and Vilfredo Pareto in the early 20th century to represent consumer preferences between two goods. An indifference curve connects all combinations of two goods that provide equal satisfaction or utility to the consumer. The slope of the indifference curve, known as the marginal rate of substitution, shows the amount of one good a consumer is willing to give up in exchange for another good while maintaining the same level of satisfaction. Key properties of indifference curves include being downward sloping, convex to the origin, not intersecting each other, with higher curves representing higher satisfaction levels.


![7 presentation meetings proxy and quorum etc 27[1].12.2007 2](https://cdn.slidesharecdn.com/ss_thumbnails/7presentationmeetingsproxyandquorumetc271-12-20072-111117095624-phpapp02-thumbnail.jpg?width=640&height=640&fit=bounds)


