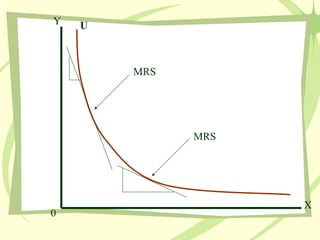
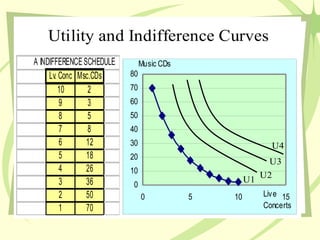
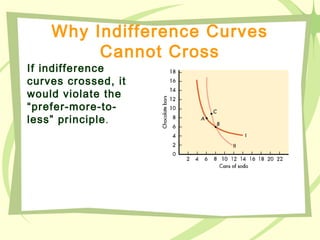
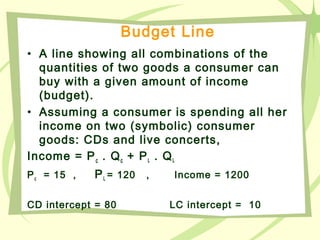
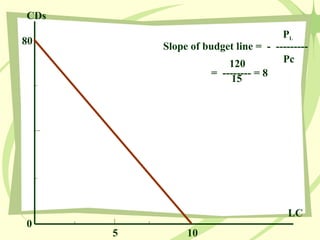
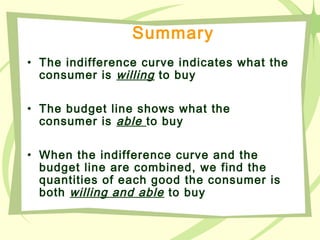
Indifference curves show combinations of goods that provide consumers with the same level of utility or satisfaction. They are convex and bowed inward, reflecting the principle of diminishing marginal utility. The slope of the indifference curve represents the marginal rate of substitution, which declines as consumption increases along the curve. An indifference map uses a series of indifference curves to represent different utility levels. Budget lines show affordable combinations given prices and income. The point where the highest indifference curve is tangent to the budget line indicates the utility-maximizing choice.