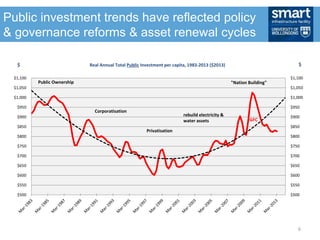
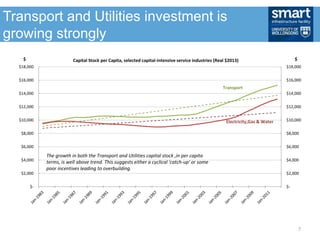
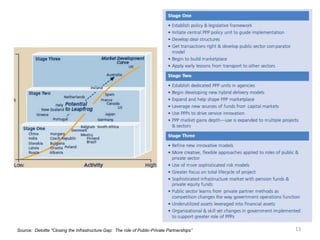
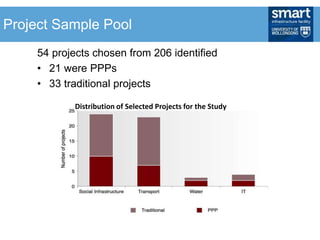
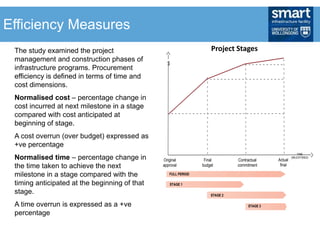
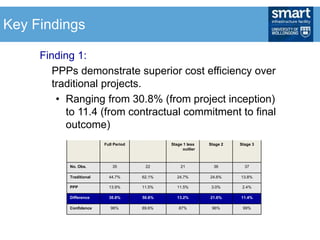
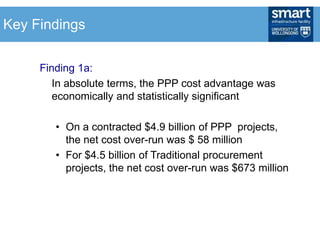
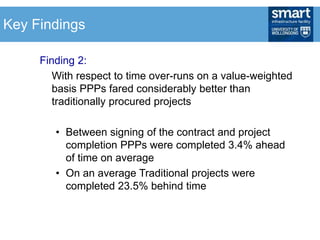
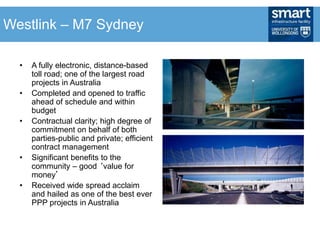
Australia’s
Experience with PPPs in
Infrastructure
Garry Bowditch, Chief Executive
Presentation to Australia Unlimited, June 2014
What is happening to Australia’s
infrastructure investment?
3
Public Investment share is falling as the
private sector assumes a greater role
0%
5%
10%
15%
20%
25%
30%
35%
40%
Sep-1959
Sep-1961
Sep-1963
Sep-1965
Sep-1967
Sep-1969
Sep-1971
Sep-1973
Sep-1975
Sep-1977
Sep-1979
Sep-1981
Sep-1983
Sep-1985
Sep-1987
Sep-1989
Sep-1991
Sep-1993
Sep-1995
Sep-1997
Sep-1999
Sep-2001
Sep-2003
Sep-2005
Sep-2007
Sep-2009
Sep-2011
Public Investment as a share of Total Investment, 1959-2013%
Peak 35.5% in June 1975
Low 16.5% in March 1998 16.6% in Sept & Dec 2007
Greiner/Fahey (1988-1996);
Goss (1989-1996)
Kennett (1992-1999)
- corporatisation and privatisation
models
- significant fiscal consolidation in
Victoria and NSW
- strong fiscal rules in Queensland
Heavy Government Borrowing
"Nation Building" , particularly Qld and C/W
Peak 23% in March 2010
4
-
10
20
30
40
50
60
70
80
90
100
-
10
20
30
40
50
60
70
80
90
100
$ billion (2013) $ billion (2013)Total Annual Public and Private Investment, (Constant $2013)
Total Annual Public Investment ($2013)
Total Annual Private Investment ($2013)
5
Private investment is now four times
larger than public investment
Public investment trends have reflected policy
& governance reforms & asset renewal cycles
$500
$550
$600
$650
$700
$750
$800
$850
$900
$950
$1,000
$1,050
$1,100
$500
$550
$600
$650
$700
$750
$800
$850
$900
$950
$1,000
$1,050
$1,100
$ Real Annual Total Public Investment per capita, 1983-2013 ($2013)
Public Ownership
Corporatisation
Privatisation
"Nation Building"
$
rebuild electricity &
water assets GFC
6
Transport and Utilities investment is
growing strongly
$-
$2,000
$4,000
$6,000
$8,000
$10,000
$12,000
$14,000
$16,000
$18,000
$-
$2,000
$4,000
$6,000
$8,000
$10,000
$12,000
$14,000
$16,000
$18,000
Transport
Electricity,Gas & Water
$ $Capital Stock per Capita, selected capital-intensive service industries (Real $2013)
The growth in both the Transport and Utilities capital stock ,in per capita
terms, is well above trend. This suggests either a cyclical 'catch-up' or some
poor incentives leading to overbuilding.
7
Why has Australia been an early
innovator with PPPs?
8
• What Government can do:
• Leverage their asset situation
• Mix the established cash flows of old assets
• Give private sector an obligation to replenish and
build new infrastructure
• Positively change the attractiveness of
infrastructure investment
• Brings on new projects, in shorter period of time
Attracting Investment
Four key elements define infrastructure investment
opportunity type:
1. Project or Enterprise
– economic/ social
2. Contractual approach
– privatisation/ license/ concession/ partnership
3. Phase of asset development
– existing & established/ new & tested/ new & innovative
4. Stage of development of the market
– Undeveloped/ developing/ developed
Source: World Economic Forum, Maximizing the Value of Private Finance in Infrastructure, 2010
Investment Opportunity Types
• Whole of life (design,
construct, operate)
• Assigning risk to parties
best capable of
managing it.
• Creation of an asset for
public through private
sector financing, and risk
transference.
• Contribution by the
government through
planning, capital works,
capital contribution etc.
What is a PPP?
• No definite rule; Case by case basis.
• PPPs are the natural choice for large, complex and high
profile infrastructure projects.
• Compared to traditional projects, PPPs deliver value-for-
money to the state for complex projects in terms of cost
and time savings.
When to use PPP’s
13Source: Deloitte “Closing the Infrastructure Gap: The role of Public-Private Partnerships”
54 projects chosen from 206 identified
• 21 were PPPs
• 33 traditional projects
Distribution of Selected Projects for the Study
Project Sample Pool
The study examined the project
management and construction phases of
infrastructure programs. Procurement
efficiency is defined in terms of time and
cost dimensions.
Normalised cost – percentage change in
cost incurred at next milestone in a stage
compared with cost anticipated at
beginning of stage.
A cost overrun (over budget) expressed as
+ve percentage
Normalised time – percentage change in
the time taken to achieve the next
milestone in a stage compared with the
timing anticipated at the beginning of that
stage.
A time overrun is expressed as a +ve
percentage
Project Stages
FULL PERIOD
Original
approval
Final
budget
Contractual
commitment
Actual
final
$
TIME
(MILESTONES)
STAGE 1
STAGE 2
STAGE 3
Efficiency Measures
Full Period Stage 1 less
outlier
Stage 2 Stage 3
No. Obs. 35 22 21 36 37
Traditional 44.7% 62.1% 24.7% 24.6% 13.8%
PPP 13.9% 11.5% 11.5% 3.0% 2.4%
Difference 30.8% 50.6% 13.2% 21.6% 11.4%
Confidence 96% 89.6% 87% 96% 99%
Finding 1:
PPPs demonstrate superior cost efficiency over
traditional projects.
• Ranging from 30.8% (from project inception)
to 11.4 (from contractual commitment to final
outcome)
Key Findings
Finding 1a:
In absolute terms, the PPP cost advantage was
economically and statistically significant
• On a contracted $4.9 billion of PPP projects,
the net cost over-run was $ 58 million
• For $4.5 billion of Traditional procurement
projects, the net cost over-run was $673 million
Key Findings
Finding 2:
With respect to time over-runs on a value-weighted
basis PPPs fared considerably better than
traditionally procured projects
• Between signing of the contract and project
completion PPPs were completed 3.4% ahead
of time on average
• On an average Traditional projects were
completed 23.5% behind time
Key Findings
Finding 3:
• Approximately $400 billion is likely to be spent on
Australian infrastructure over the next decade
• If PPPs account for 10-15% share of this, PPPs
would generate approximately $6 billion in
potential benefit to the community on a
conservative basis
Key Findings
Finding 4:
• Project size and complexity has a marked
(statistically significant) negative impact on time
over-runs of Traditional projects
• In contrast timeliness of completion of PPP projects
were not negatively impacted by size and
complexity of the project
Key Findings
Finding 5:
In contrast to commonly held perceptions, PPP
projects were far more transparent by Traditional
projects, as measured by the availability of public
data for the study
Key Findings
• There is a benefit from completing projects on time
and enabling the community to have access to
infrastructure facilities sooner. This study has not
quantified this benefit.
• The benefits identified in this study do not include the
effect of PPP’s integrated provision of management,
construction and on-going operations.
Underestimation of Benefits
What can be done about Australia’s
Infrastructure Conundrum
23
• Reality is that the government got exactly what it asked
for – ‘an excellent outcome ?’
• Questions concerning ‘value for money’ persist, not
from the viewpoint of government but the public
– Urban amenity - always a significant element of
CCT
– Rich in externalities (third party free riders)
– Point to point charging mechanism (is this the
optimal revenue model)
– If reducing CBD traffic congestion was a goal, then
why not reward this as an outcome if it is achieved
by the proponent.
CCT – Policy Malfunction or not?
• A fully electronic, distance-based
toll road; one of the largest road
projects in Australia
• Completed and opened to traffic
ahead of schedule and within
budget
• Contractual clarity; high degree of
commitment on behalf of both
parties-public and private; efficient
contract management
• Significant benefits to the
community – good ‘value for
money’
• Received wide spread acclaim
and hailed as one of the best ever
PPP projects in Australia
Westlink – M7 Sydney
• Enhances efficiency via:
• Connecting market agents
• Information broker
• Liquidity enables better information discovery
• Lowers transaction costs
Case Study: Cross City Tunnel
• A great hole in the ground or
something much more?
• Public Value equates with:
– Better functioning city
– Enhanced urban amenity
– Less traffic on deck of CBD
(travel time, air quality etc)
– Greater traffic throughput (if
choose tunnel)
• Private Value
– Time value of money versus
toll (customers)
– Greater choice ?
– Traffic volumes (NPV of future
revenue streams)
Case Study: Cross City Tunnel
• Forecasting costs & revenue over long term is
difficult
• NSW Govt led procurement
• Primary objective: reduce through traffic for CBD
• Resulting in: less congestion, improved amenity, better
flows
• 2.1Km long tunnel Sydney, Australia
• Public-private partnership: design, build, finance, operate
• Charge users a toll
• Opened for traffic August 2005
• Never reached the levels forecast
• December 2006, company insolvent, debts +$500 million
Case Study: Cross City Tunnel
• Lessons learned
• Develop realistic & accurate forecasts
• Assessment of project bids should include identification of
key assumptions
• Need to develop better and more flexible pricing models
for PPPs
• Need for greater transparency in PPP contracts
• Need for governments to pursue PPP projects that are
profitable plus protect and improve the public interest
Case Study: Cross City Tunnel
• How do you expand the port when the Govt.
budget tight?
• Sell the asset on a 99 year lease
• couple the sale with an obligation to fund and build a
new major road to the port
• $2.1 billion to Government
• plus the consortium will pay $200 million for the
roadway upgrade
• taxpayer also avoids future port infrastructure
expansion costs of up to $1 billion.
How do you expand the port when Govt. budget is tight?
Case Study: Brisbane Airport
• How do you expand the port when the Govt. budget
tight?
• Sell the asset on a 99 year lease
• Couple the sale with an obligation to fund and build a
new major road to the port
• $2.1 billion to Government
• Consortium will pay $200 million for roadway upgrade
• Taxpayer avoids future port infrastructure expansion
costs of up to $1 billion.
 The NSW Auditor General’s Office
and NSW Treasury have also provided
guidance, most recently in the reviews
of the PPP for new government
schools in western Sydney. Their
reports endorsed the State’s decision
to use private finance, finding that:
o the nine schools were delivered
two years earlier than if traditional
public sector procurement was
used;
o innovation was advanced, like
child care centres and on-site
maintenance managers; and
o the savings using PPP delivery
were retained by the Education
Department, with $7m of capital
savings used for other school
projects.
New South Wales’ Experience
• Onus is on private sector to demonstrate it can build and
operate infrastructure (toll roads) better.
– Faster delivery
– Innovative design and ongoing management
– Better service, smarter ways of doing it
– It is not just about saving the government money – third order
issue
• Willingness to learn & improve
– Admit mistakes
– Prepared to acknowledge and front the community and share the
political risk both upside and downside
– Profit is a great motivator, but also innovation must be
demonstrable and result in better service delivery
– Celebrate and communicate the successes
Even higher hurdle for proponents
Garry Bowditch
CEO
SMART Infrastructure Facility
+61 414 977 683
garrybow@uow.edu.au
Australia's Experience with PPPs in Infrastructure

Australia's Experience with PPPs in Infrastructure

  • 1.
    Australia’s Experience with PPPsin Infrastructure Garry Bowditch, Chief Executive Presentation to Australia Unlimited, June 2014
  • 3.
    What is happeningto Australia’s infrastructure investment? 3
  • 4.
    Public Investment shareis falling as the private sector assumes a greater role 0% 5% 10% 15% 20% 25% 30% 35% 40% Sep-1959 Sep-1961 Sep-1963 Sep-1965 Sep-1967 Sep-1969 Sep-1971 Sep-1973 Sep-1975 Sep-1977 Sep-1979 Sep-1981 Sep-1983 Sep-1985 Sep-1987 Sep-1989 Sep-1991 Sep-1993 Sep-1995 Sep-1997 Sep-1999 Sep-2001 Sep-2003 Sep-2005 Sep-2007 Sep-2009 Sep-2011 Public Investment as a share of Total Investment, 1959-2013% Peak 35.5% in June 1975 Low 16.5% in March 1998 16.6% in Sept & Dec 2007 Greiner/Fahey (1988-1996); Goss (1989-1996) Kennett (1992-1999) - corporatisation and privatisation models - significant fiscal consolidation in Victoria and NSW - strong fiscal rules in Queensland Heavy Government Borrowing "Nation Building" , particularly Qld and C/W Peak 23% in March 2010 4
  • 5.
    - 10 20 30 40 50 60 70 80 90 100 - 10 20 30 40 50 60 70 80 90 100 $ billion (2013)$ billion (2013)Total Annual Public and Private Investment, (Constant $2013) Total Annual Public Investment ($2013) Total Annual Private Investment ($2013) 5 Private investment is now four times larger than public investment
  • 6.
    Public investment trendshave reflected policy & governance reforms & asset renewal cycles $500 $550 $600 $650 $700 $750 $800 $850 $900 $950 $1,000 $1,050 $1,100 $500 $550 $600 $650 $700 $750 $800 $850 $900 $950 $1,000 $1,050 $1,100 $ Real Annual Total Public Investment per capita, 1983-2013 ($2013) Public Ownership Corporatisation Privatisation "Nation Building" $ rebuild electricity & water assets GFC 6
  • 7.
    Transport and Utilitiesinvestment is growing strongly $- $2,000 $4,000 $6,000 $8,000 $10,000 $12,000 $14,000 $16,000 $18,000 $- $2,000 $4,000 $6,000 $8,000 $10,000 $12,000 $14,000 $16,000 $18,000 Transport Electricity,Gas & Water $ $Capital Stock per Capita, selected capital-intensive service industries (Real $2013) The growth in both the Transport and Utilities capital stock ,in per capita terms, is well above trend. This suggests either a cyclical 'catch-up' or some poor incentives leading to overbuilding. 7
  • 8.
    Why has Australiabeen an early innovator with PPPs? 8
  • 9.
    • What Governmentcan do: • Leverage their asset situation • Mix the established cash flows of old assets • Give private sector an obligation to replenish and build new infrastructure • Positively change the attractiveness of infrastructure investment • Brings on new projects, in shorter period of time Attracting Investment
  • 10.
    Four key elementsdefine infrastructure investment opportunity type: 1. Project or Enterprise – economic/ social 2. Contractual approach – privatisation/ license/ concession/ partnership 3. Phase of asset development – existing & established/ new & tested/ new & innovative 4. Stage of development of the market – Undeveloped/ developing/ developed Source: World Economic Forum, Maximizing the Value of Private Finance in Infrastructure, 2010 Investment Opportunity Types
  • 11.
    • Whole oflife (design, construct, operate) • Assigning risk to parties best capable of managing it. • Creation of an asset for public through private sector financing, and risk transference. • Contribution by the government through planning, capital works, capital contribution etc. What is a PPP?
  • 12.
    • No definiterule; Case by case basis. • PPPs are the natural choice for large, complex and high profile infrastructure projects. • Compared to traditional projects, PPPs deliver value-for- money to the state for complex projects in terms of cost and time savings. When to use PPP’s
  • 13.
    13Source: Deloitte “Closingthe Infrastructure Gap: The role of Public-Private Partnerships”
  • 14.
    54 projects chosenfrom 206 identified • 21 were PPPs • 33 traditional projects Distribution of Selected Projects for the Study Project Sample Pool
  • 15.
    The study examinedthe project management and construction phases of infrastructure programs. Procurement efficiency is defined in terms of time and cost dimensions. Normalised cost – percentage change in cost incurred at next milestone in a stage compared with cost anticipated at beginning of stage. A cost overrun (over budget) expressed as +ve percentage Normalised time – percentage change in the time taken to achieve the next milestone in a stage compared with the timing anticipated at the beginning of that stage. A time overrun is expressed as a +ve percentage Project Stages FULL PERIOD Original approval Final budget Contractual commitment Actual final $ TIME (MILESTONES) STAGE 1 STAGE 2 STAGE 3 Efficiency Measures
  • 16.
    Full Period Stage1 less outlier Stage 2 Stage 3 No. Obs. 35 22 21 36 37 Traditional 44.7% 62.1% 24.7% 24.6% 13.8% PPP 13.9% 11.5% 11.5% 3.0% 2.4% Difference 30.8% 50.6% 13.2% 21.6% 11.4% Confidence 96% 89.6% 87% 96% 99% Finding 1: PPPs demonstrate superior cost efficiency over traditional projects. • Ranging from 30.8% (from project inception) to 11.4 (from contractual commitment to final outcome) Key Findings
  • 17.
    Finding 1a: In absoluteterms, the PPP cost advantage was economically and statistically significant • On a contracted $4.9 billion of PPP projects, the net cost over-run was $ 58 million • For $4.5 billion of Traditional procurement projects, the net cost over-run was $673 million Key Findings
  • 18.
    Finding 2: With respectto time over-runs on a value-weighted basis PPPs fared considerably better than traditionally procured projects • Between signing of the contract and project completion PPPs were completed 3.4% ahead of time on average • On an average Traditional projects were completed 23.5% behind time Key Findings
  • 19.
    Finding 3: • Approximately$400 billion is likely to be spent on Australian infrastructure over the next decade • If PPPs account for 10-15% share of this, PPPs would generate approximately $6 billion in potential benefit to the community on a conservative basis Key Findings
  • 20.
    Finding 4: • Projectsize and complexity has a marked (statistically significant) negative impact on time over-runs of Traditional projects • In contrast timeliness of completion of PPP projects were not negatively impacted by size and complexity of the project Key Findings
  • 21.
    Finding 5: In contrastto commonly held perceptions, PPP projects were far more transparent by Traditional projects, as measured by the availability of public data for the study Key Findings
  • 22.
    • There isa benefit from completing projects on time and enabling the community to have access to infrastructure facilities sooner. This study has not quantified this benefit. • The benefits identified in this study do not include the effect of PPP’s integrated provision of management, construction and on-going operations. Underestimation of Benefits
  • 23.
    What can bedone about Australia’s Infrastructure Conundrum 23
  • 24.
    • Reality isthat the government got exactly what it asked for – ‘an excellent outcome ?’ • Questions concerning ‘value for money’ persist, not from the viewpoint of government but the public – Urban amenity - always a significant element of CCT – Rich in externalities (third party free riders) – Point to point charging mechanism (is this the optimal revenue model) – If reducing CBD traffic congestion was a goal, then why not reward this as an outcome if it is achieved by the proponent. CCT – Policy Malfunction or not?
  • 25.
    • A fullyelectronic, distance-based toll road; one of the largest road projects in Australia • Completed and opened to traffic ahead of schedule and within budget • Contractual clarity; high degree of commitment on behalf of both parties-public and private; efficient contract management • Significant benefits to the community – good ‘value for money’ • Received wide spread acclaim and hailed as one of the best ever PPP projects in Australia Westlink – M7 Sydney
  • 26.
    • Enhances efficiencyvia: • Connecting market agents • Information broker • Liquidity enables better information discovery • Lowers transaction costs Case Study: Cross City Tunnel
  • 27.
    • A greathole in the ground or something much more? • Public Value equates with: – Better functioning city – Enhanced urban amenity – Less traffic on deck of CBD (travel time, air quality etc) – Greater traffic throughput (if choose tunnel) • Private Value – Time value of money versus toll (customers) – Greater choice ? – Traffic volumes (NPV of future revenue streams) Case Study: Cross City Tunnel
  • 28.
    • Forecasting costs& revenue over long term is difficult • NSW Govt led procurement • Primary objective: reduce through traffic for CBD • Resulting in: less congestion, improved amenity, better flows • 2.1Km long tunnel Sydney, Australia • Public-private partnership: design, build, finance, operate • Charge users a toll • Opened for traffic August 2005 • Never reached the levels forecast • December 2006, company insolvent, debts +$500 million Case Study: Cross City Tunnel
  • 29.
    • Lessons learned •Develop realistic & accurate forecasts • Assessment of project bids should include identification of key assumptions • Need to develop better and more flexible pricing models for PPPs • Need for greater transparency in PPP contracts • Need for governments to pursue PPP projects that are profitable plus protect and improve the public interest Case Study: Cross City Tunnel
  • 30.
    • How doyou expand the port when the Govt. budget tight? • Sell the asset on a 99 year lease • couple the sale with an obligation to fund and build a new major road to the port • $2.1 billion to Government • plus the consortium will pay $200 million for the roadway upgrade • taxpayer also avoids future port infrastructure expansion costs of up to $1 billion. How do you expand the port when Govt. budget is tight? Case Study: Brisbane Airport
  • 31.
    Case Study: BrisbaneAirport • How do you expand the port when the Govt. budget tight? • Sell the asset on a 99 year lease • Couple the sale with an obligation to fund and build a new major road to the port • $2.1 billion to Government • Consortium will pay $200 million for roadway upgrade • Taxpayer avoids future port infrastructure expansion costs of up to $1 billion.
  • 32.
     The NSWAuditor General’s Office and NSW Treasury have also provided guidance, most recently in the reviews of the PPP for new government schools in western Sydney. Their reports endorsed the State’s decision to use private finance, finding that: o the nine schools were delivered two years earlier than if traditional public sector procurement was used; o innovation was advanced, like child care centres and on-site maintenance managers; and o the savings using PPP delivery were retained by the Education Department, with $7m of capital savings used for other school projects. New South Wales’ Experience
  • 33.
    • Onus ison private sector to demonstrate it can build and operate infrastructure (toll roads) better. – Faster delivery – Innovative design and ongoing management – Better service, smarter ways of doing it – It is not just about saving the government money – third order issue • Willingness to learn & improve – Admit mistakes – Prepared to acknowledge and front the community and share the political risk both upside and downside – Profit is a great motivator, but also innovation must be demonstrable and result in better service delivery – Celebrate and communicate the successes Even higher hurdle for proponents
  • 35.
    Garry Bowditch CEO SMART InfrastructureFacility +61 414 977 683 garrybow@uow.edu.au

Editor's Notes

  • #10 All Governments have a plethora of older assets across their property, maritime, transport and energy portfolios with good cash flows and valued at a fraction of their true market value.   These existing infrastructure assets are typically old, in need of expensive maintenance and in some circumstances require complete replacement. Their future potential requires strong and experienced management and further investment, neither of which is always available to Government.   A solution to this predicament is to mix the established cash flows of old assets, with an obligation to replenish and build new infrastructure. This would positively change the attractiveness of infrastructure investment. Government can leverage the situation and bring on new rail, road, health, education and energy projects, in a shorter period of time.   It can be done and is being done in Australia, United States and India. It relies on arranging sales that bind and oblige the buyer to develop new assets and renovate existing infrastructure.
  • #11 Four key elements define the type of infrastructure investment opportunity: 1. the type of project or enterprise economic/social 2. the contractual approach privatization/license/concession/partnership 3. the phase of asset development existing &established/new & tested/ new & innovative 4. the stage of development of the market Undeveloped/developing/developed   Source: World Economic Forum, Maximizing the Value of Private Finance in Infrastructure, 2010
  • #27 Raising funds for public and urban infrastructure has become riskier and more complex following a range of problems over the last 10 years. Poorly executed projects, such as the Cross City tunnel and the increasing costs and terms of commercial debt due to the global financial crisis present major challenges for Government.   The Cross City tunnel itself is a good and valuable piece of infrastructure. Everyone agrees that taking cars away from the CBD is worthy and essential, and the east west trip has become shorter and more convenient. But the Government seemed to lose sight of why the project was important, leading to inflated forecasts of use and financial returns, rather than serving the public interest and focusing on improving conditions for end users – the car and truck drivers.   Results like this have attracted bad media for public-private projects, its left a bitter taste in the mouth of the public and made it all the more difficult to attract finance for projects. The Cross City Tunnel is a 2.1-kilometer-long tunnel located in Sydney, Australia. It links the western fringe of the central business district (CBD) to the eastern suburbs.The project was a public-private partnership intended to design, build, finance, and operate the tunnel that would charge users a toll.The concession was awarded to Cross City Motorway Ltd, composed of Cheung Kong Infrastructure Holdings, DB Capital Partners, and Bilfinger Berger. It reached financial close on December 18, 2002, and opened for traffic in August 2005. However, traffic through the tunnel never reached the levels forecast and after December 2006, after little more than a year, the company was insolvent, with debts of over $A 500 million. In June 2007, Leighton Contractors and ABN AMRO acquired Cross City Tunnel group for $A 700 million.
  • #29 Raising funds for public and urban infrastructure has become riskier and more complex. Forecasting costs and revenue over the long term is difficult, but vital for the success of the project. Many businesses struggle to forecast revenue and costs over the short term, yet, for many infrastructure transactions, there is a need to forecast these over the long term, sometimes for more than 50 years. How is this possible and what are the consequences of getting it wrong?  Case study example: The Cross City Tunnel is a 2.1-kilometer-long tunnel located in Sydney, Australia. It links the western fringe of the CBD to the eastern suburbs. The project was a public-private partnership intended to design, build, finance, and operate the tunnel that would charge users a toll. The concession was awarded to Cross City Motorway Ltd, composed of Cheung Kong Infrastructure Holdings, DB Capital Partners, and Bilfinger Berger. It reached financial close on December 18, 2002, and opened for traffic in August 2005. However, traffic through the tunnel never reached the levels forecast and after December 2006, after little more than a year, the company was insolvent, with debts of over $A 500 million. In June 2007, Leighton Contractors and ABN AMRO acquired Cross City Tunnel group for $A 700 million. Key contractual issues: 1. During the bidding phase, the public sector selected an alternative and more expensive tunnel route proposed by the Cross City Motorway consortium. As there was no additional public funding available, these additional costs were planned to be recovered through higher tolls. 2. The government committed to close a number of surface roads, thereby “encouraging” people to use the tunnel.
  • #30 LESSONS LEARNED • There is a need to develop more realistic and accurate traffic forecasts, and, in turn, more realistic financial forecasts. The project encountered serious trouble when the tunnel failed to attract the traffic required to meet interest payments. Even when use was free, patronage was still below the very optimistic forecasts of 90,000 vehicles a day. The low traffic volume was exacerbated by the high cost of the toll—$A 3.56; all these factors resulted in a negative reaction by users. • Assessment of project bids should include identification of key assumptions upon which success depends. Such critical assumptions should be subject to independent evaluation. • There is a need to develop better and more flexible pricing models for PPPs. For example, the economic benefit of using a toll road during peak hours is very different from the benefit of using it late at night. Despite the difference in benefit, the driver still pays the same price. By closing down travel alternatives, government removed incentives for the operators to use pricing to attract business. • There is a need for greater transparency in PPP contracts. Both the private sector and government need to be more open about questions regarding risk and pricing. In a similar vein, there is a need to make the details of the project open to public scrutiny before the project is completed. This did not happen in the Cross City Tunnel project, and the use of a public auditor would have been advantageous. • There is also a need for governments to pursue PPP projects that are not only profitable, but that also serve to protect (and improve) the public interest.
  • #31 Good example of this approach is the recent sale of the Brisbane Port Corporation to a consortium, Q Port Holdings. The issue of access to and from ports to facilitate our booming exports is a national and State priority and the Queensland Government was stretched to deliver the funding.   The smart response was to then sell the asset on a 99 year lease and couple the sale with an obligation to fund and build a new major road to the port. The sale delivered $2.1 billion to Government plus the consortium will pay $200 million for the roadway upgrade. The Queensland taxpayer also avoids future port infrastructure expansion costs of up to $1 billion.   Importantly the consortium has more credentials to owning and running ports than the State Government, with interests in port terminals across eight countries.   The superannuation funds, which formed a large part of the winning consortium for the Brisbane Port, can see sensible and competitive returns without high-risk exposure to a greenfield development project.   This strategic approach creates a win-win for the community, the government and the investor. The government realizes the true market value for an asset, and liberates the balance sheet for alternative infrastructure development. Importantly the community gets the infrastructure and services they desire.
  • #32 Good example of this approach is the recent sale of the Brisbane Port Corporation to a consortium, Q Port Holdings. The issue of access to and from ports to facilitate our booming exports is a national and State priority and the Queensland Government was stretched to deliver the funding.   The smart response was to then sell the asset on a 99 year lease and couple the sale with an obligation to fund and build a new major road to the port. The sale delivered $2.1 billion to Government plus the consortium will pay $200 million for the roadway upgrade. The Queensland taxpayer also avoids future port infrastructure expansion costs of up to $1 billion.   Importantly the consortium has more credentials to owning and running ports than the State Government, with interests in port terminals across eight countries.   The superannuation funds, which formed a large part of the winning consortium for the Brisbane Port, can see sensible and competitive returns without high-risk exposure to a greenfield development project.   This strategic approach creates a win-win for the community, the government and the investor. The government realizes the true market value for an asset, and liberates the balance sheet for alternative infrastructure development. Importantly the community gets the infrastructure and services they desire.
  • #35 The great French Marshall Hubert Lyautey once asked his gardener to plant a tree. The gardener objected that the tree was slow growing and would not reach maturity for 100 years. The Marshall replied, “In that case, there is no time to lose; plant it this afternoon.”
  • #38  In 1932, the annual average daily traffic volume (in both directions) was about 10,900. In 1943, with a wartime shortage of vehicles and petrol rationing, there was a drop in traffic to about 8,600 vehicles a day. : 159,597 vehicles/day (NB: Harbour Tunnel opened 31st August 1992)