Download as PDF, PPTX

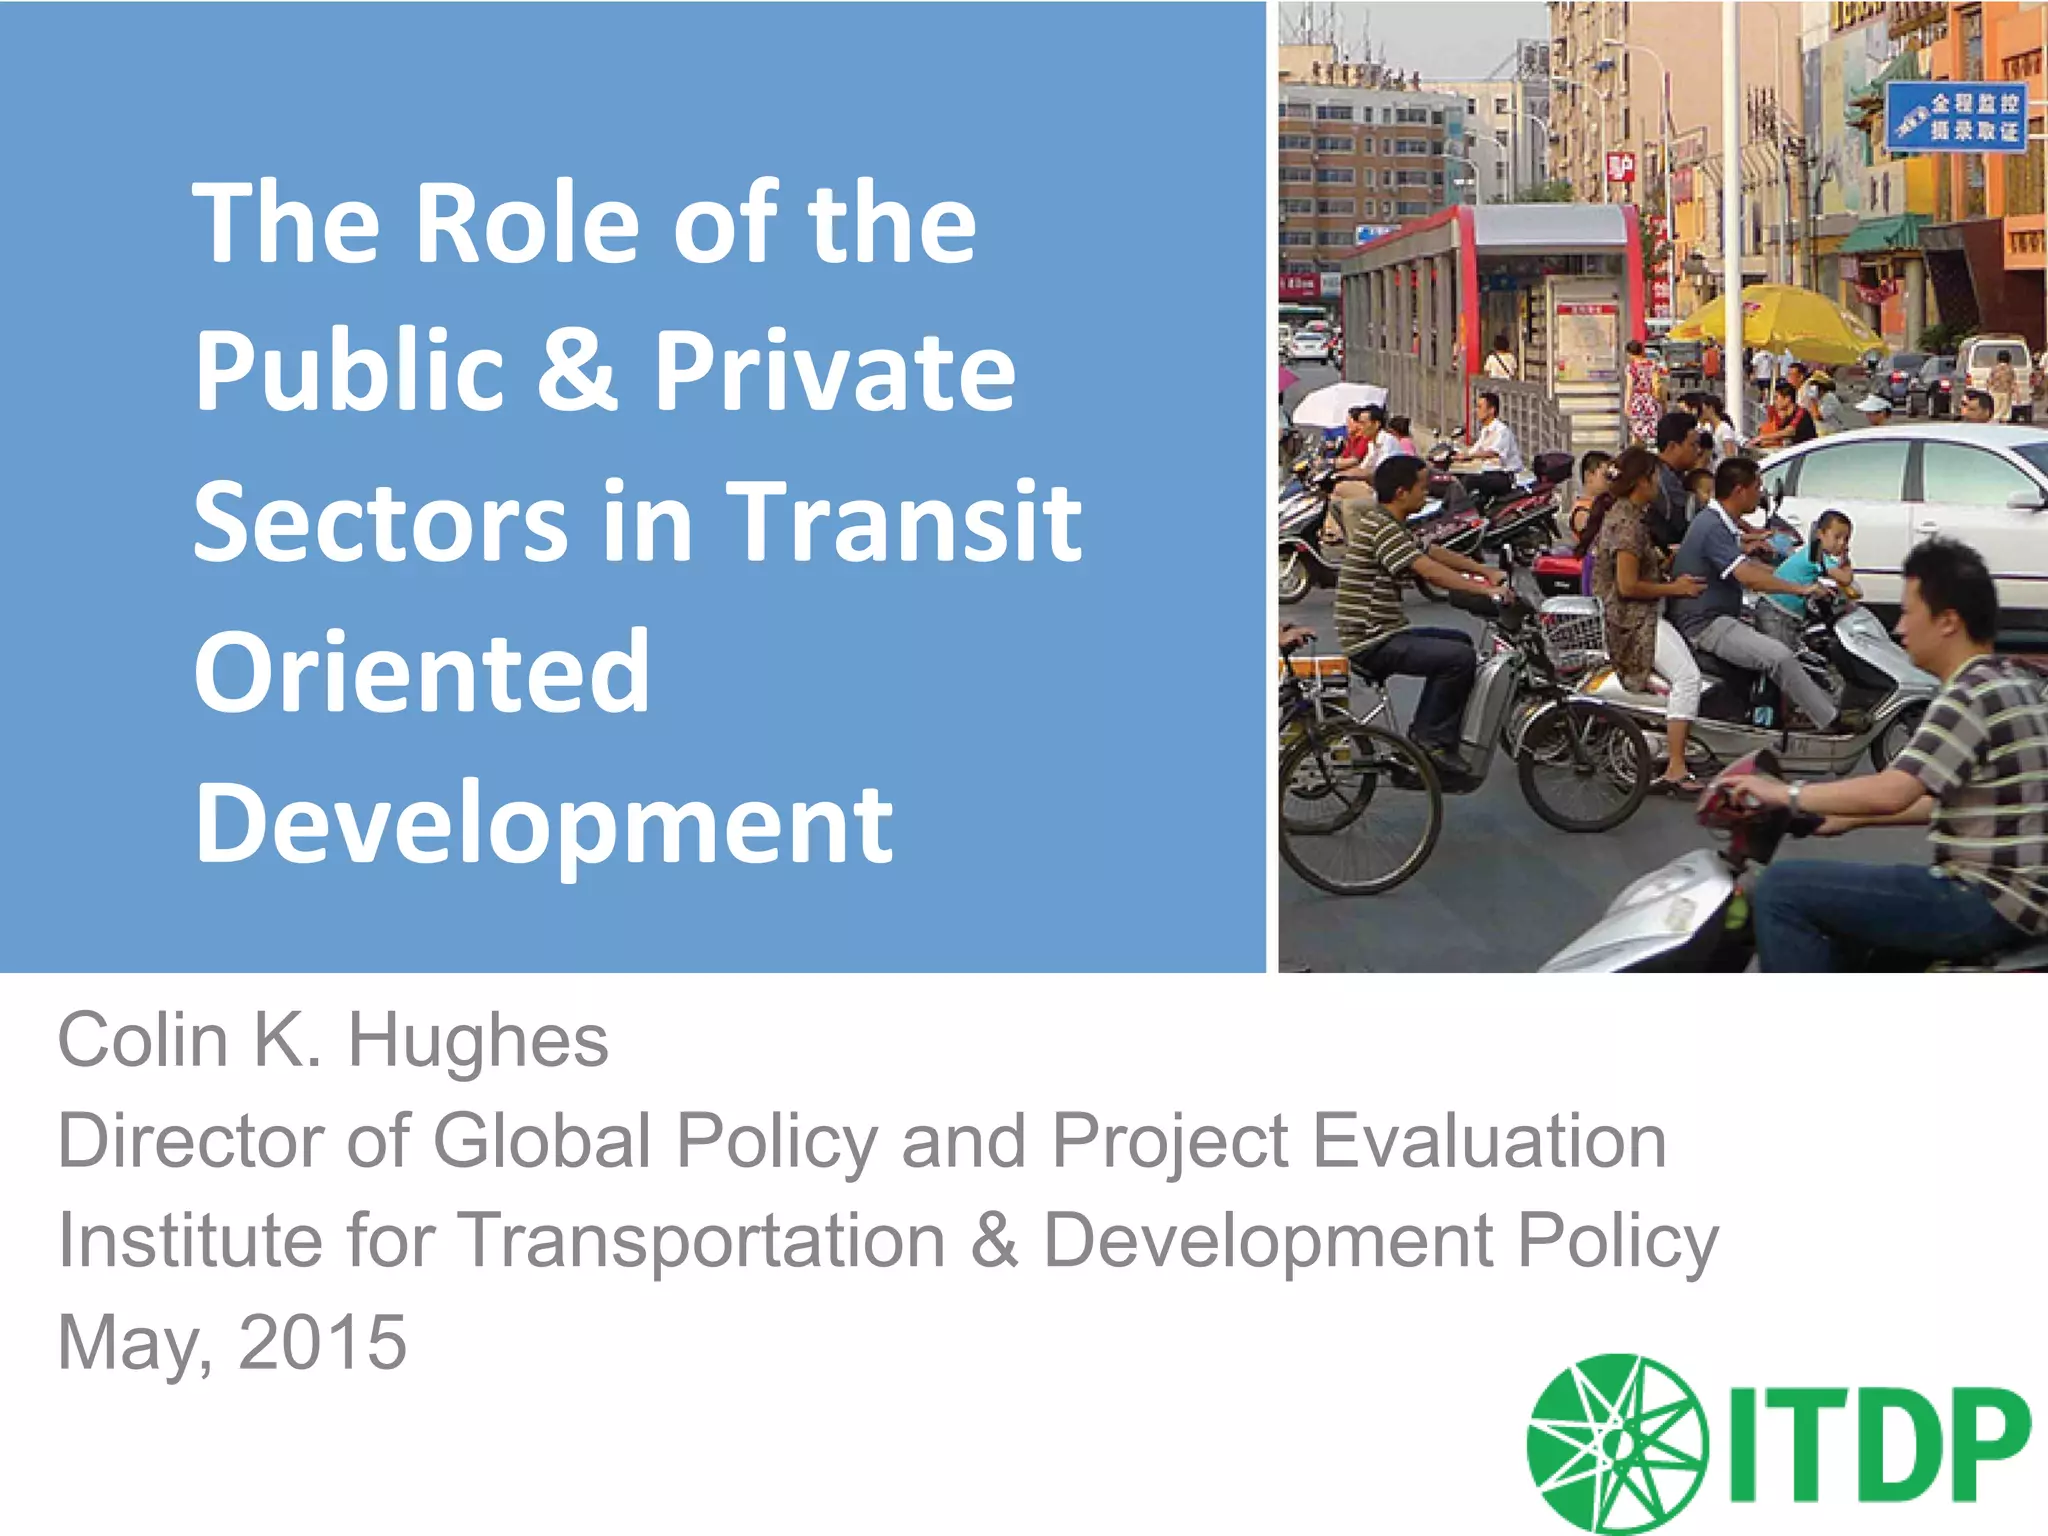
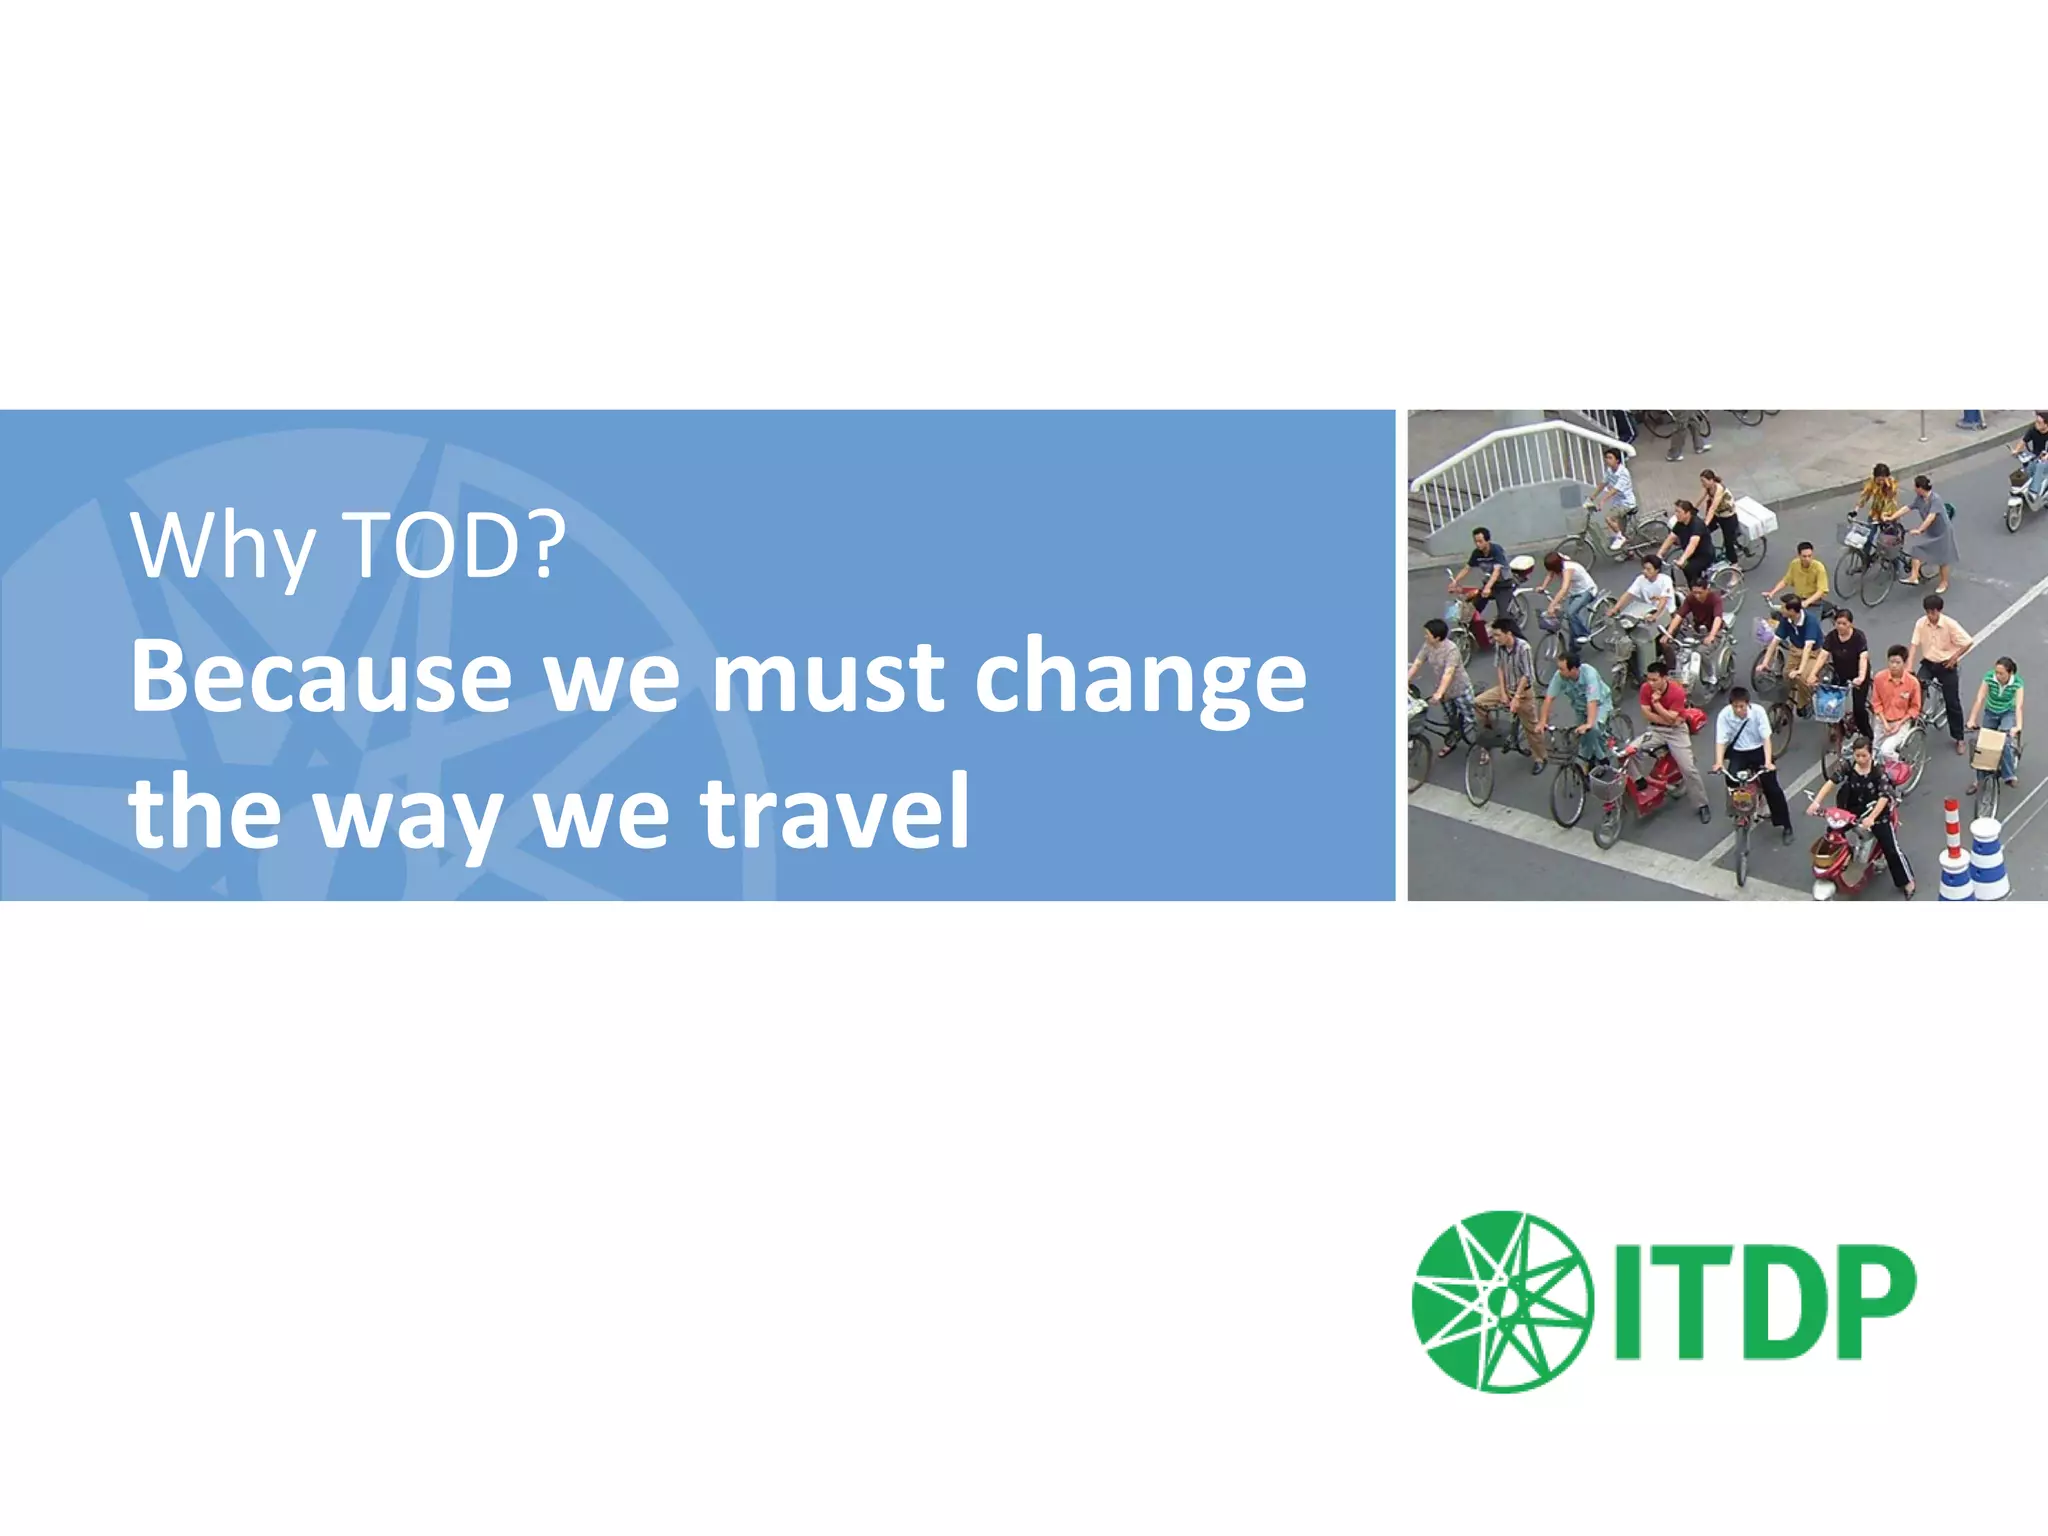
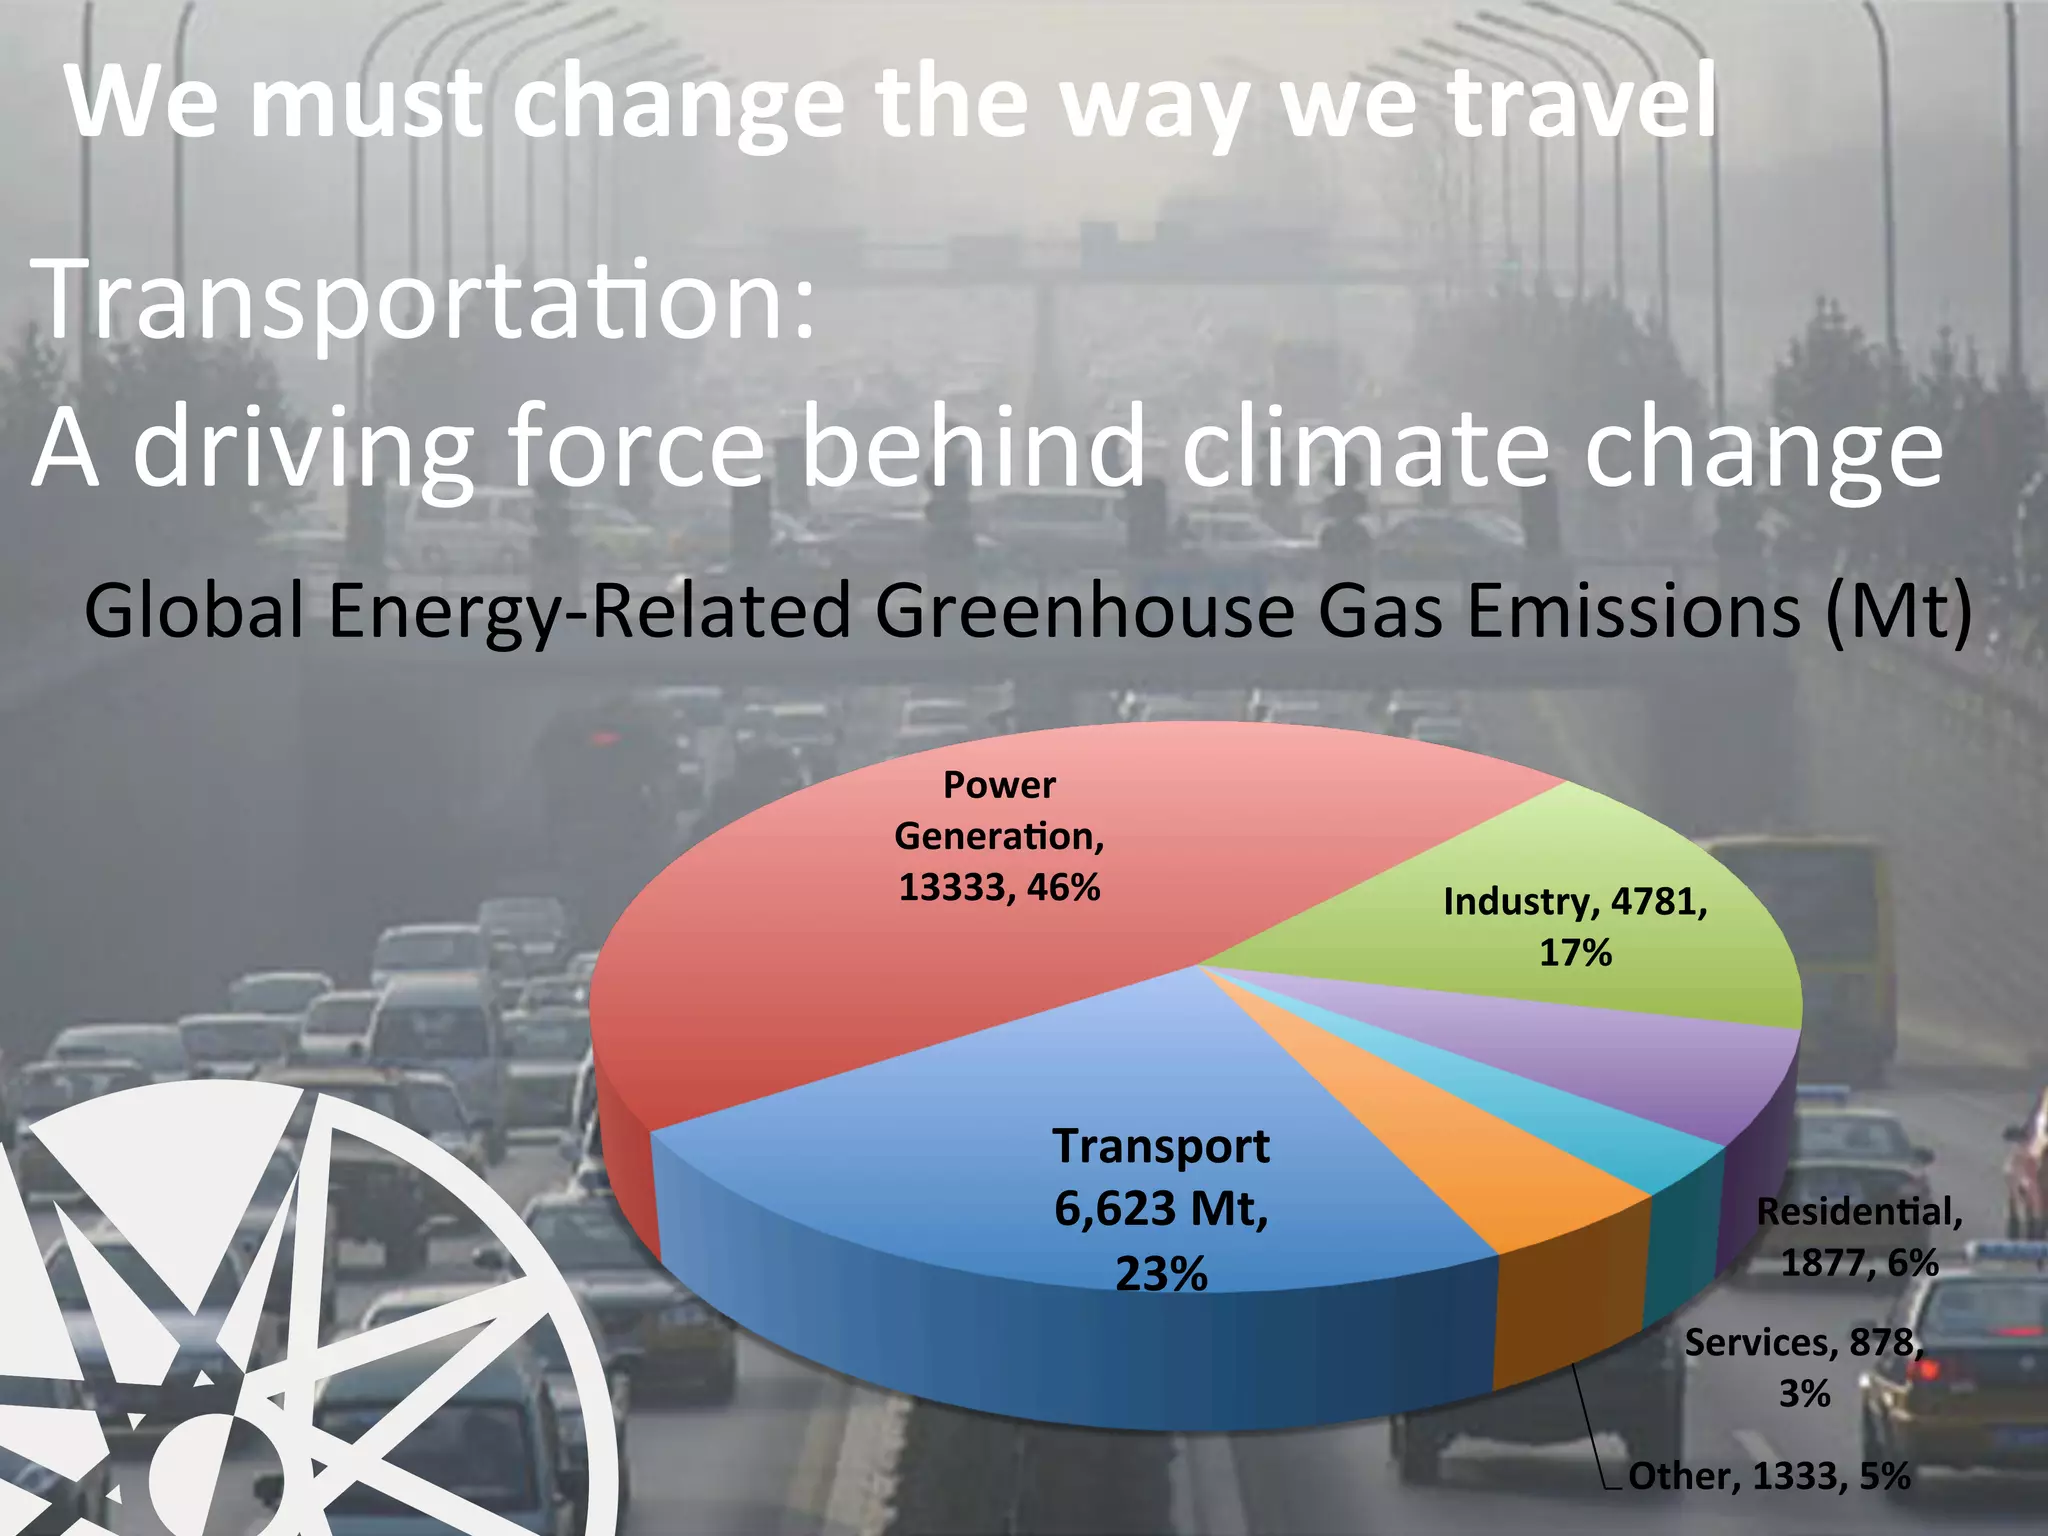
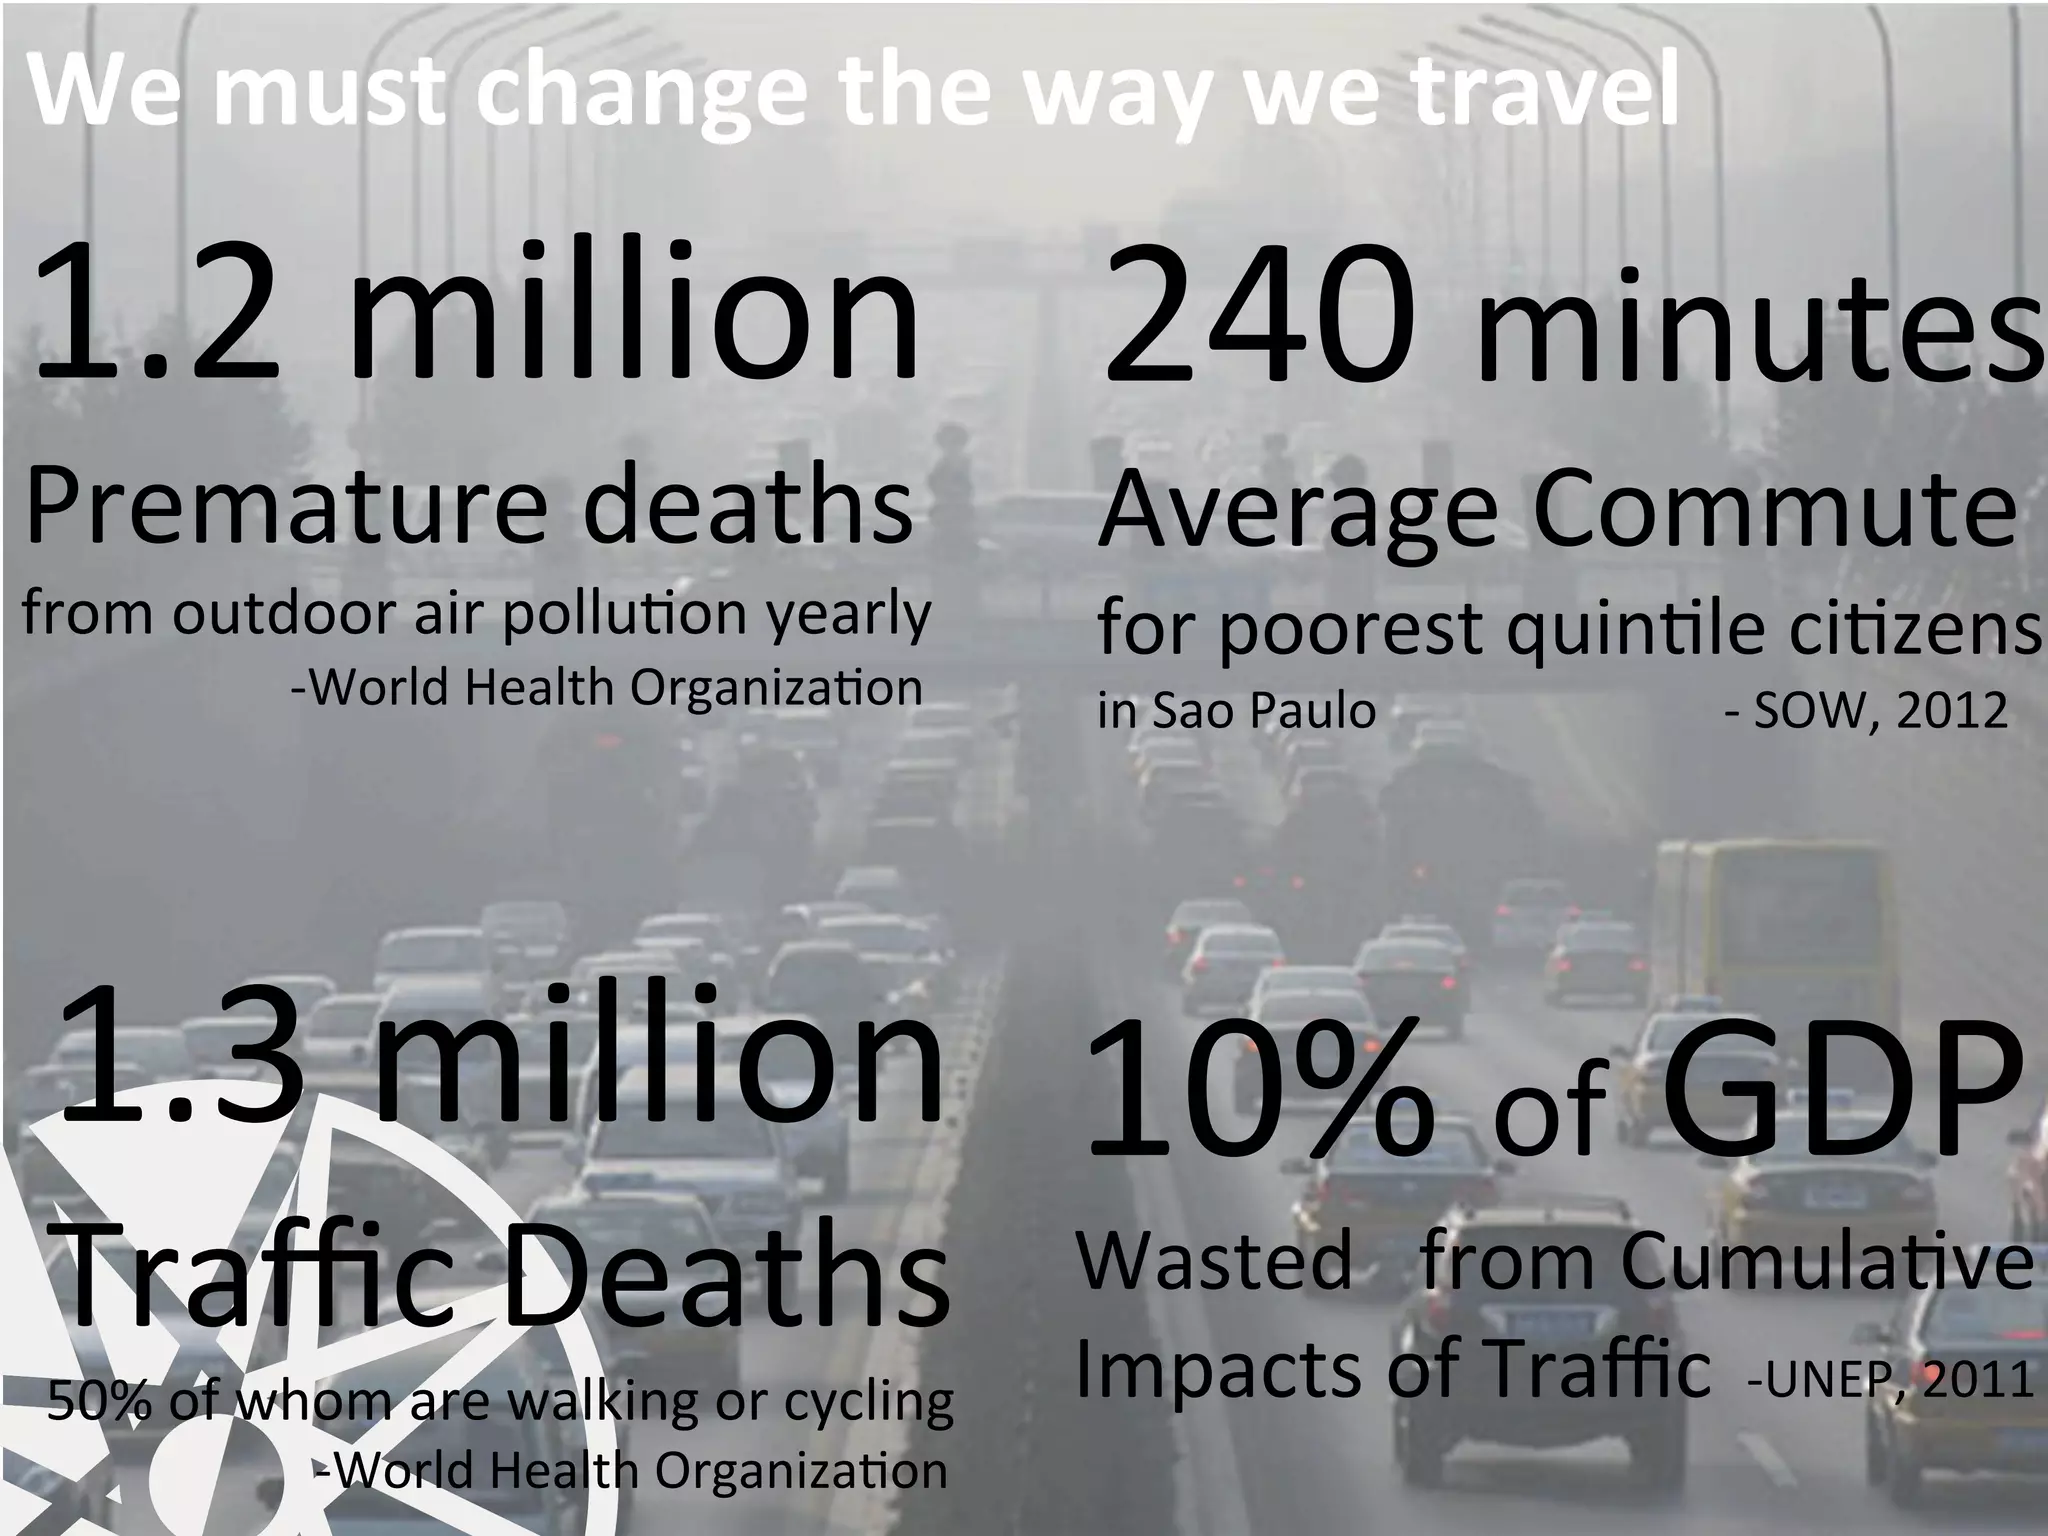
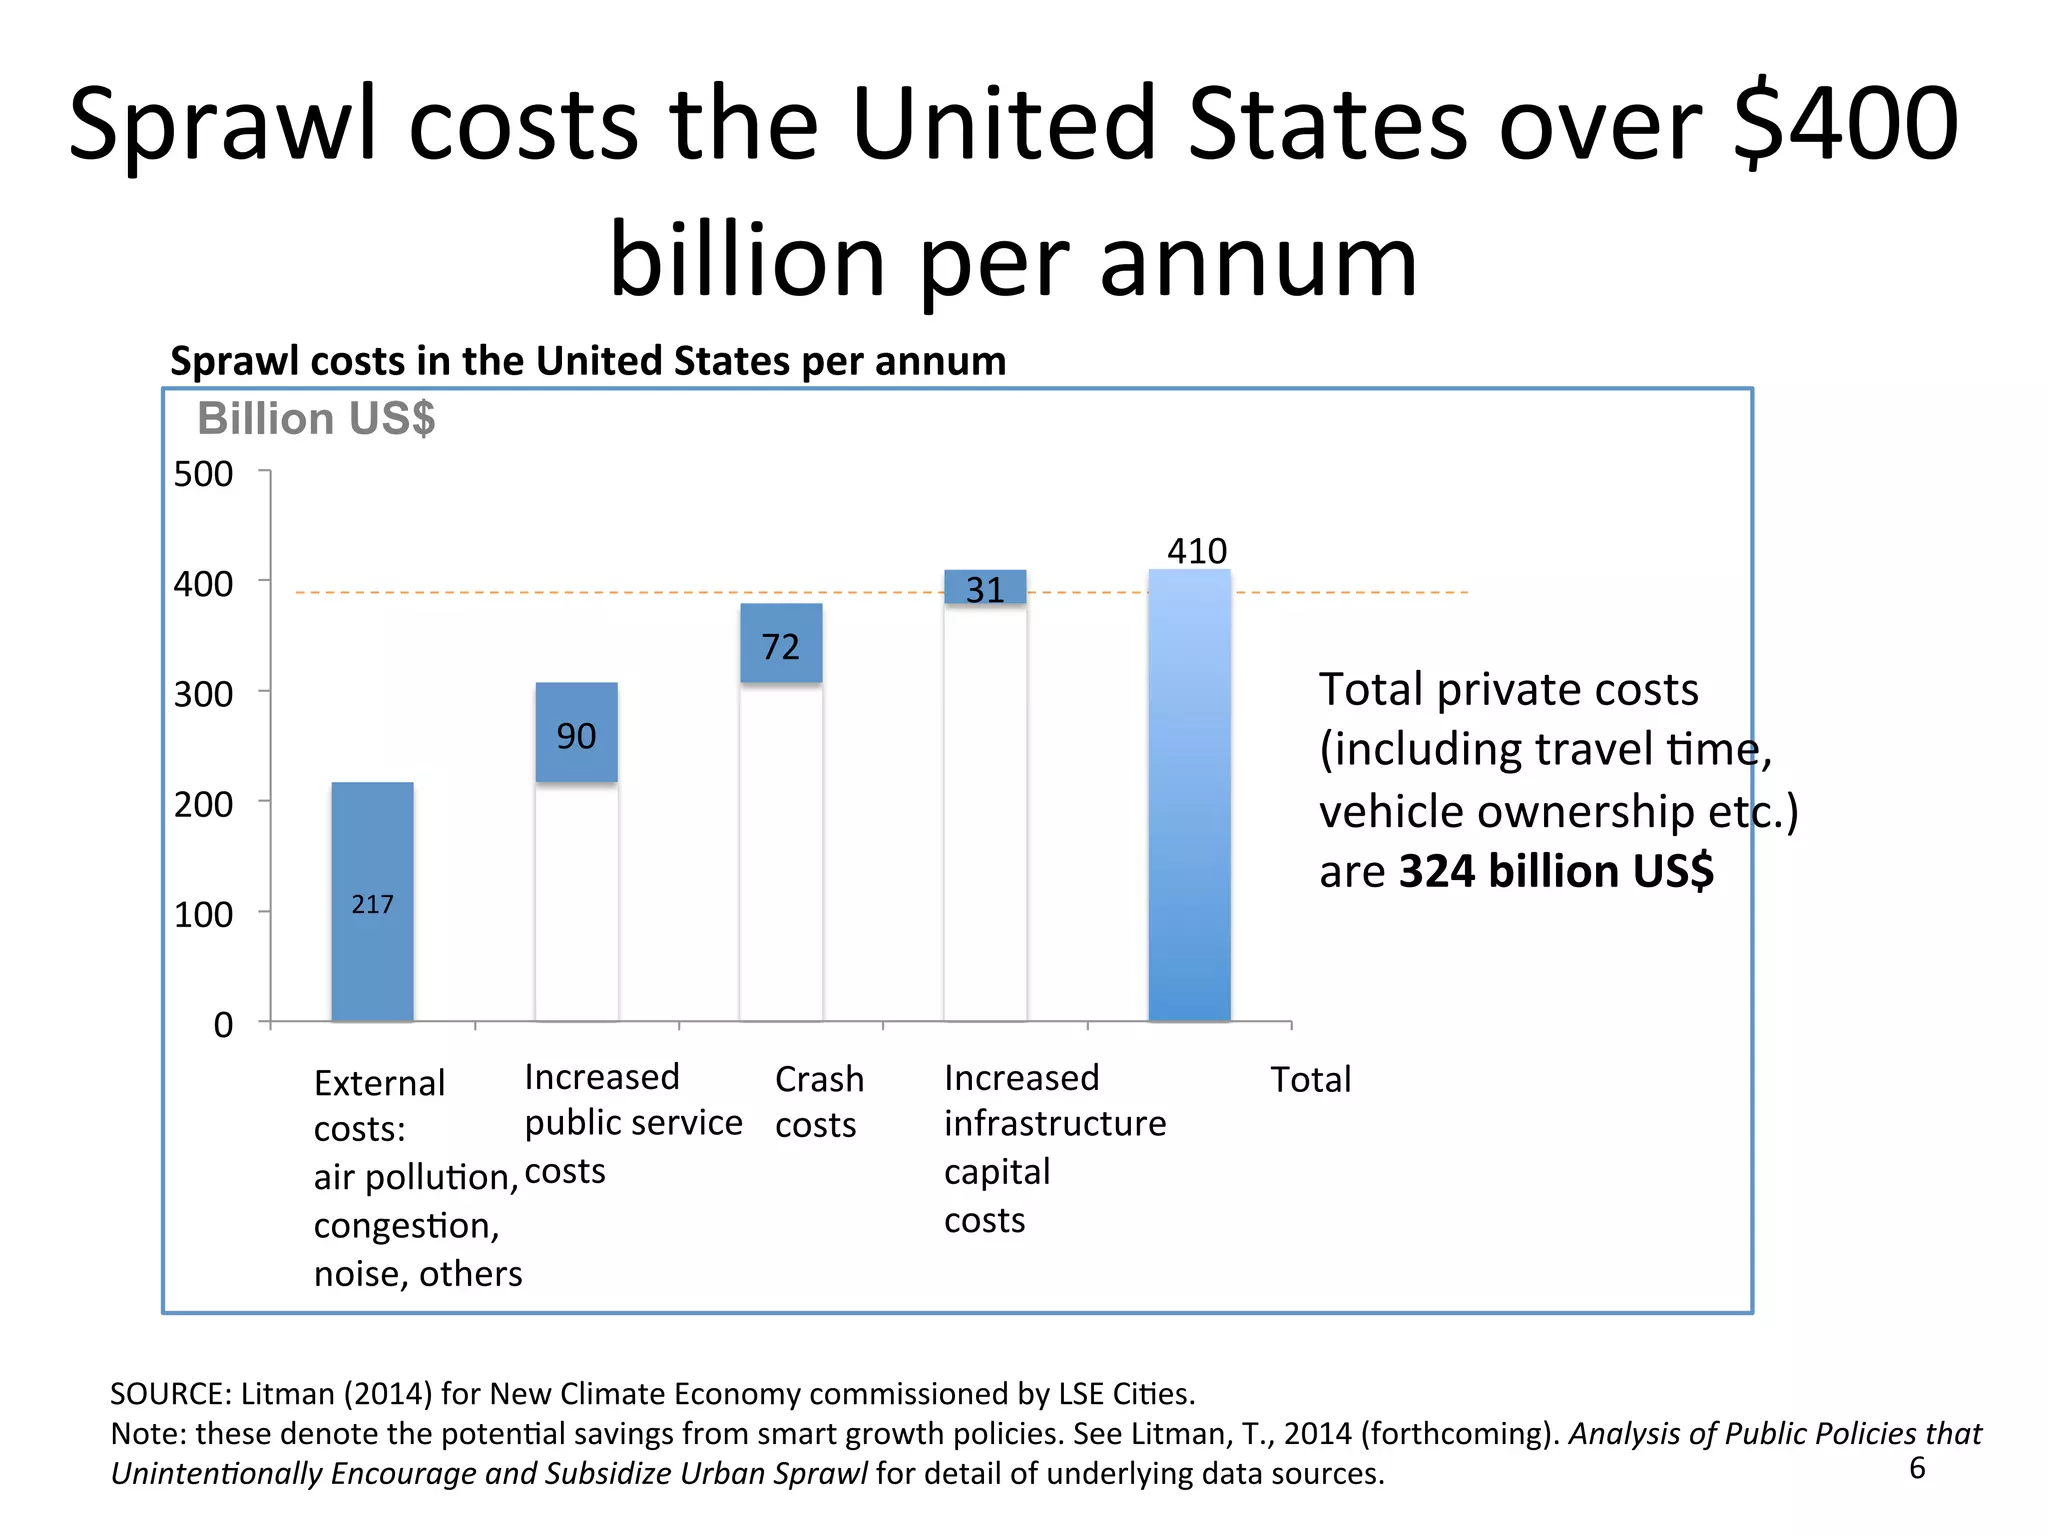
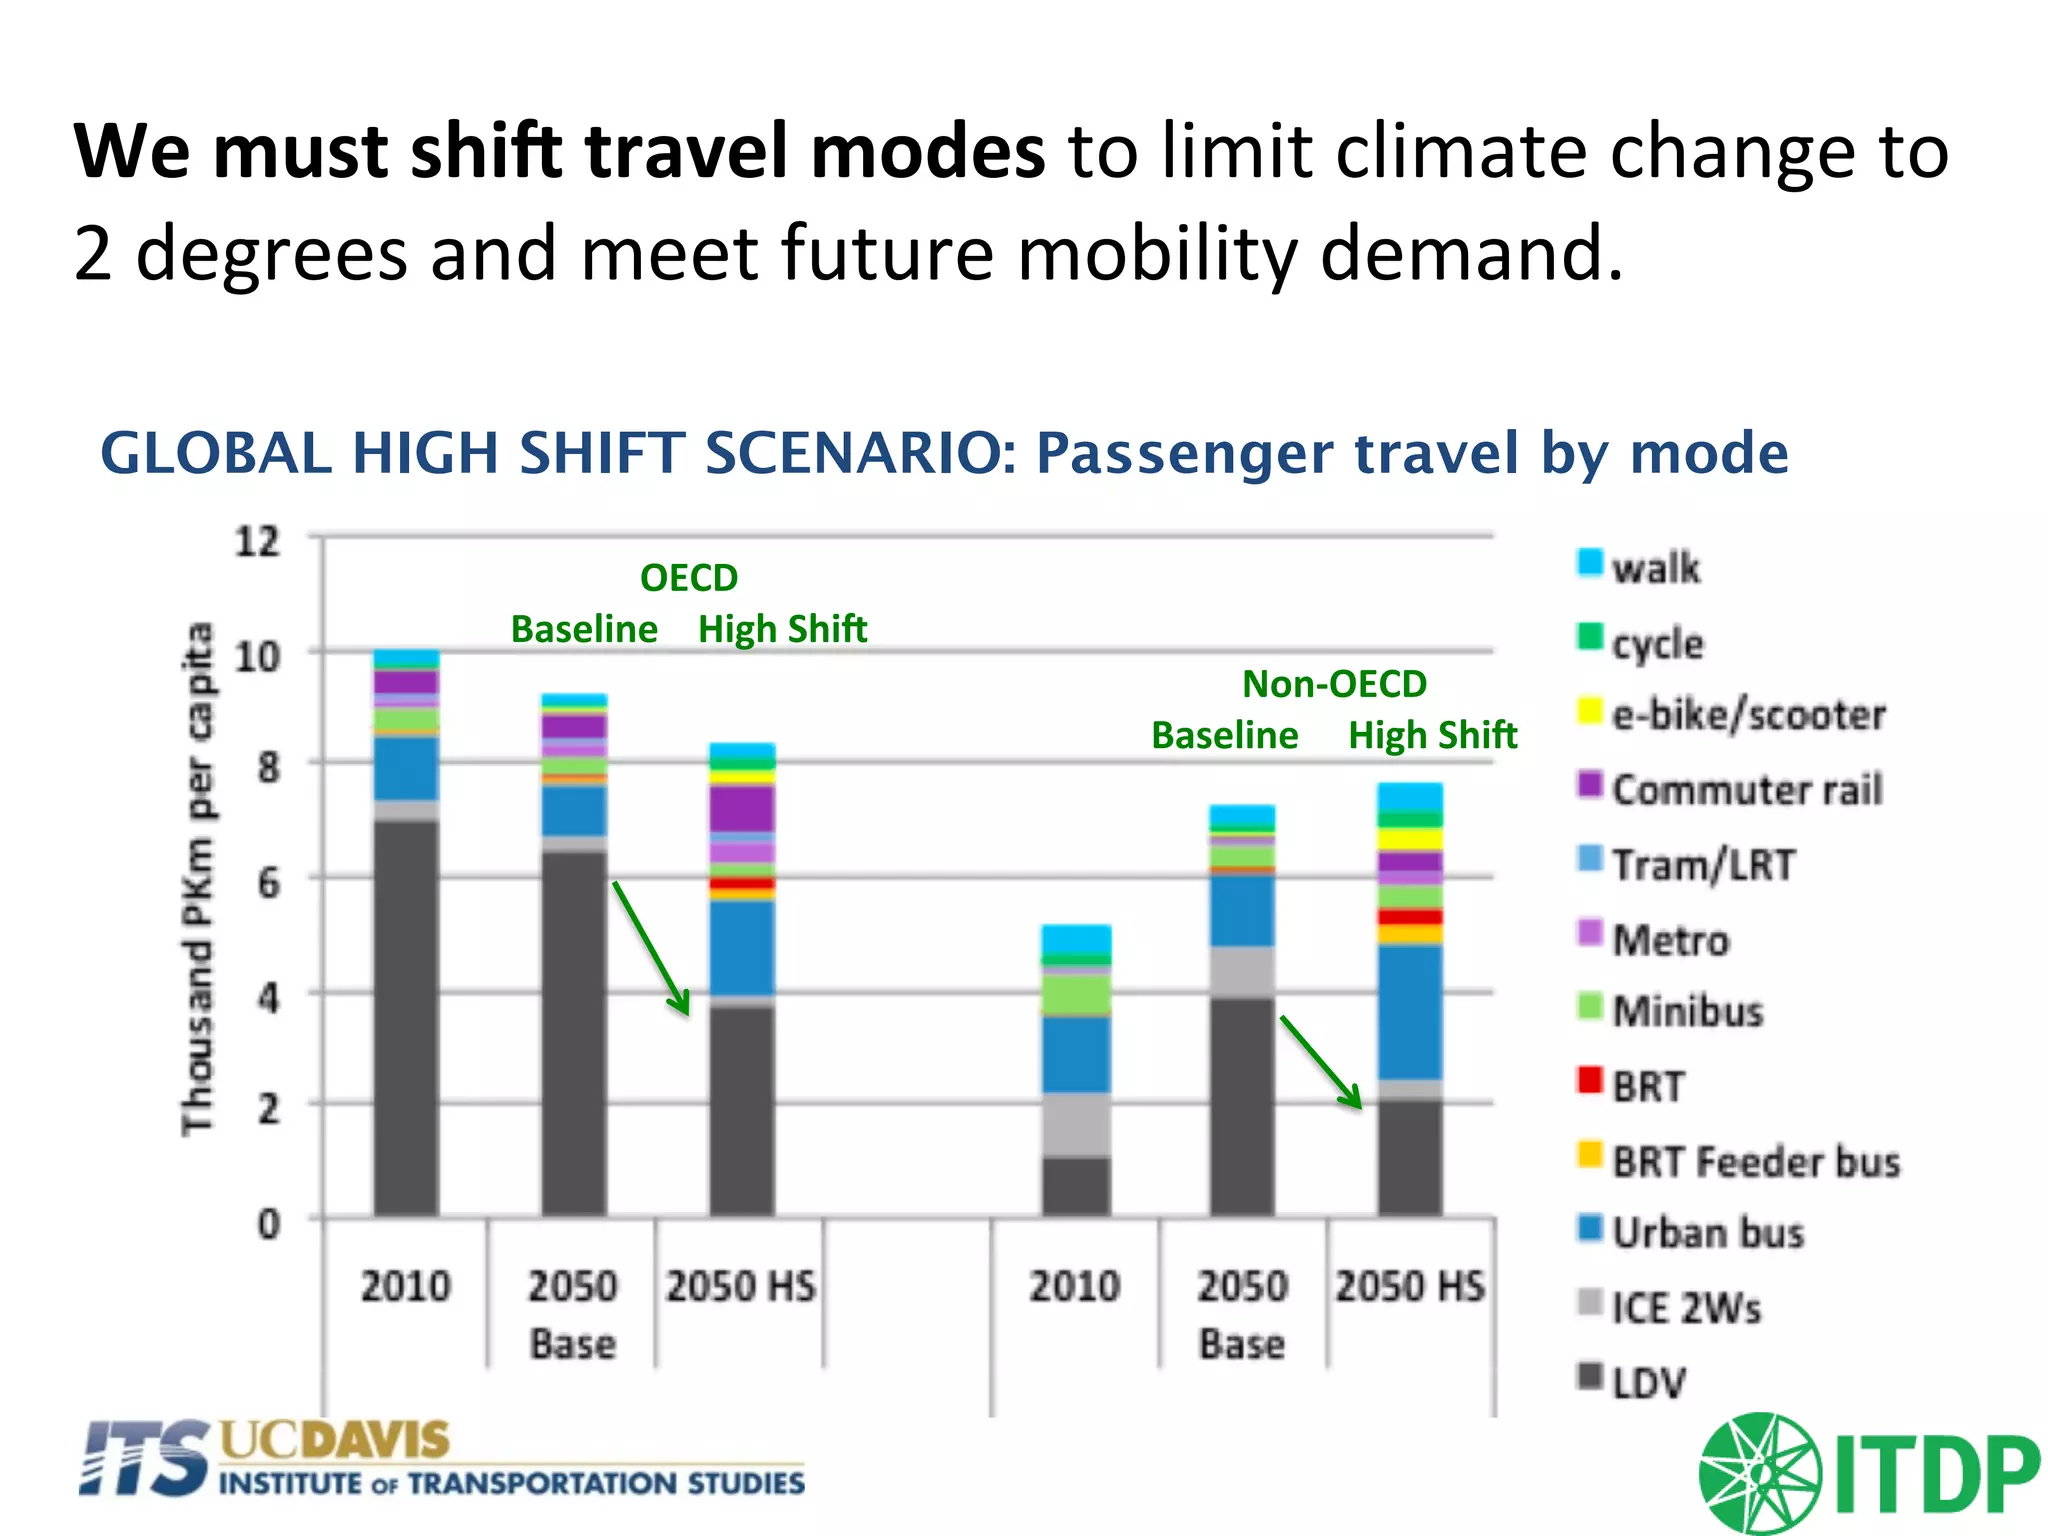
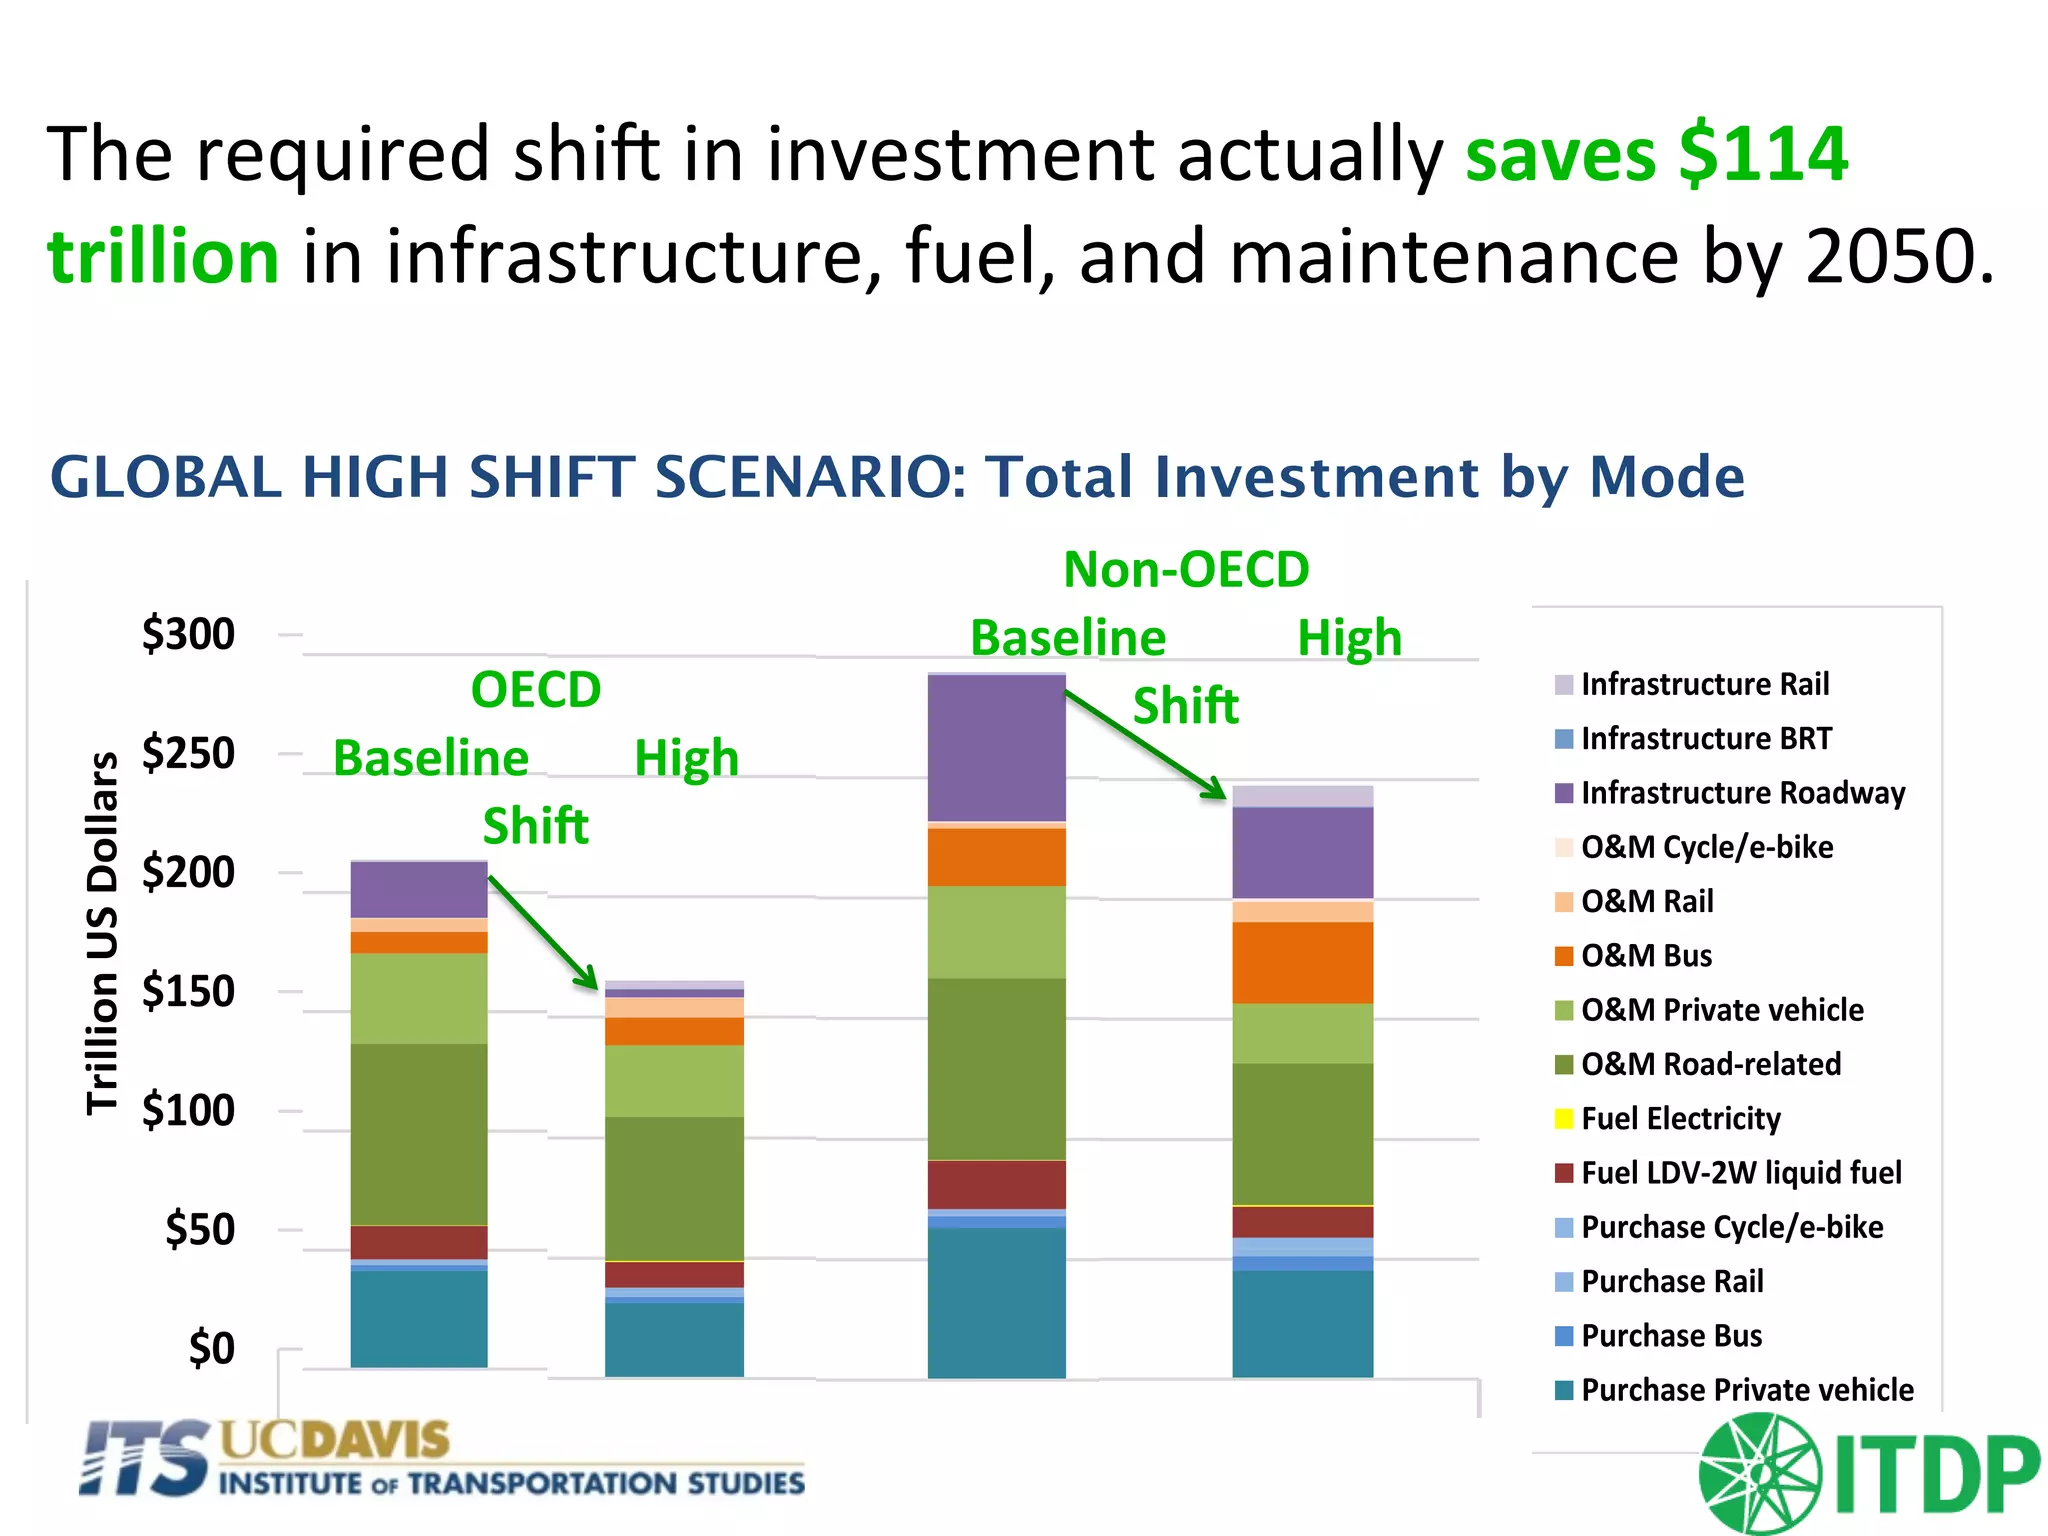
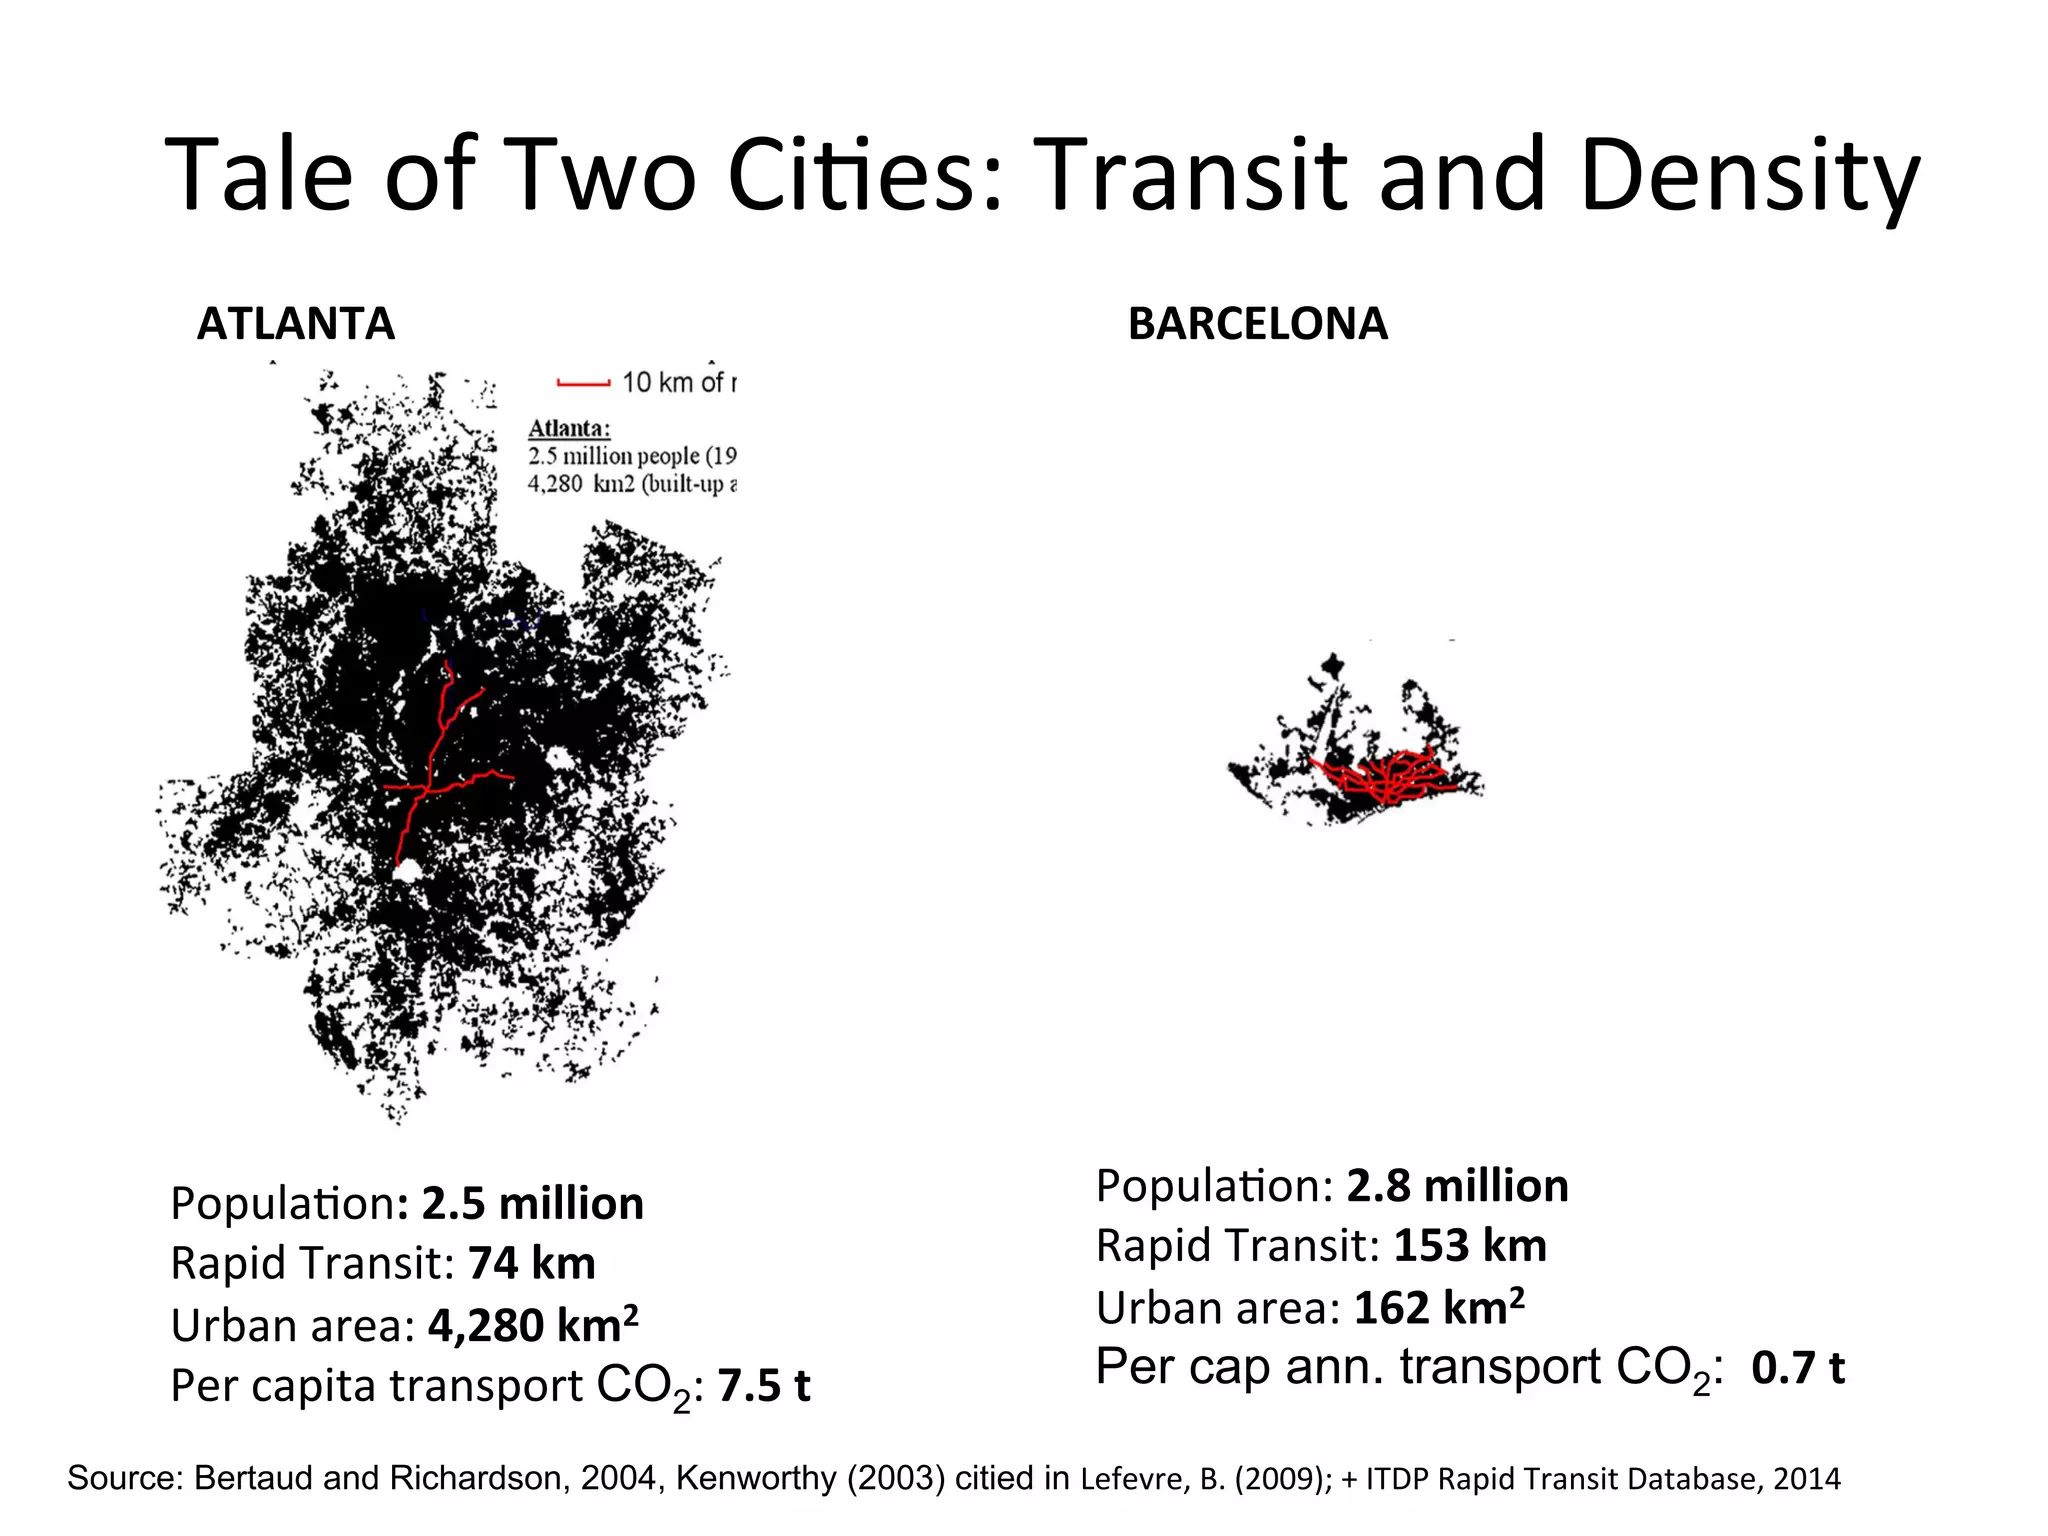
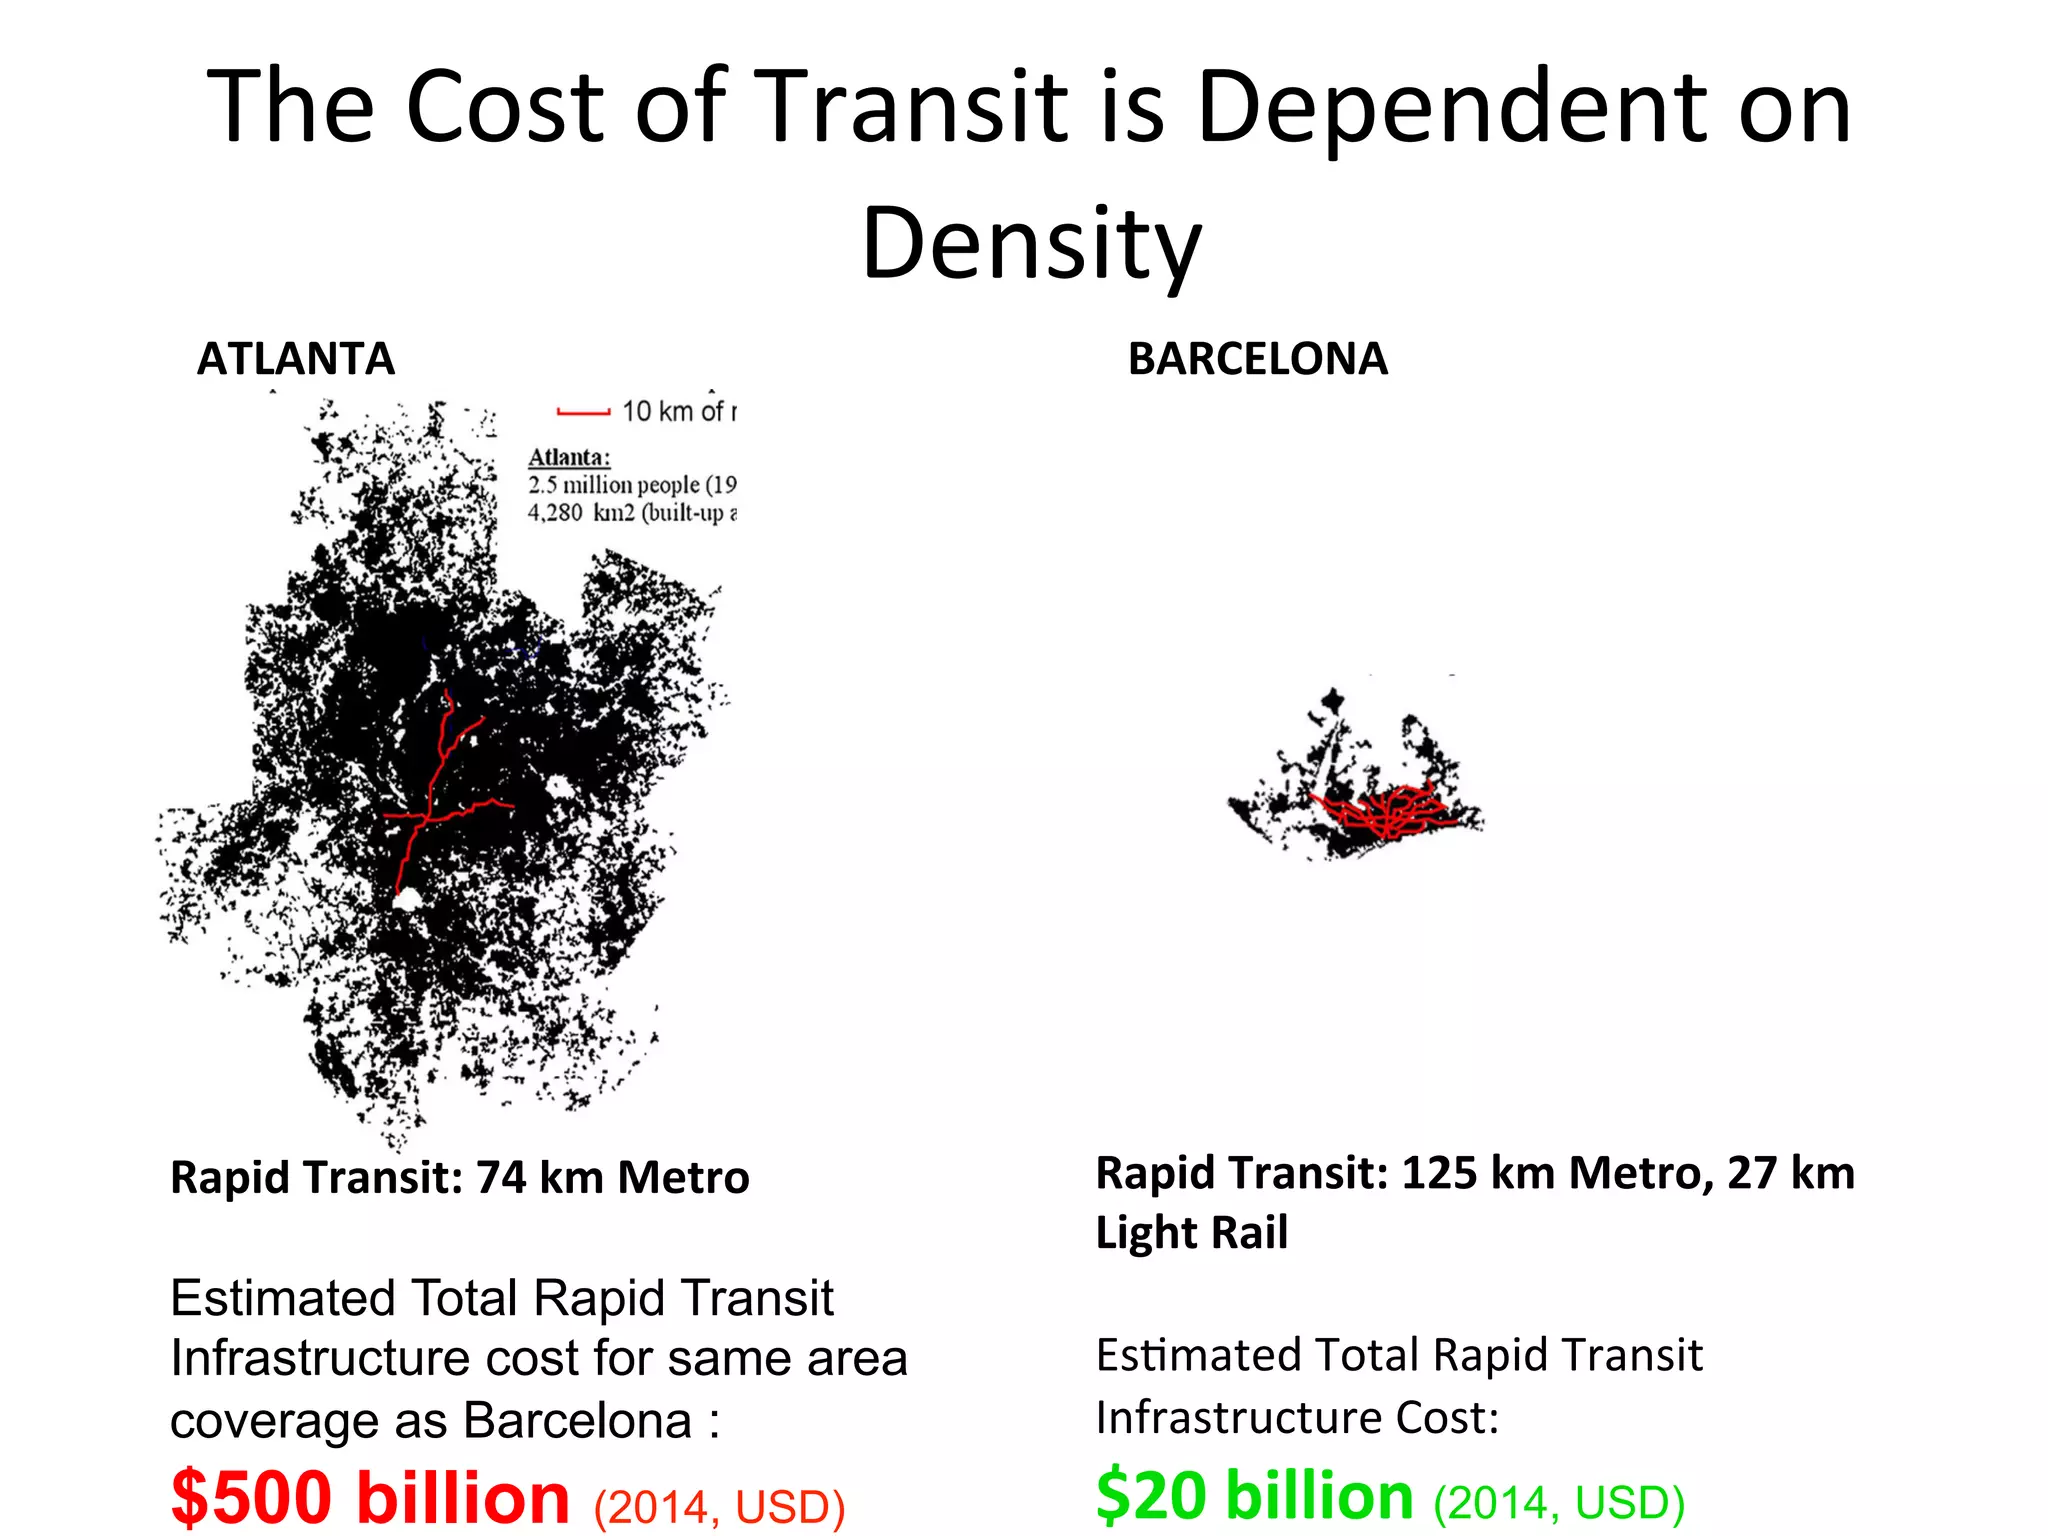
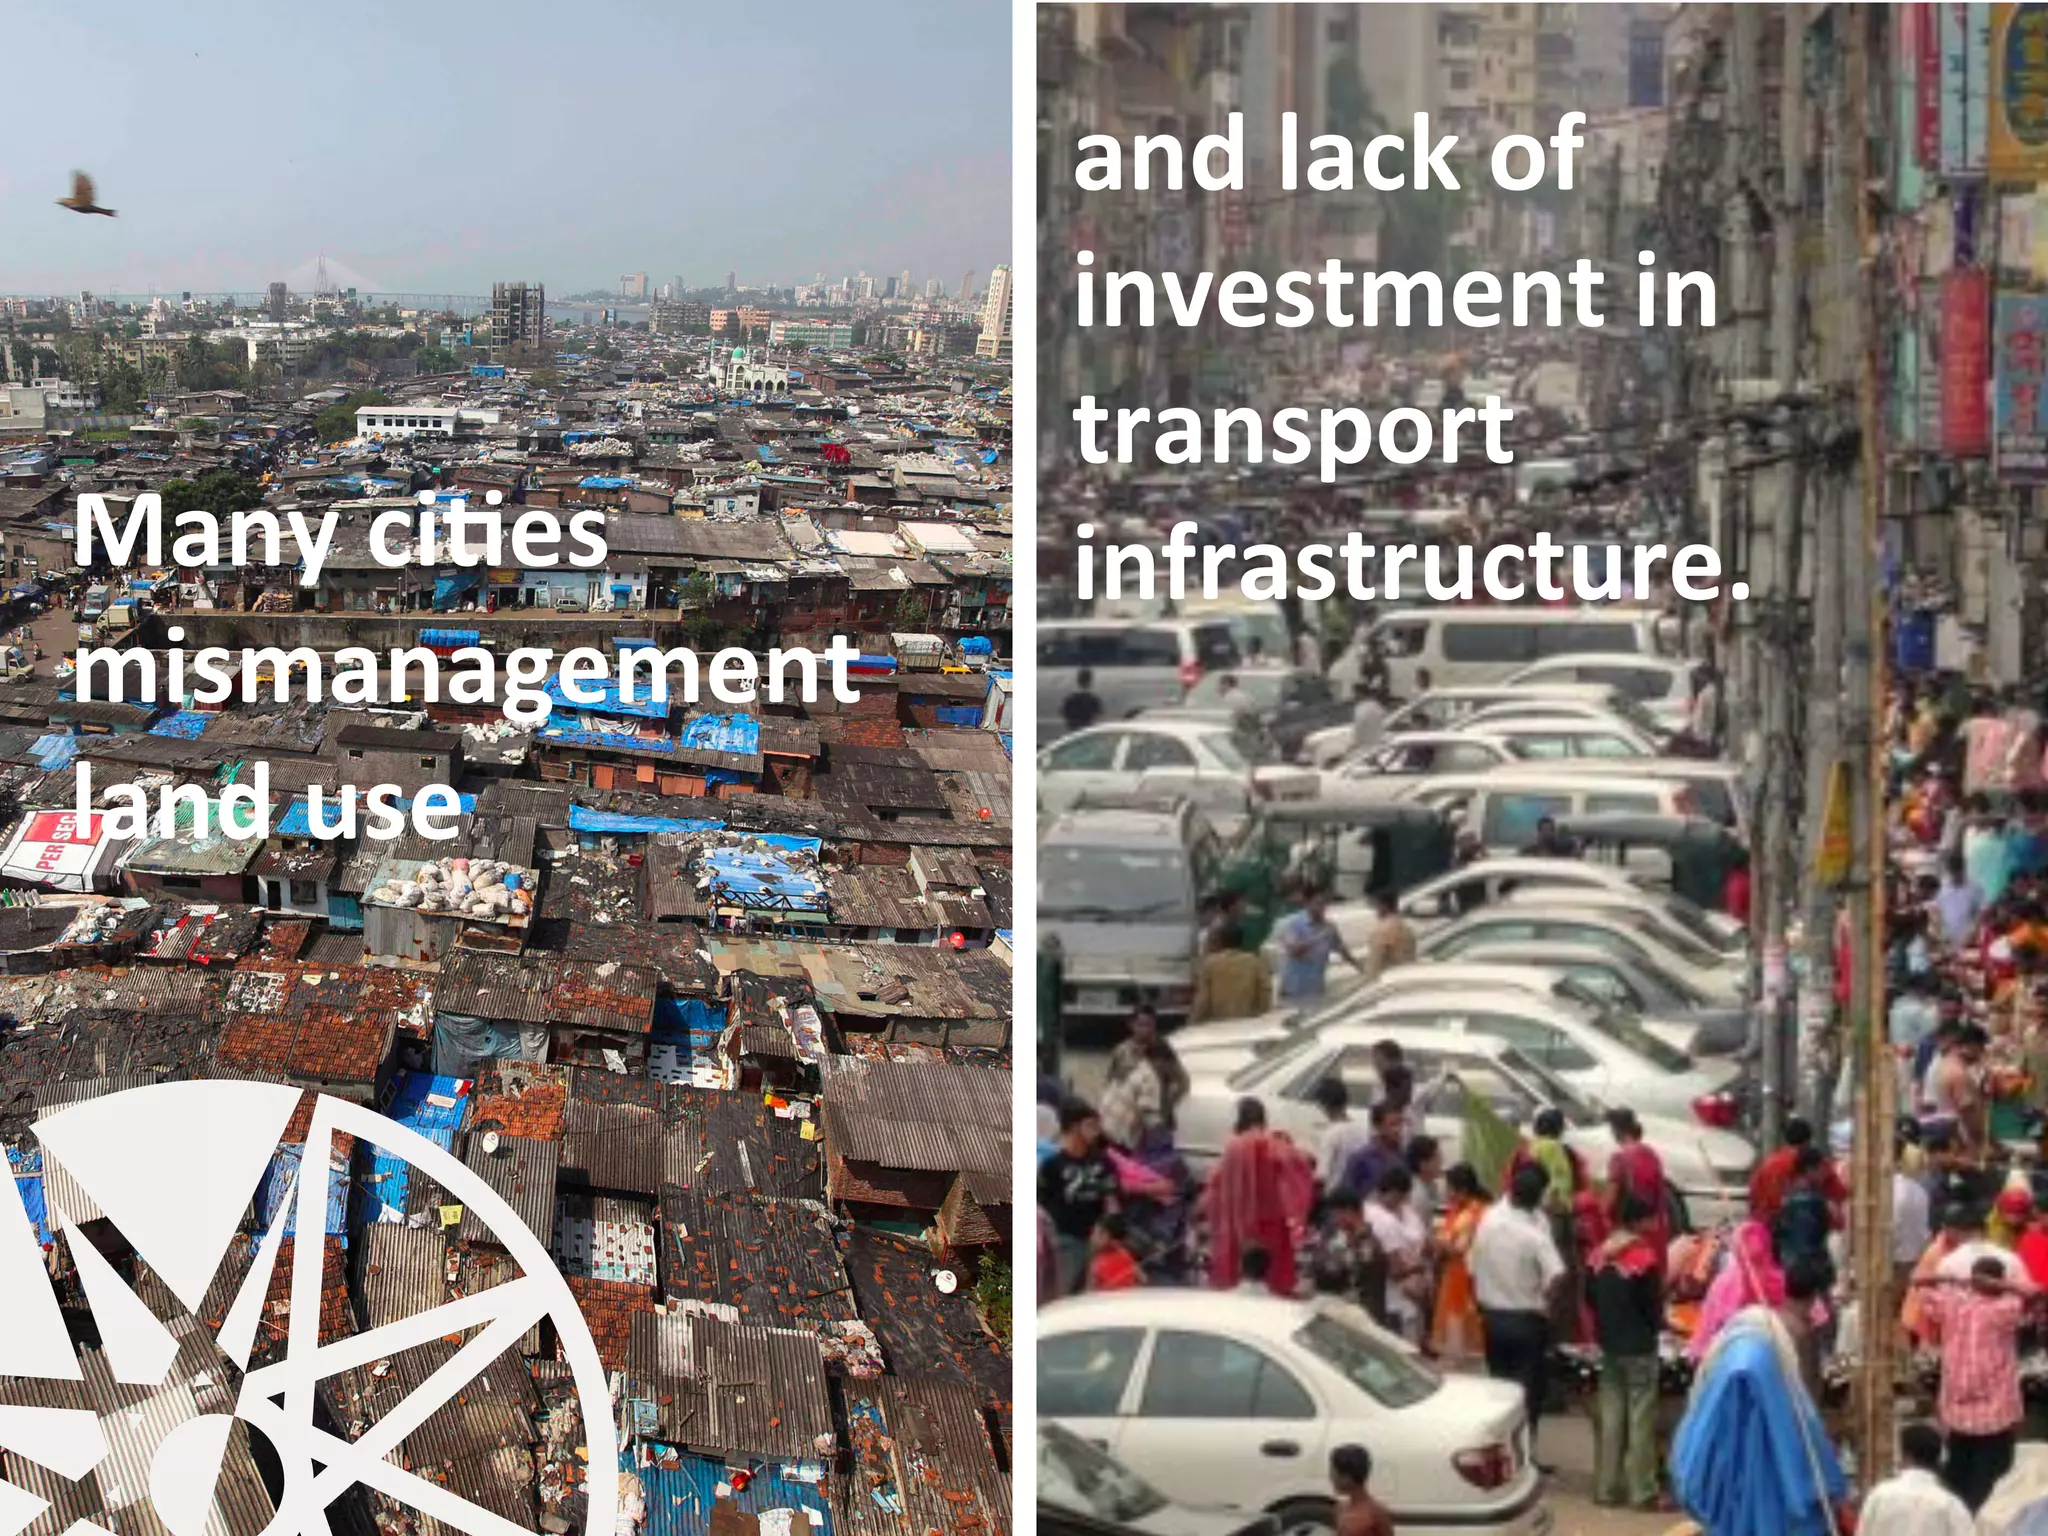
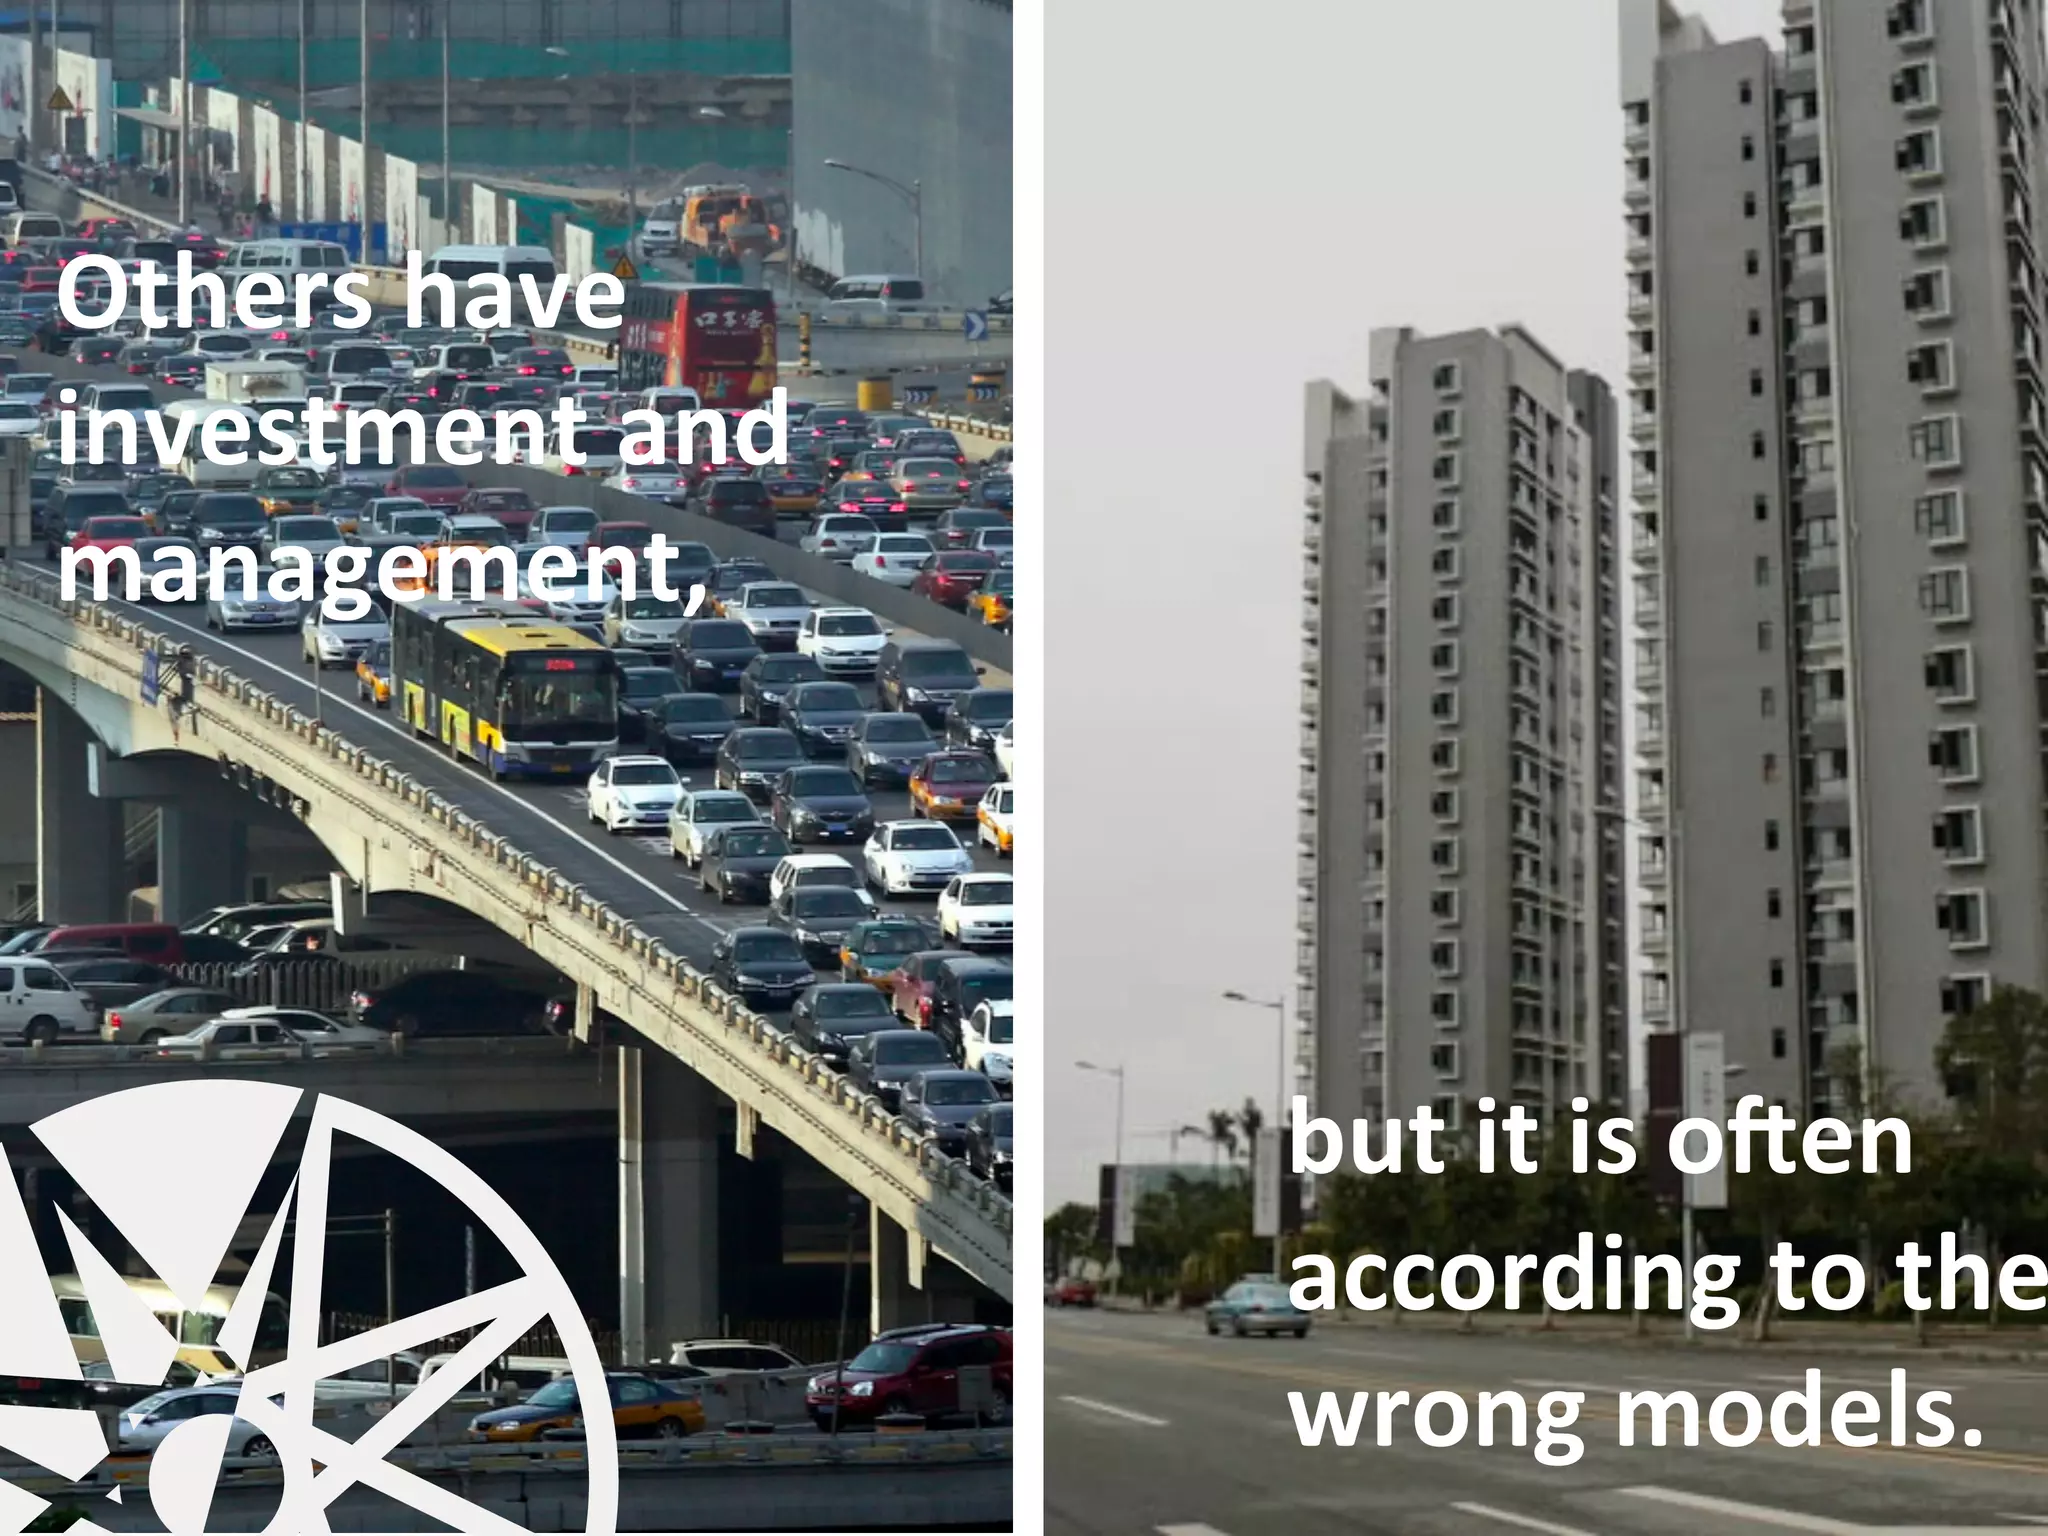
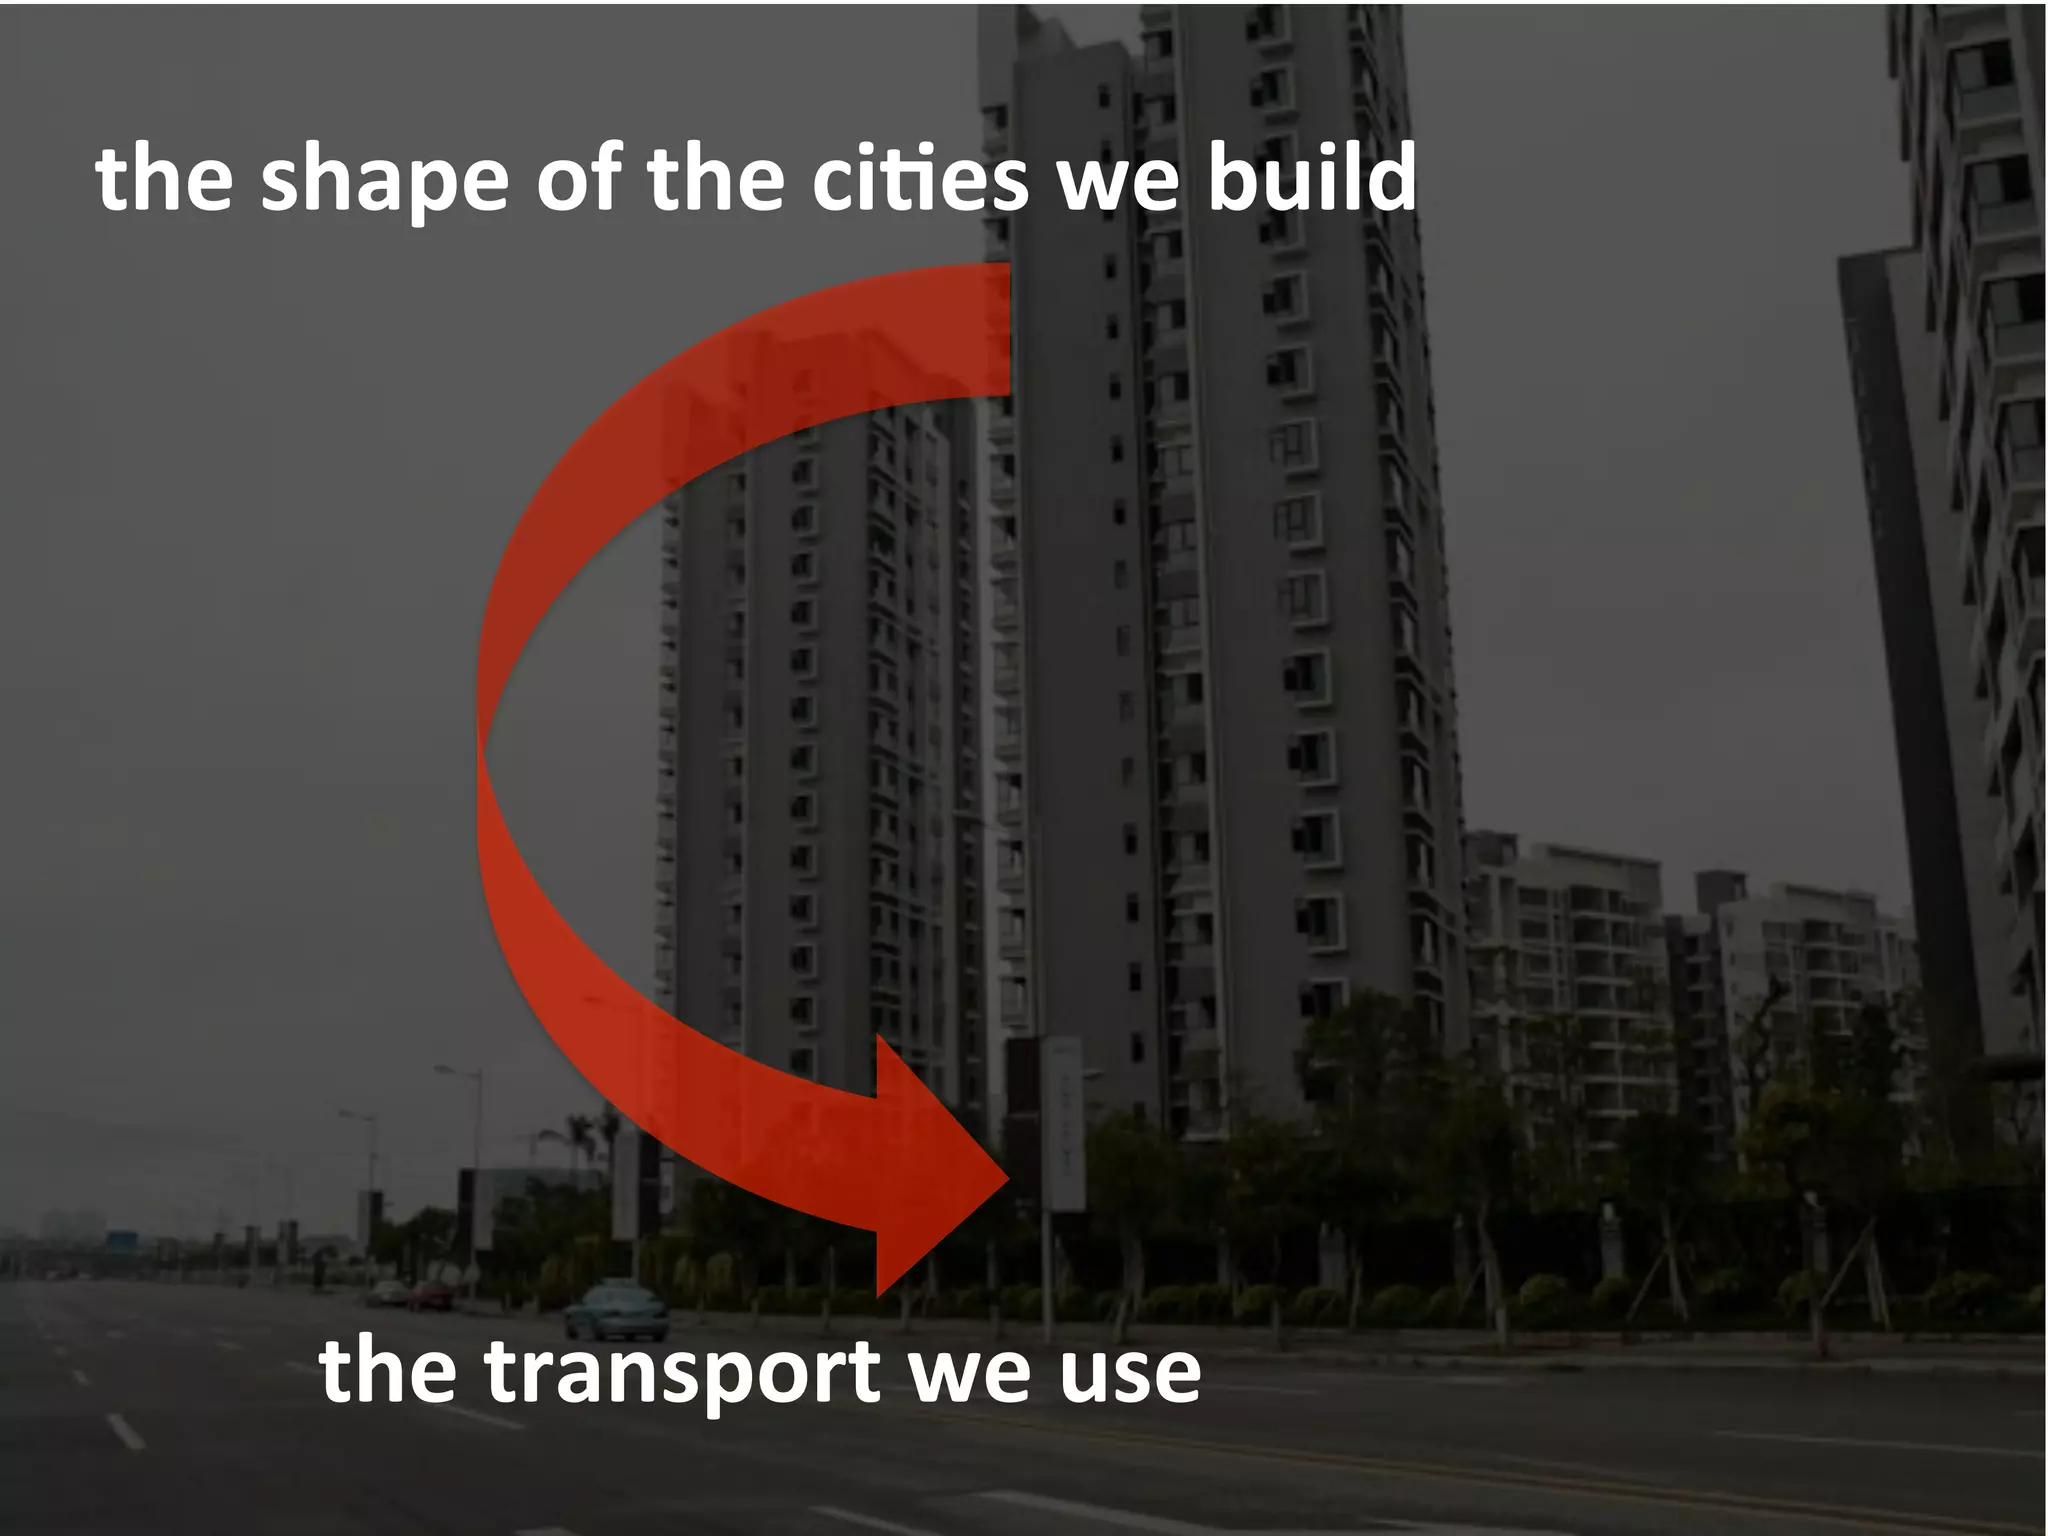
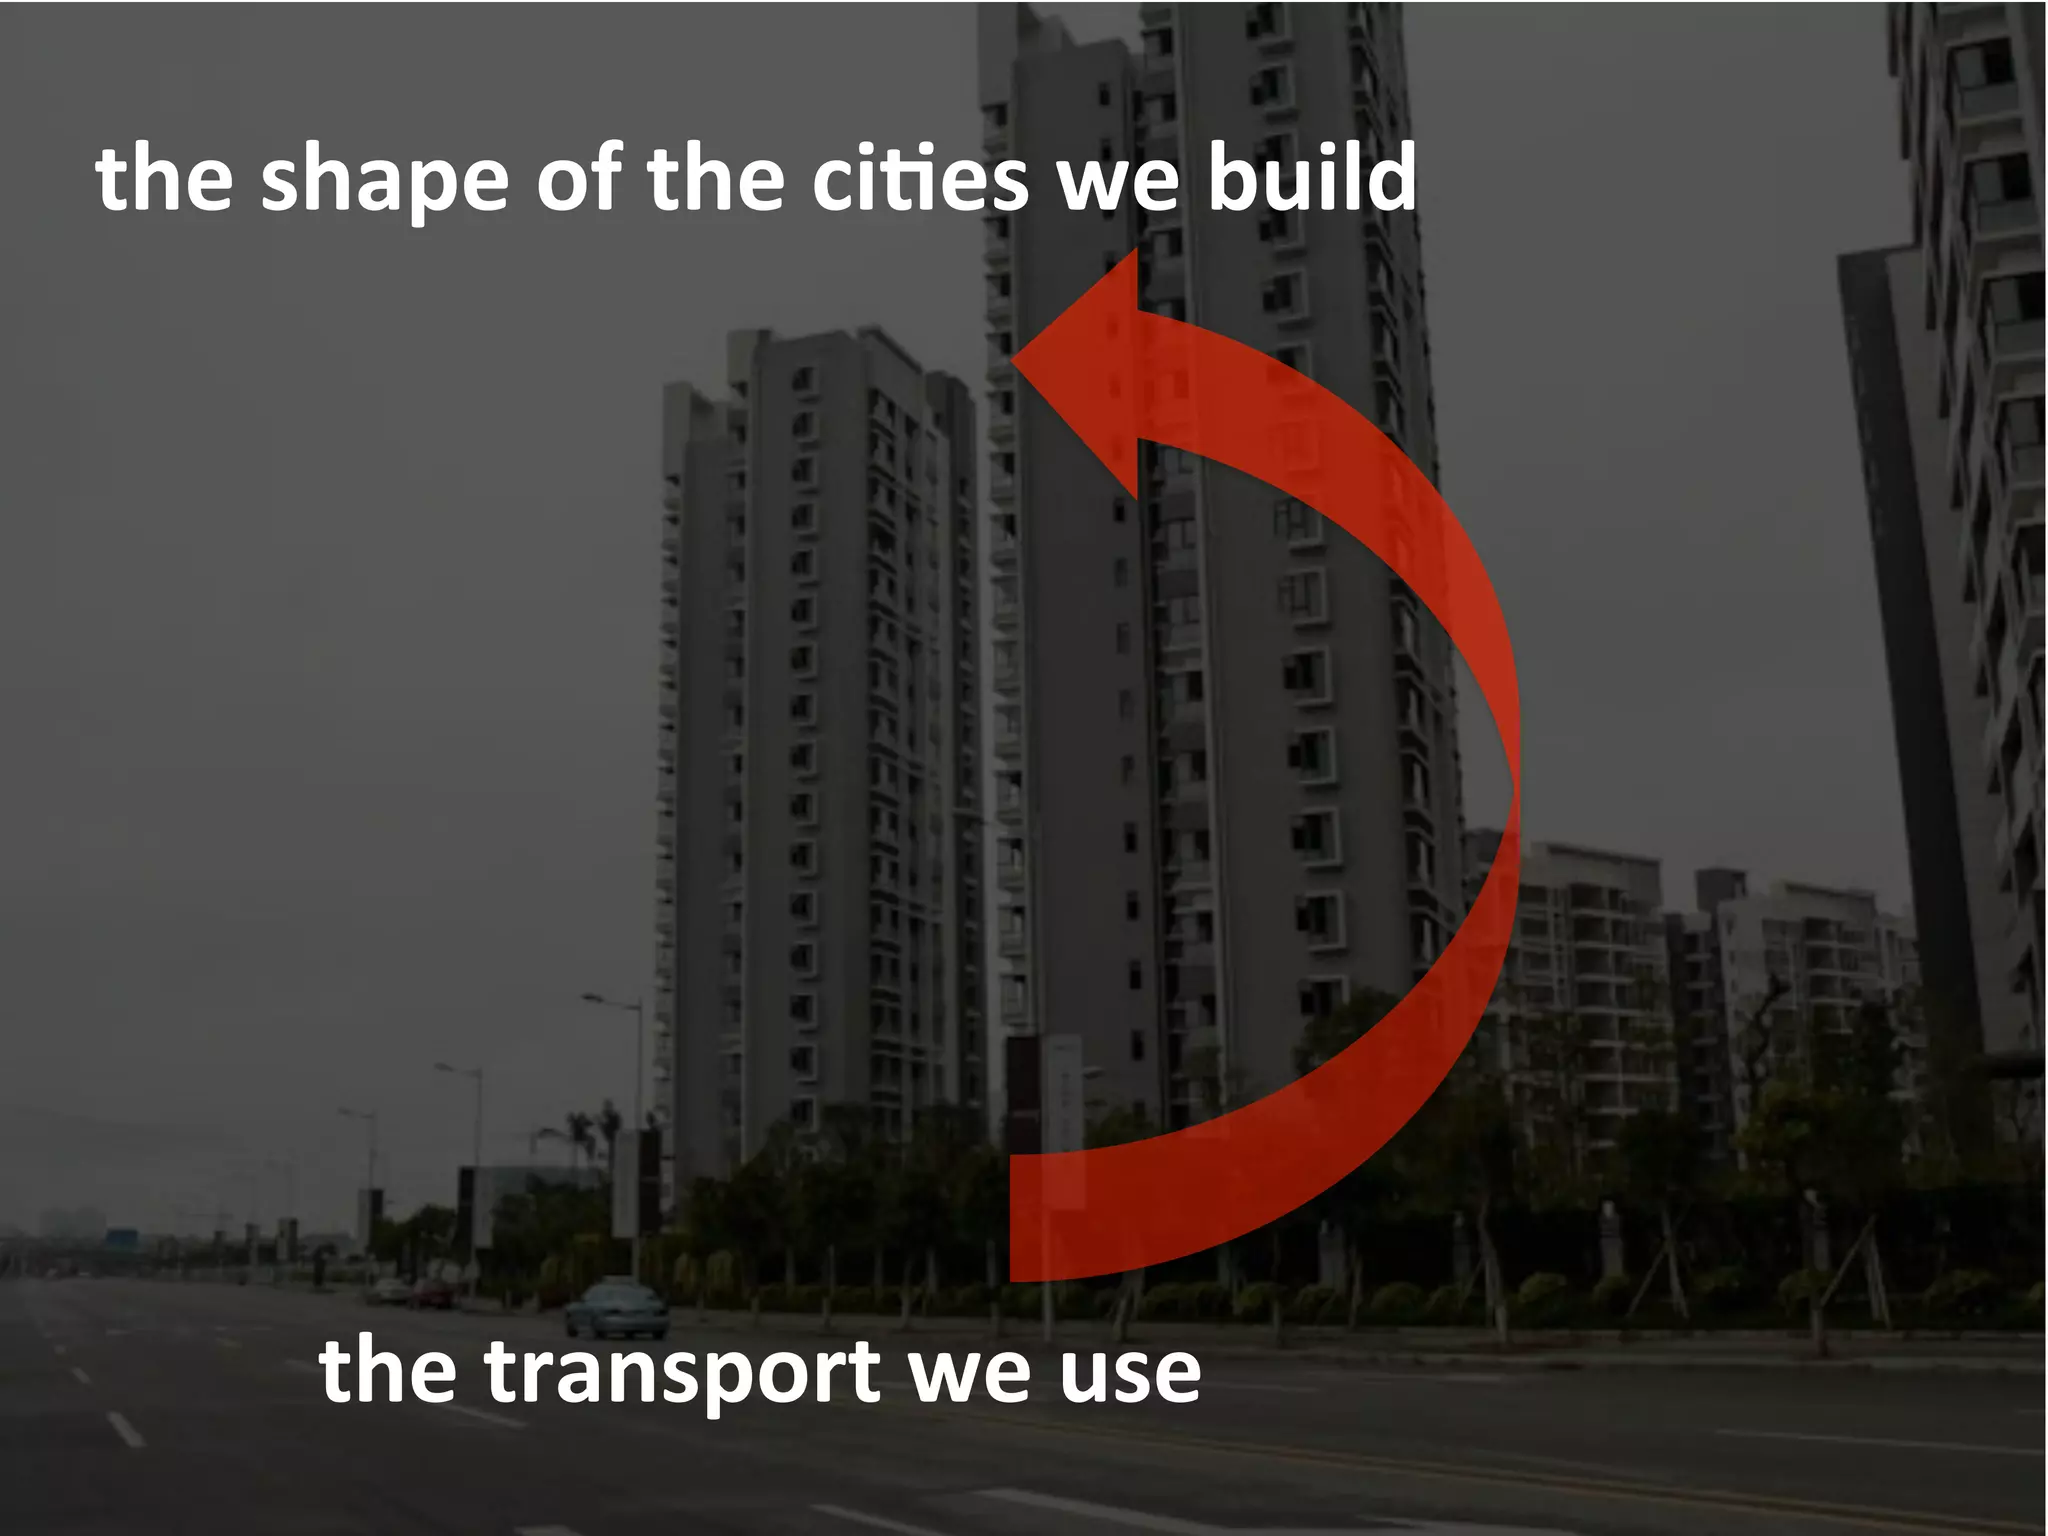
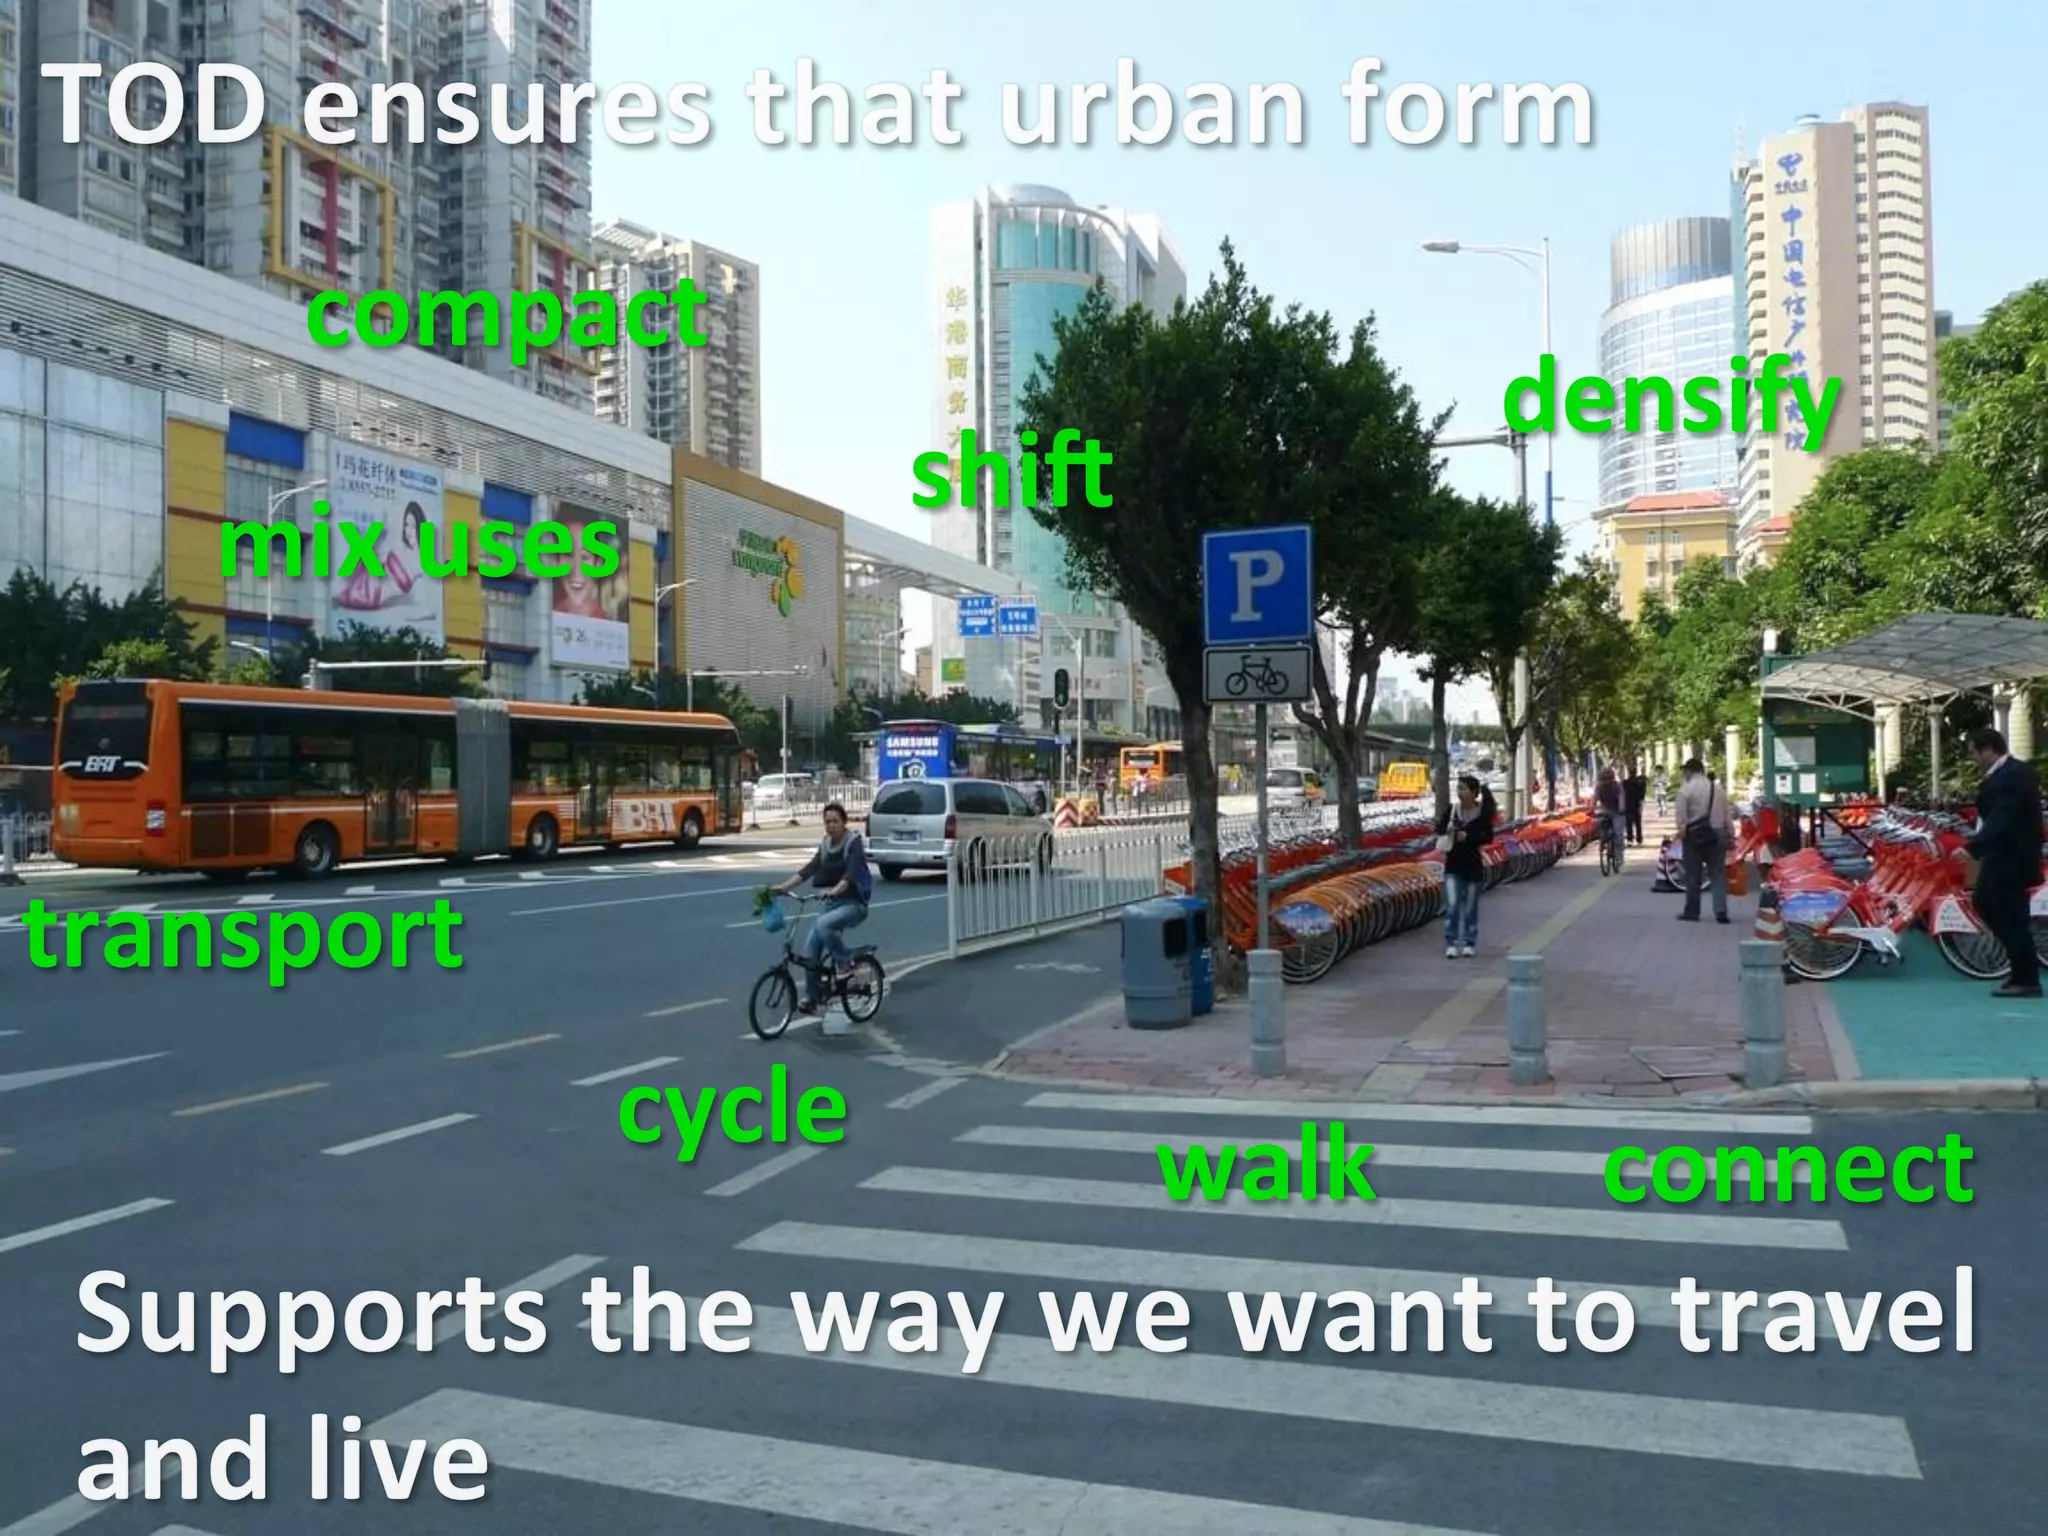
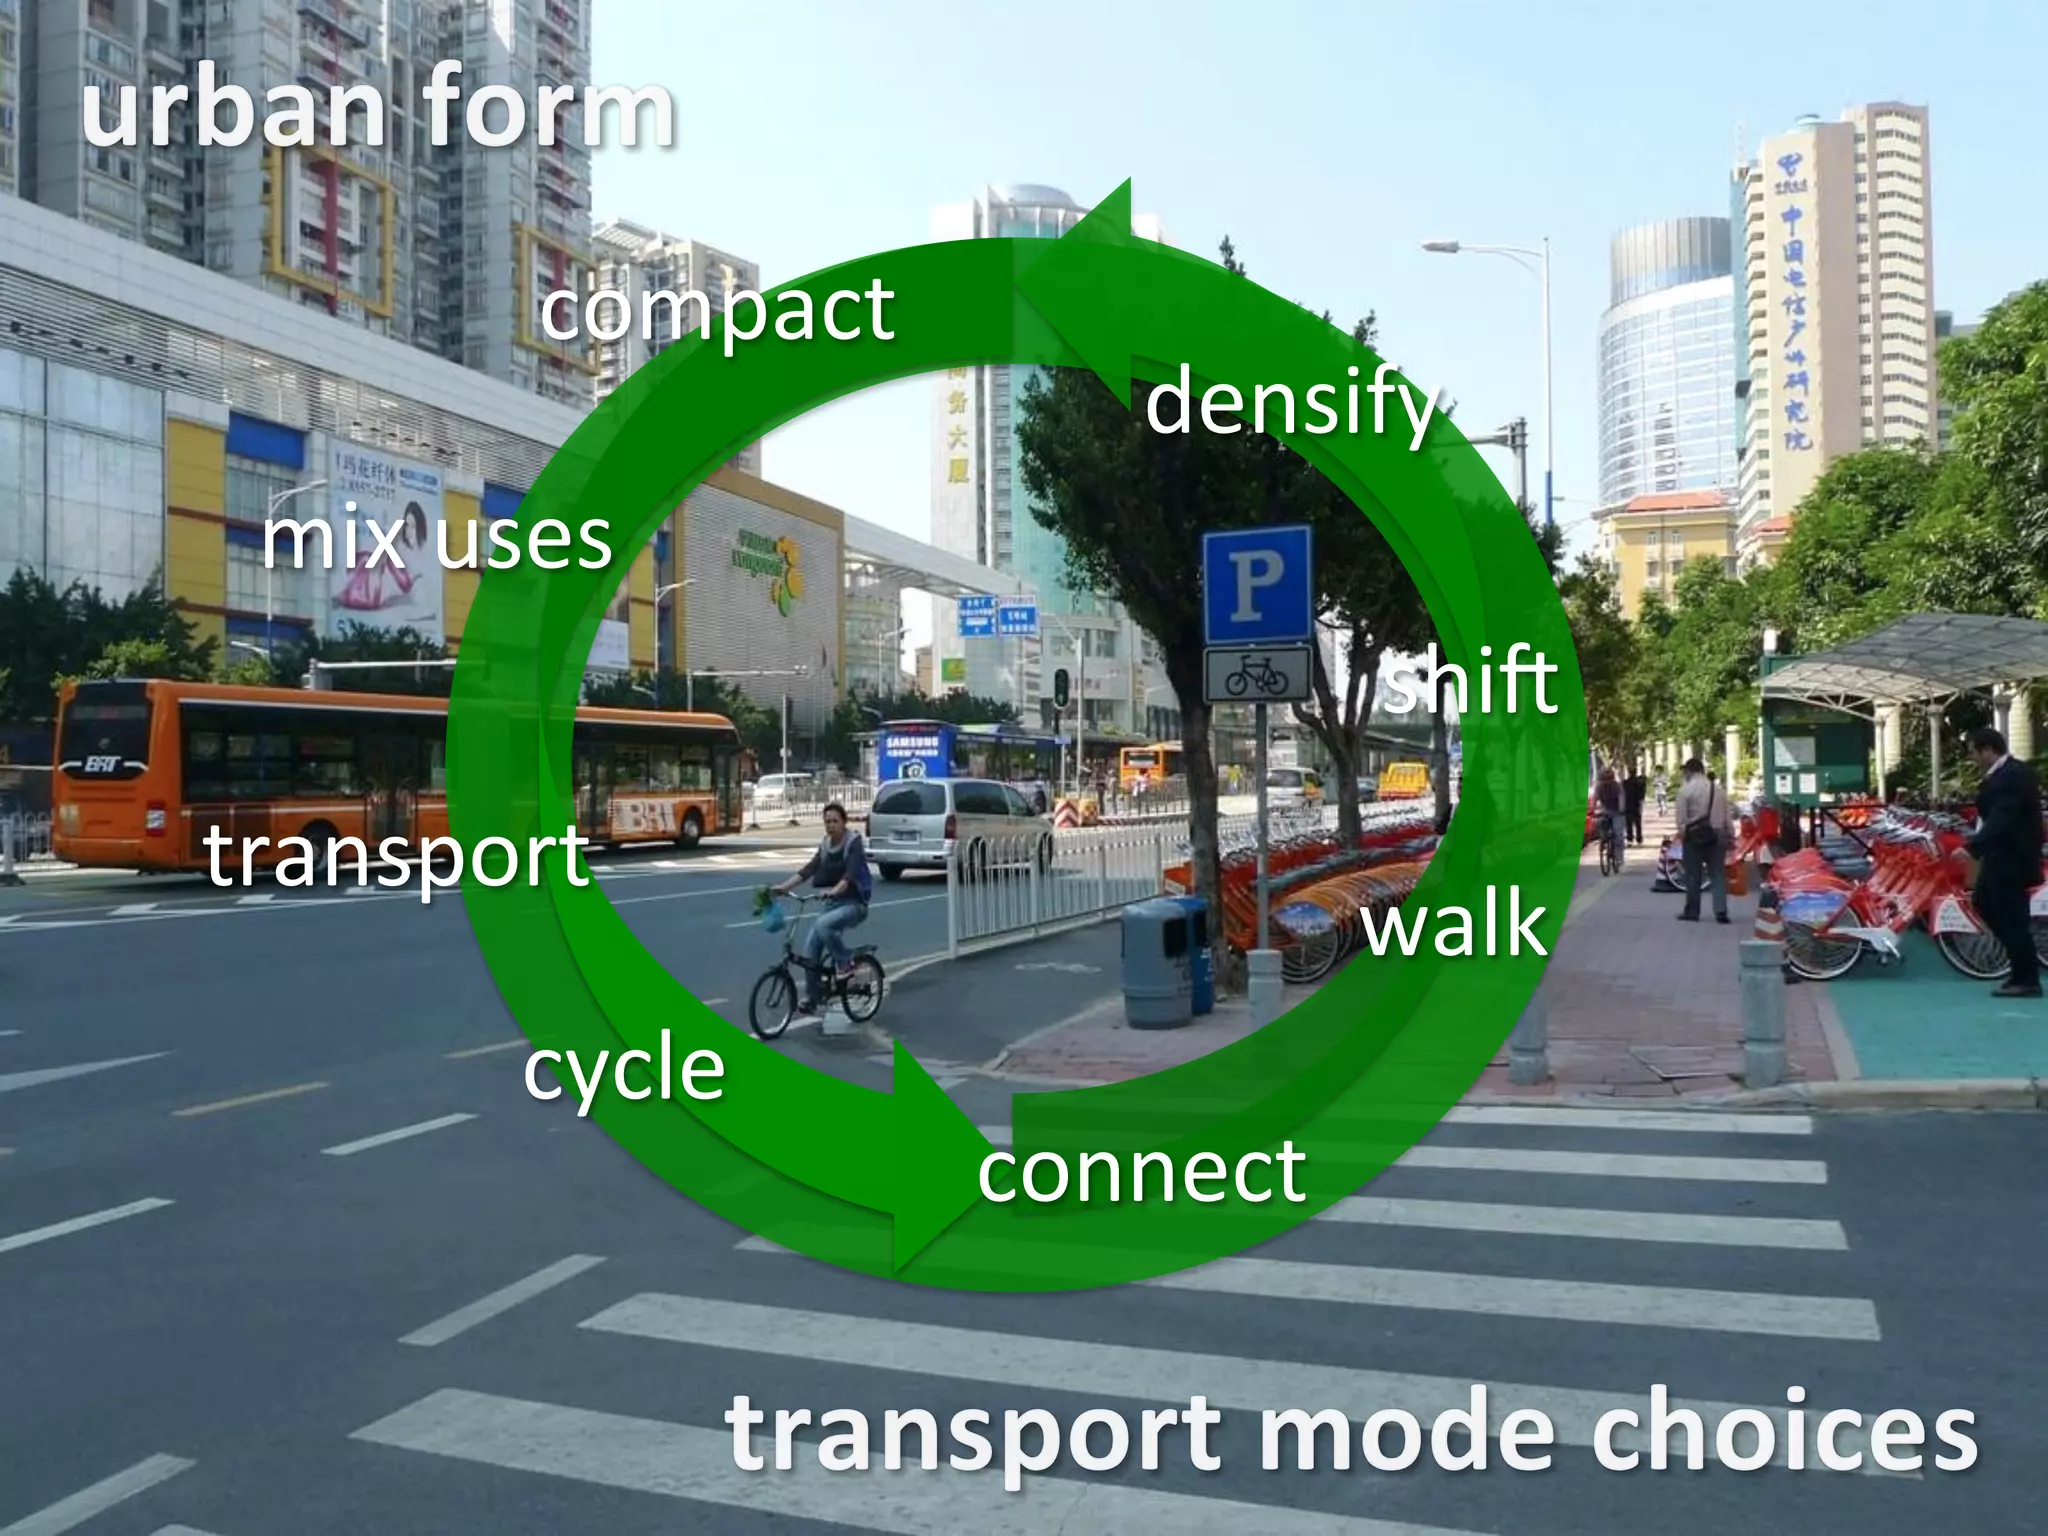
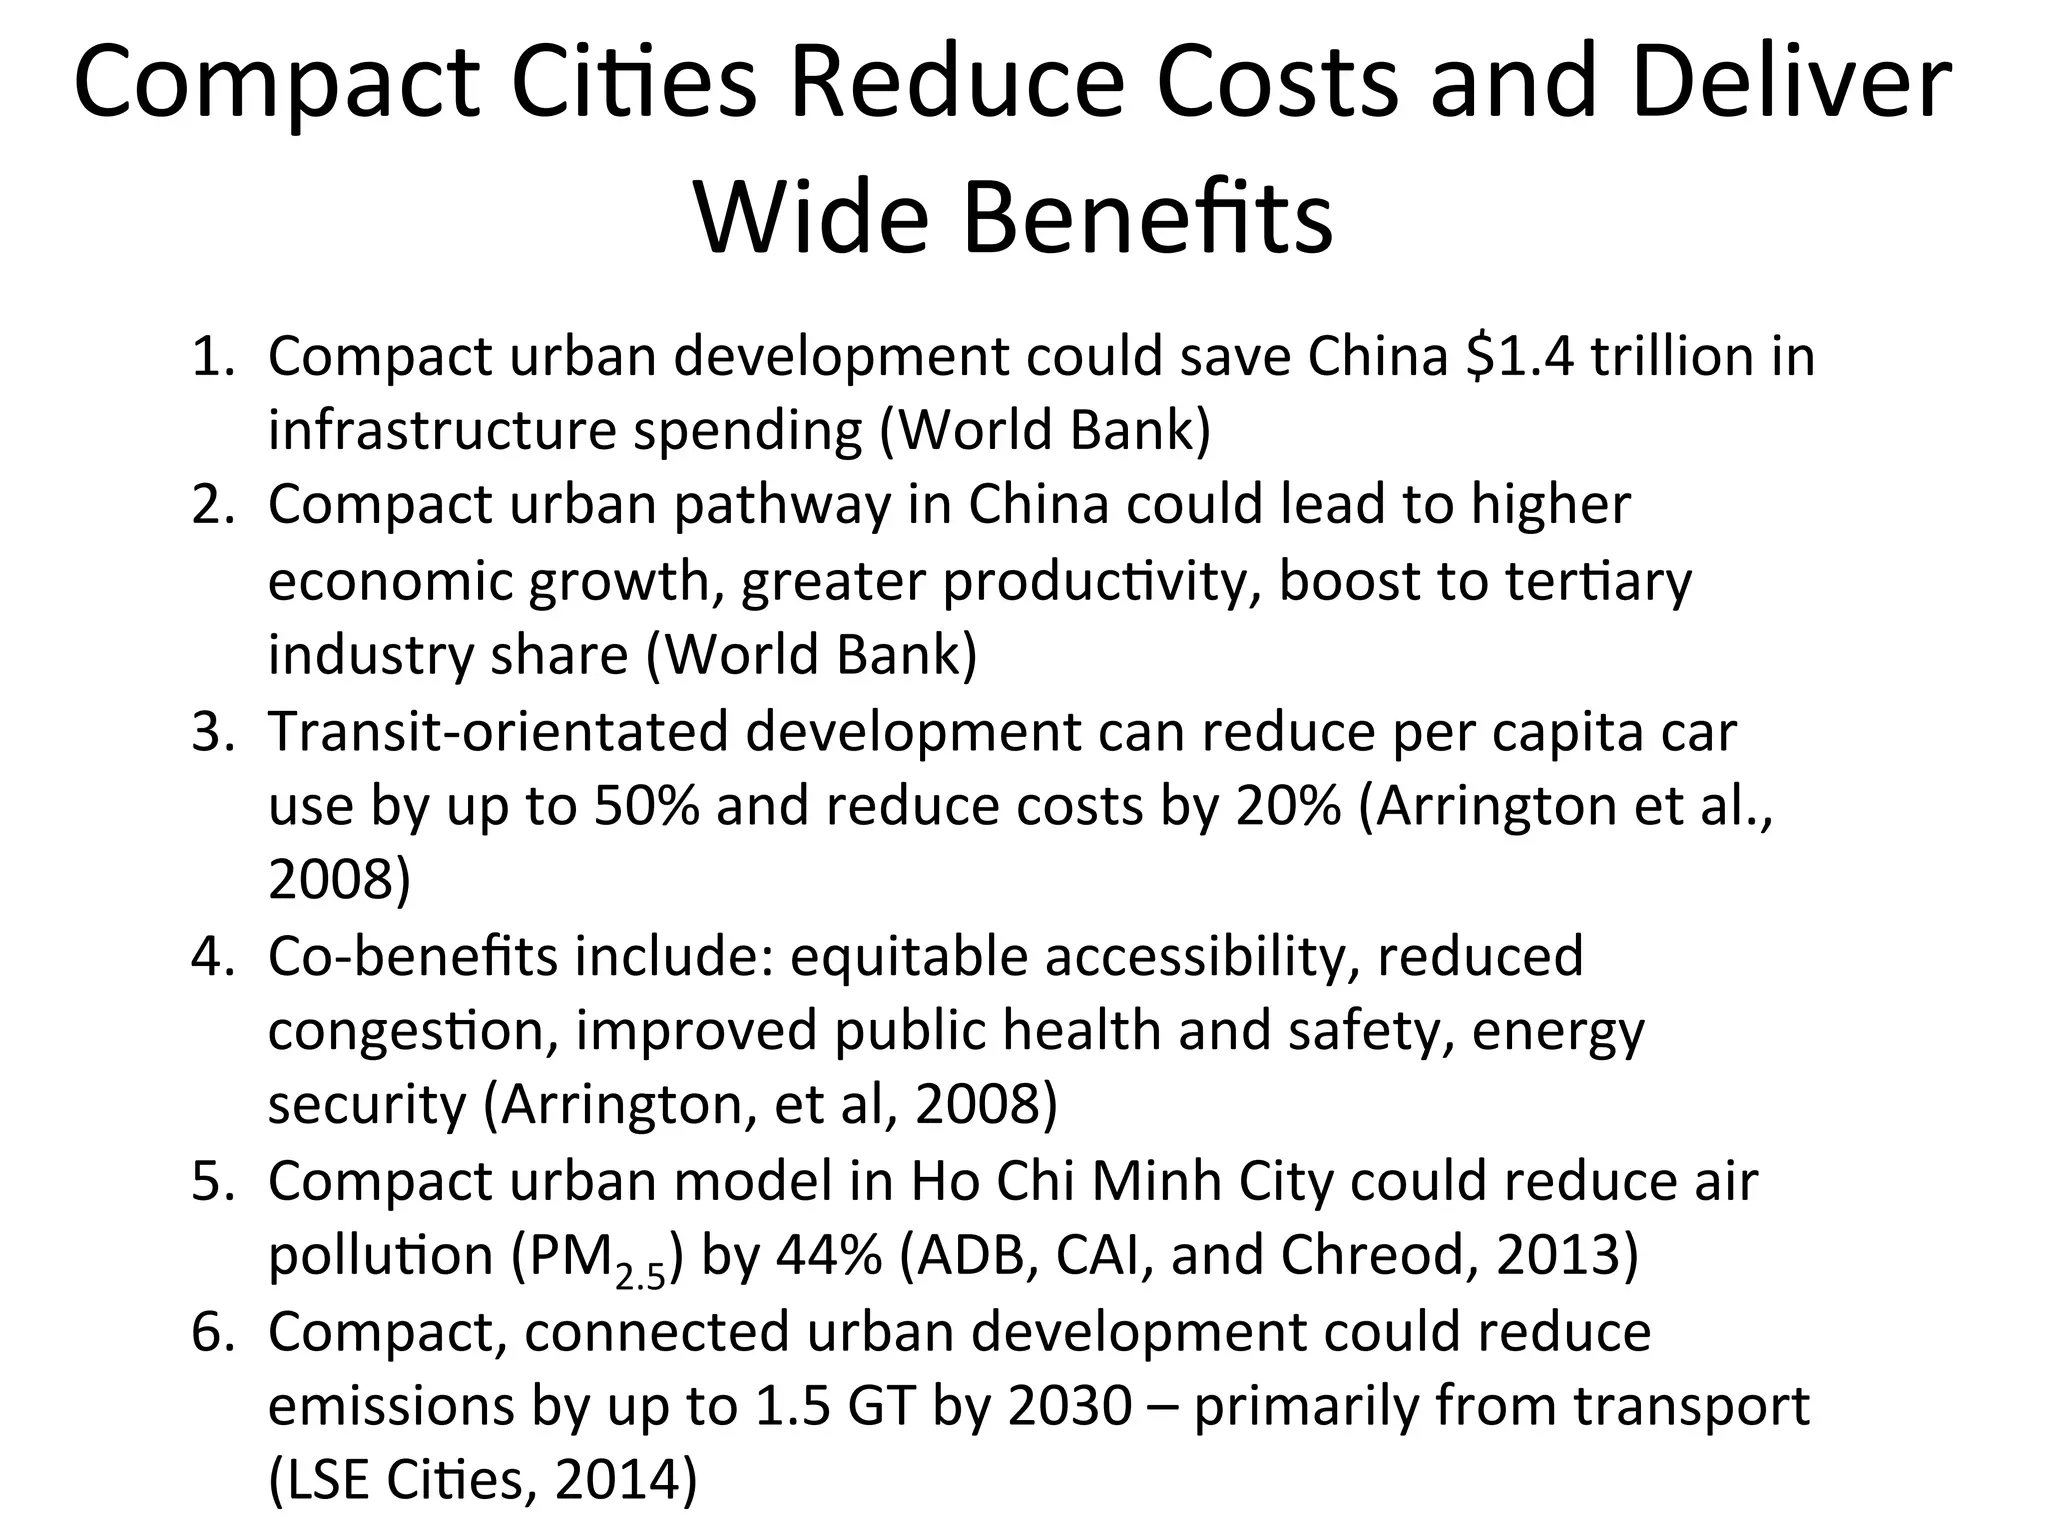
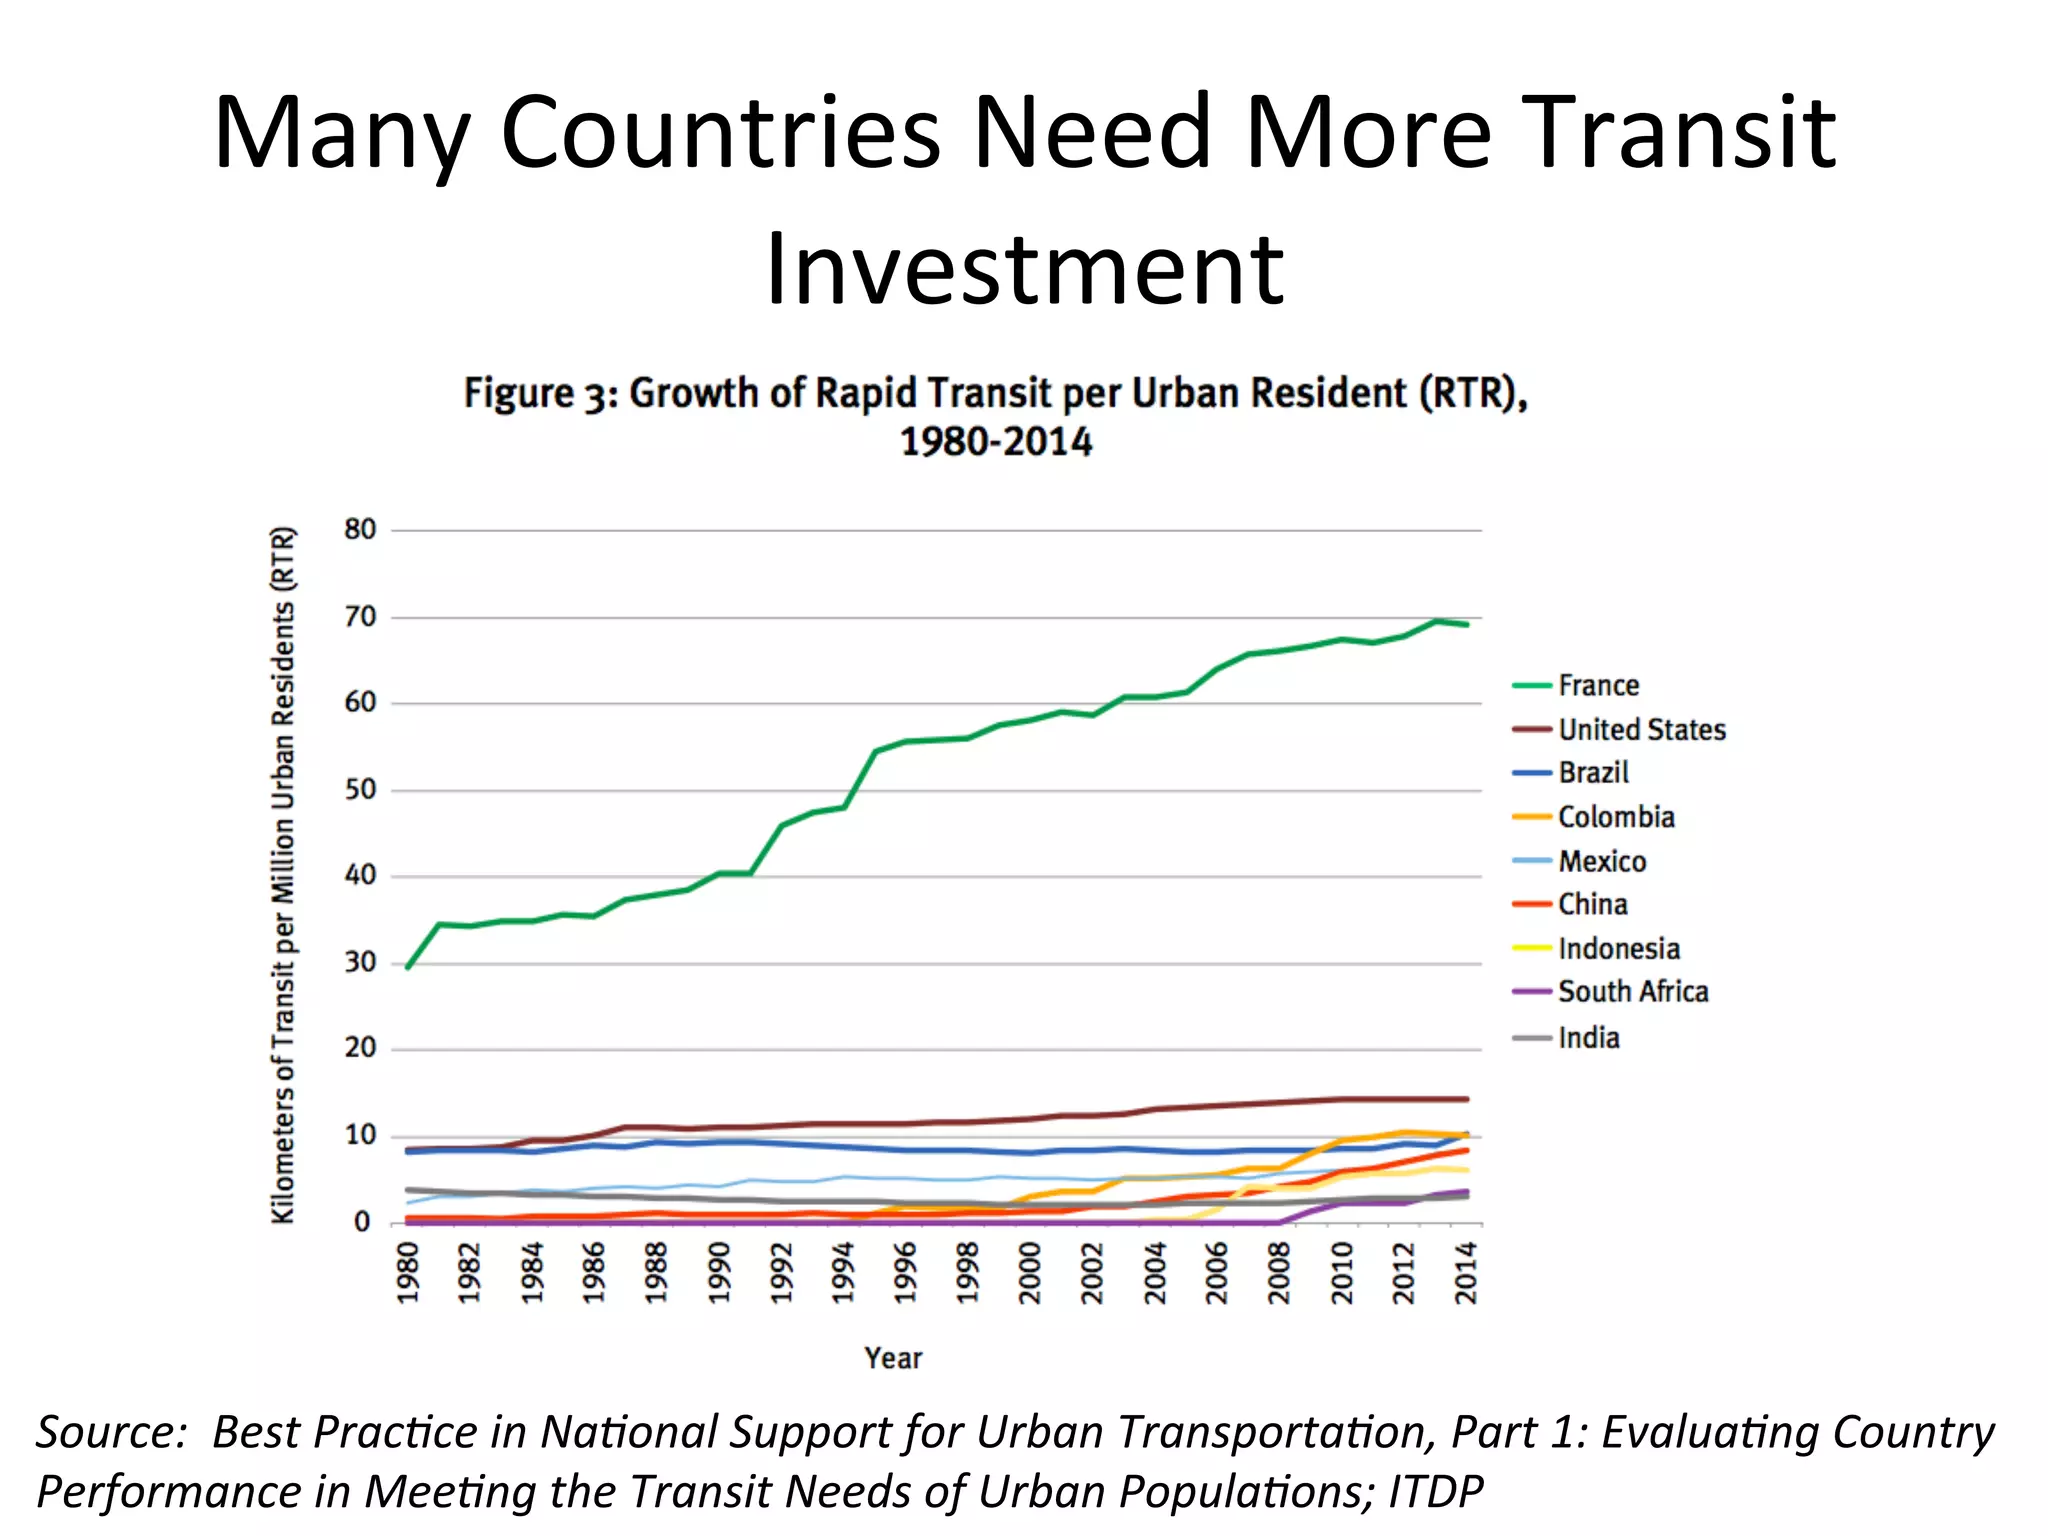
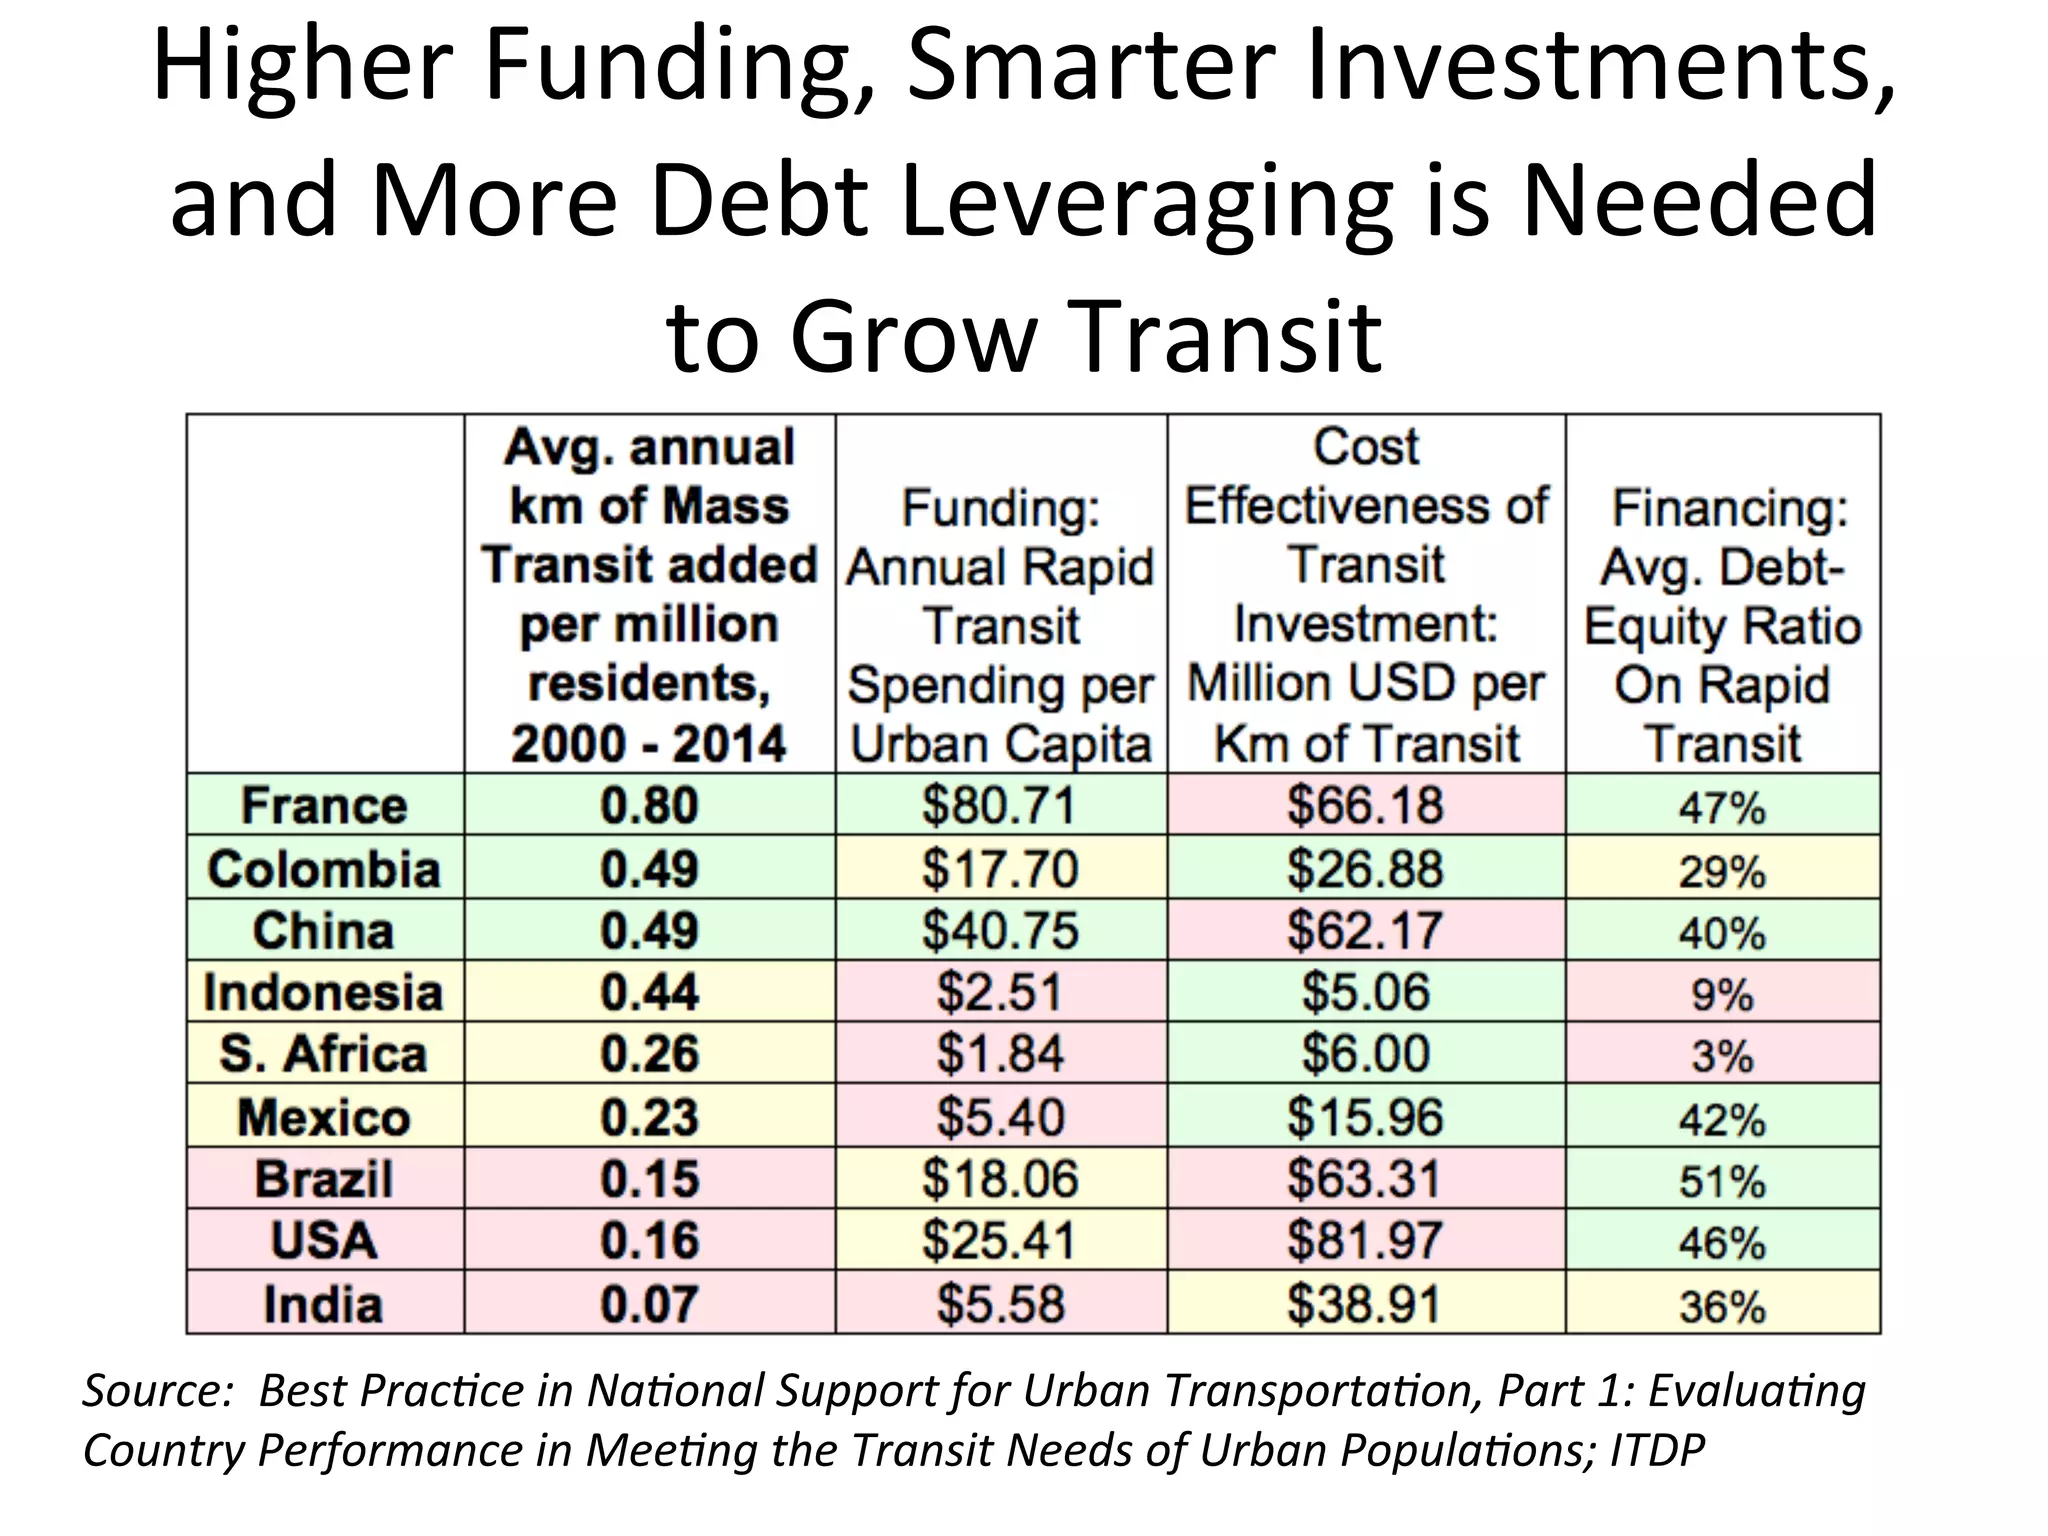
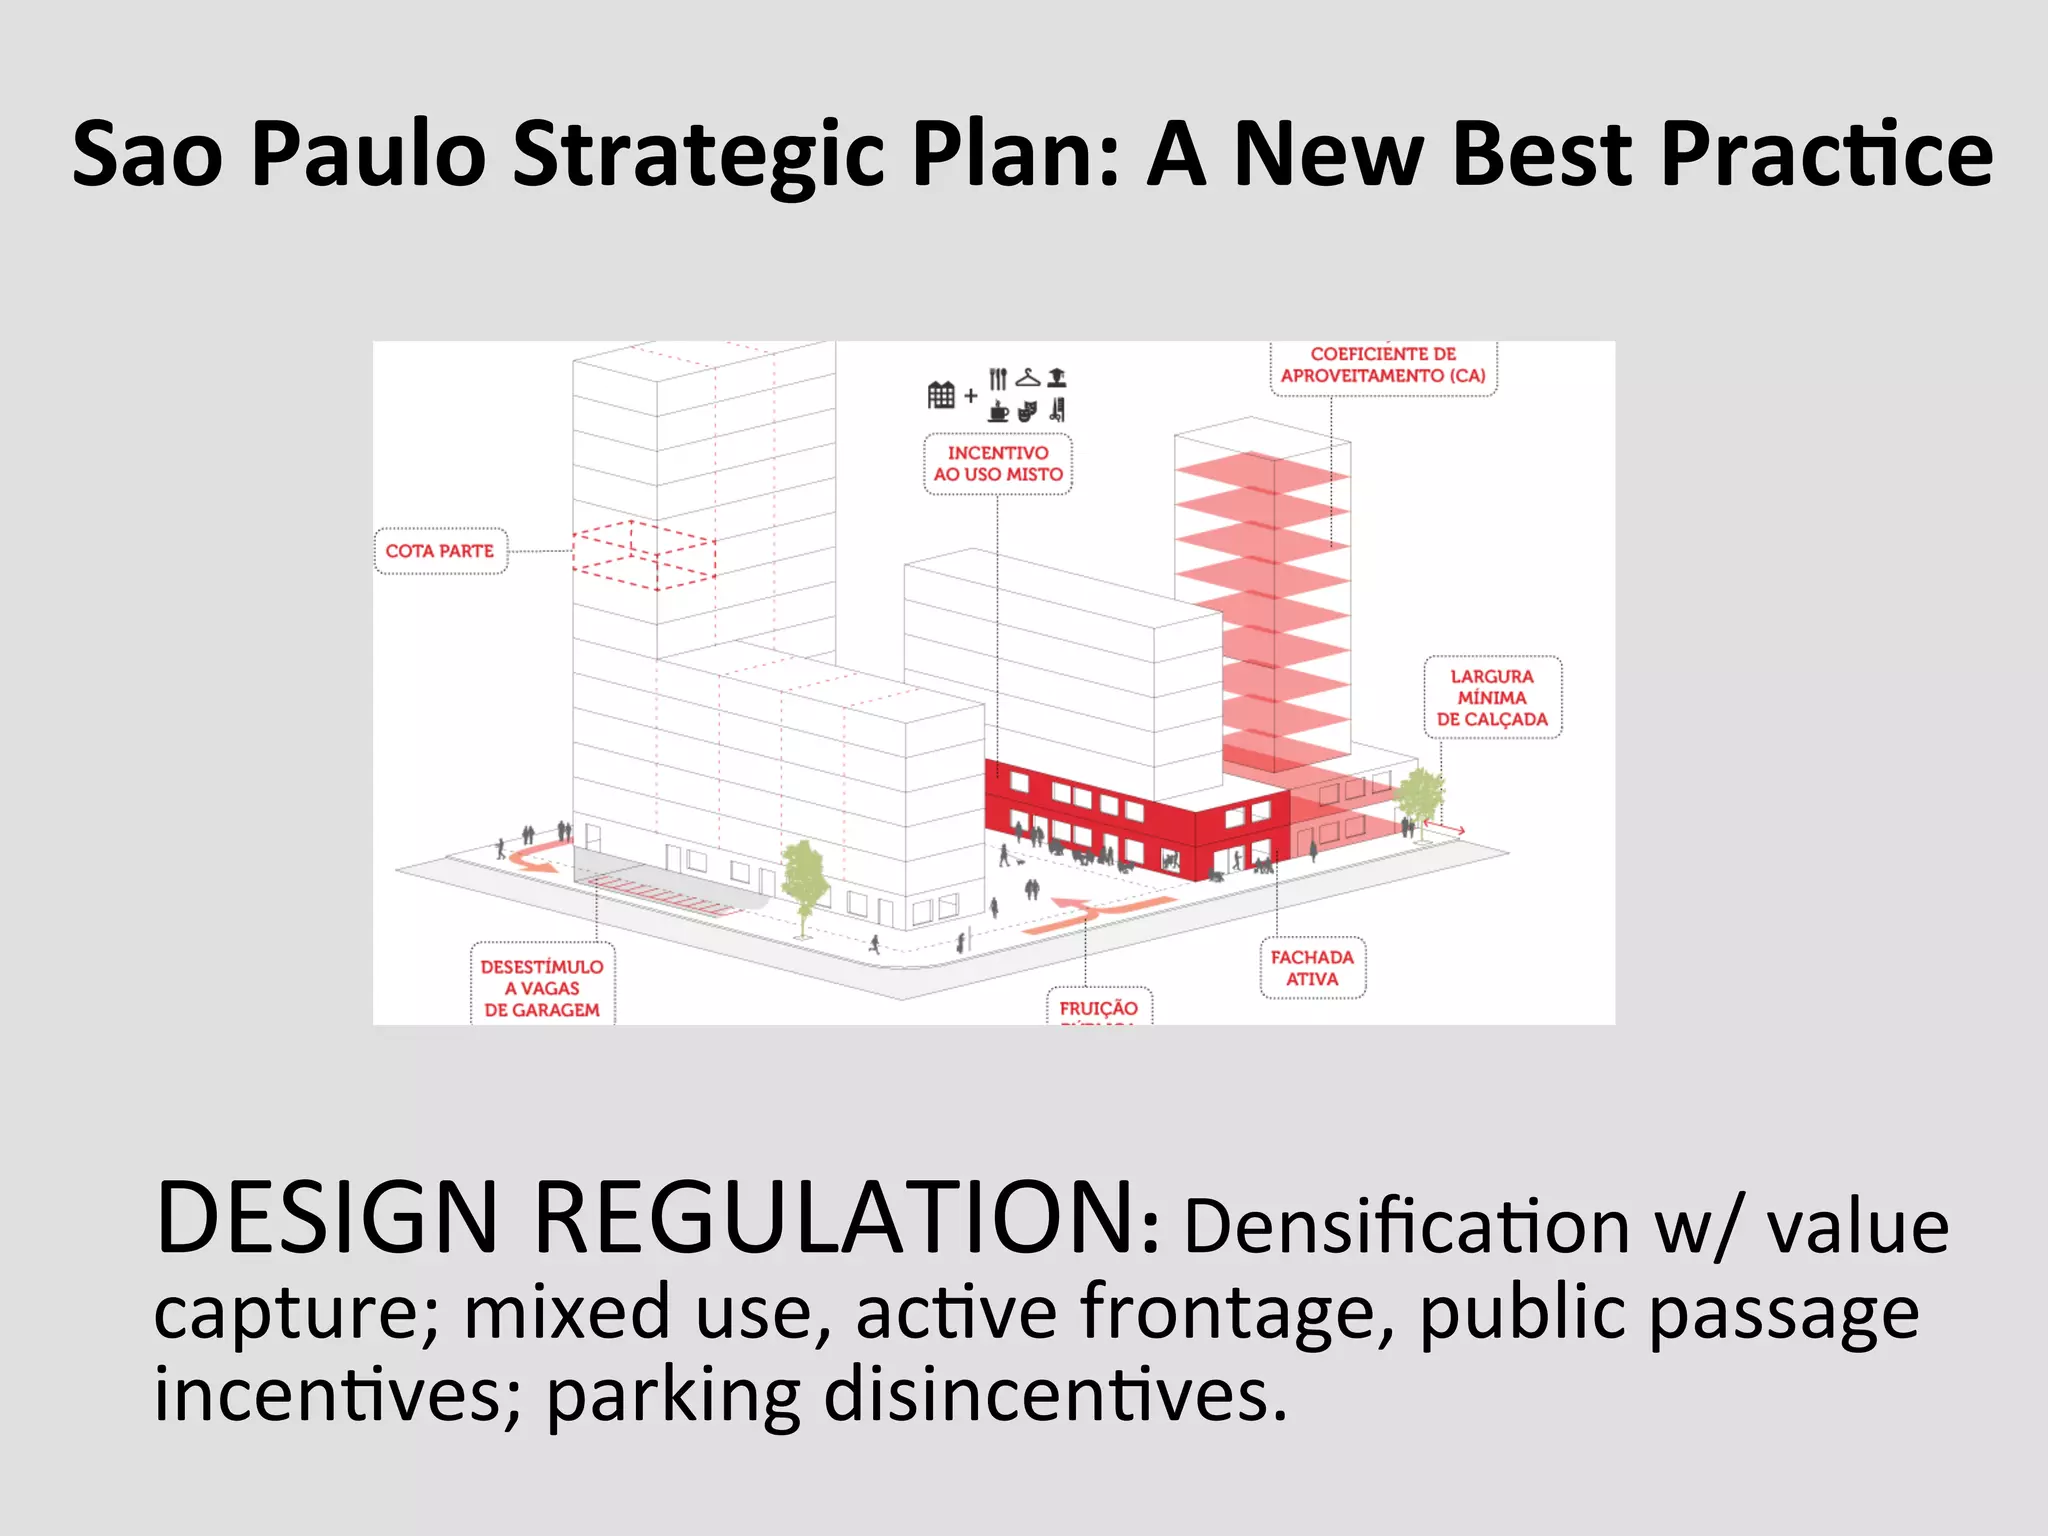
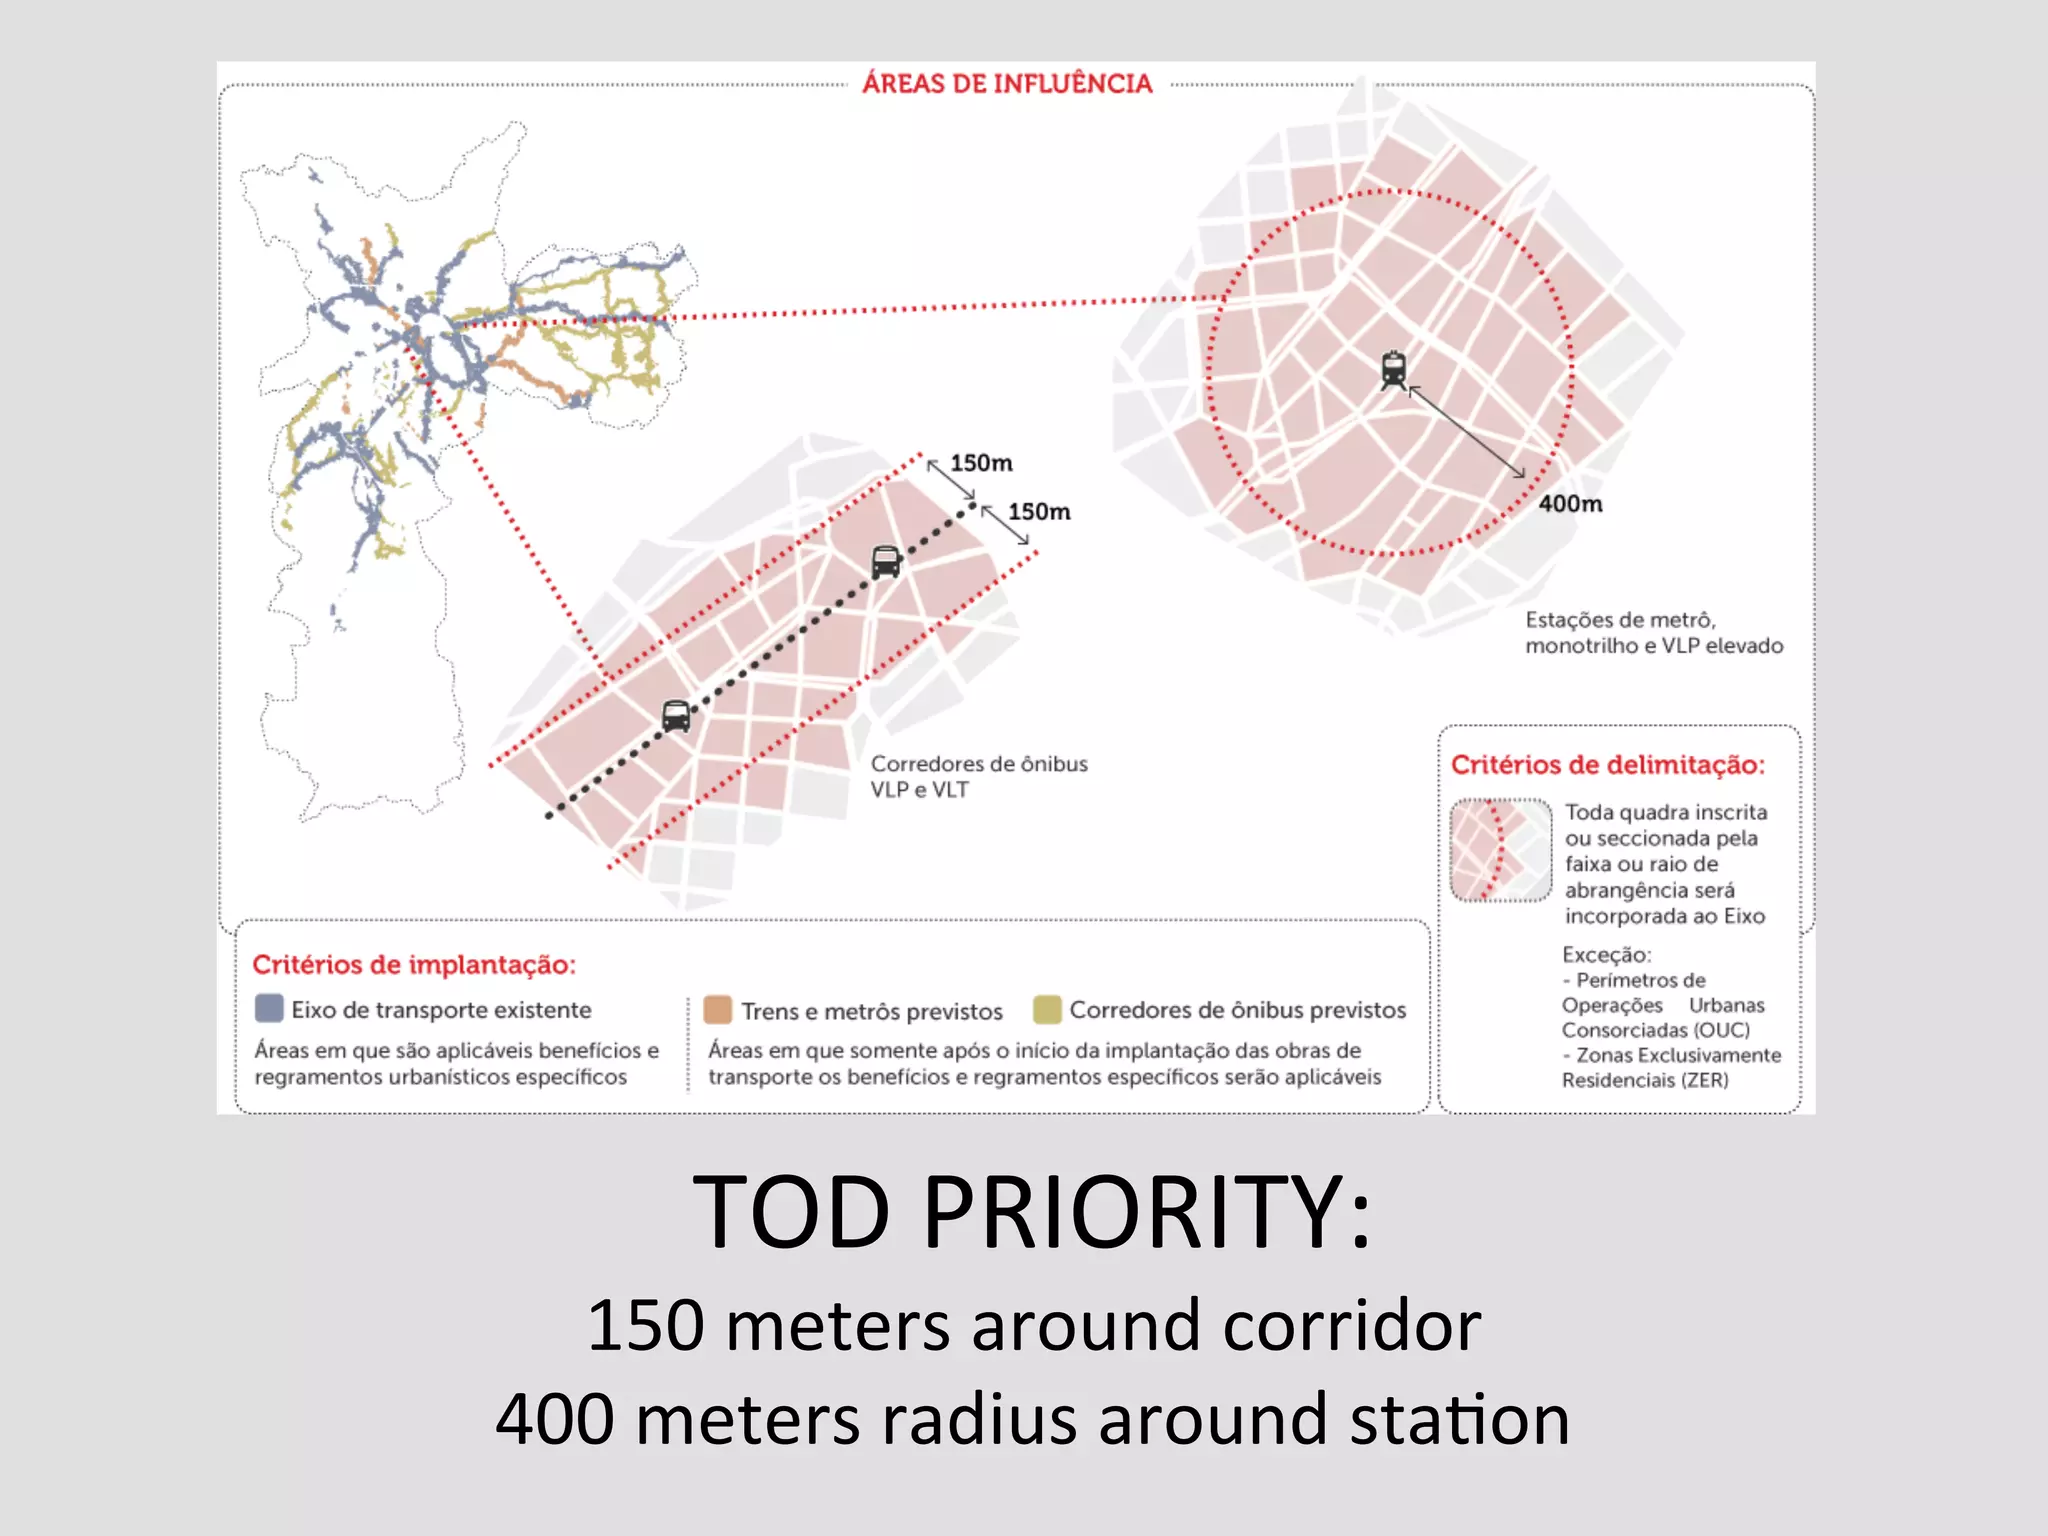
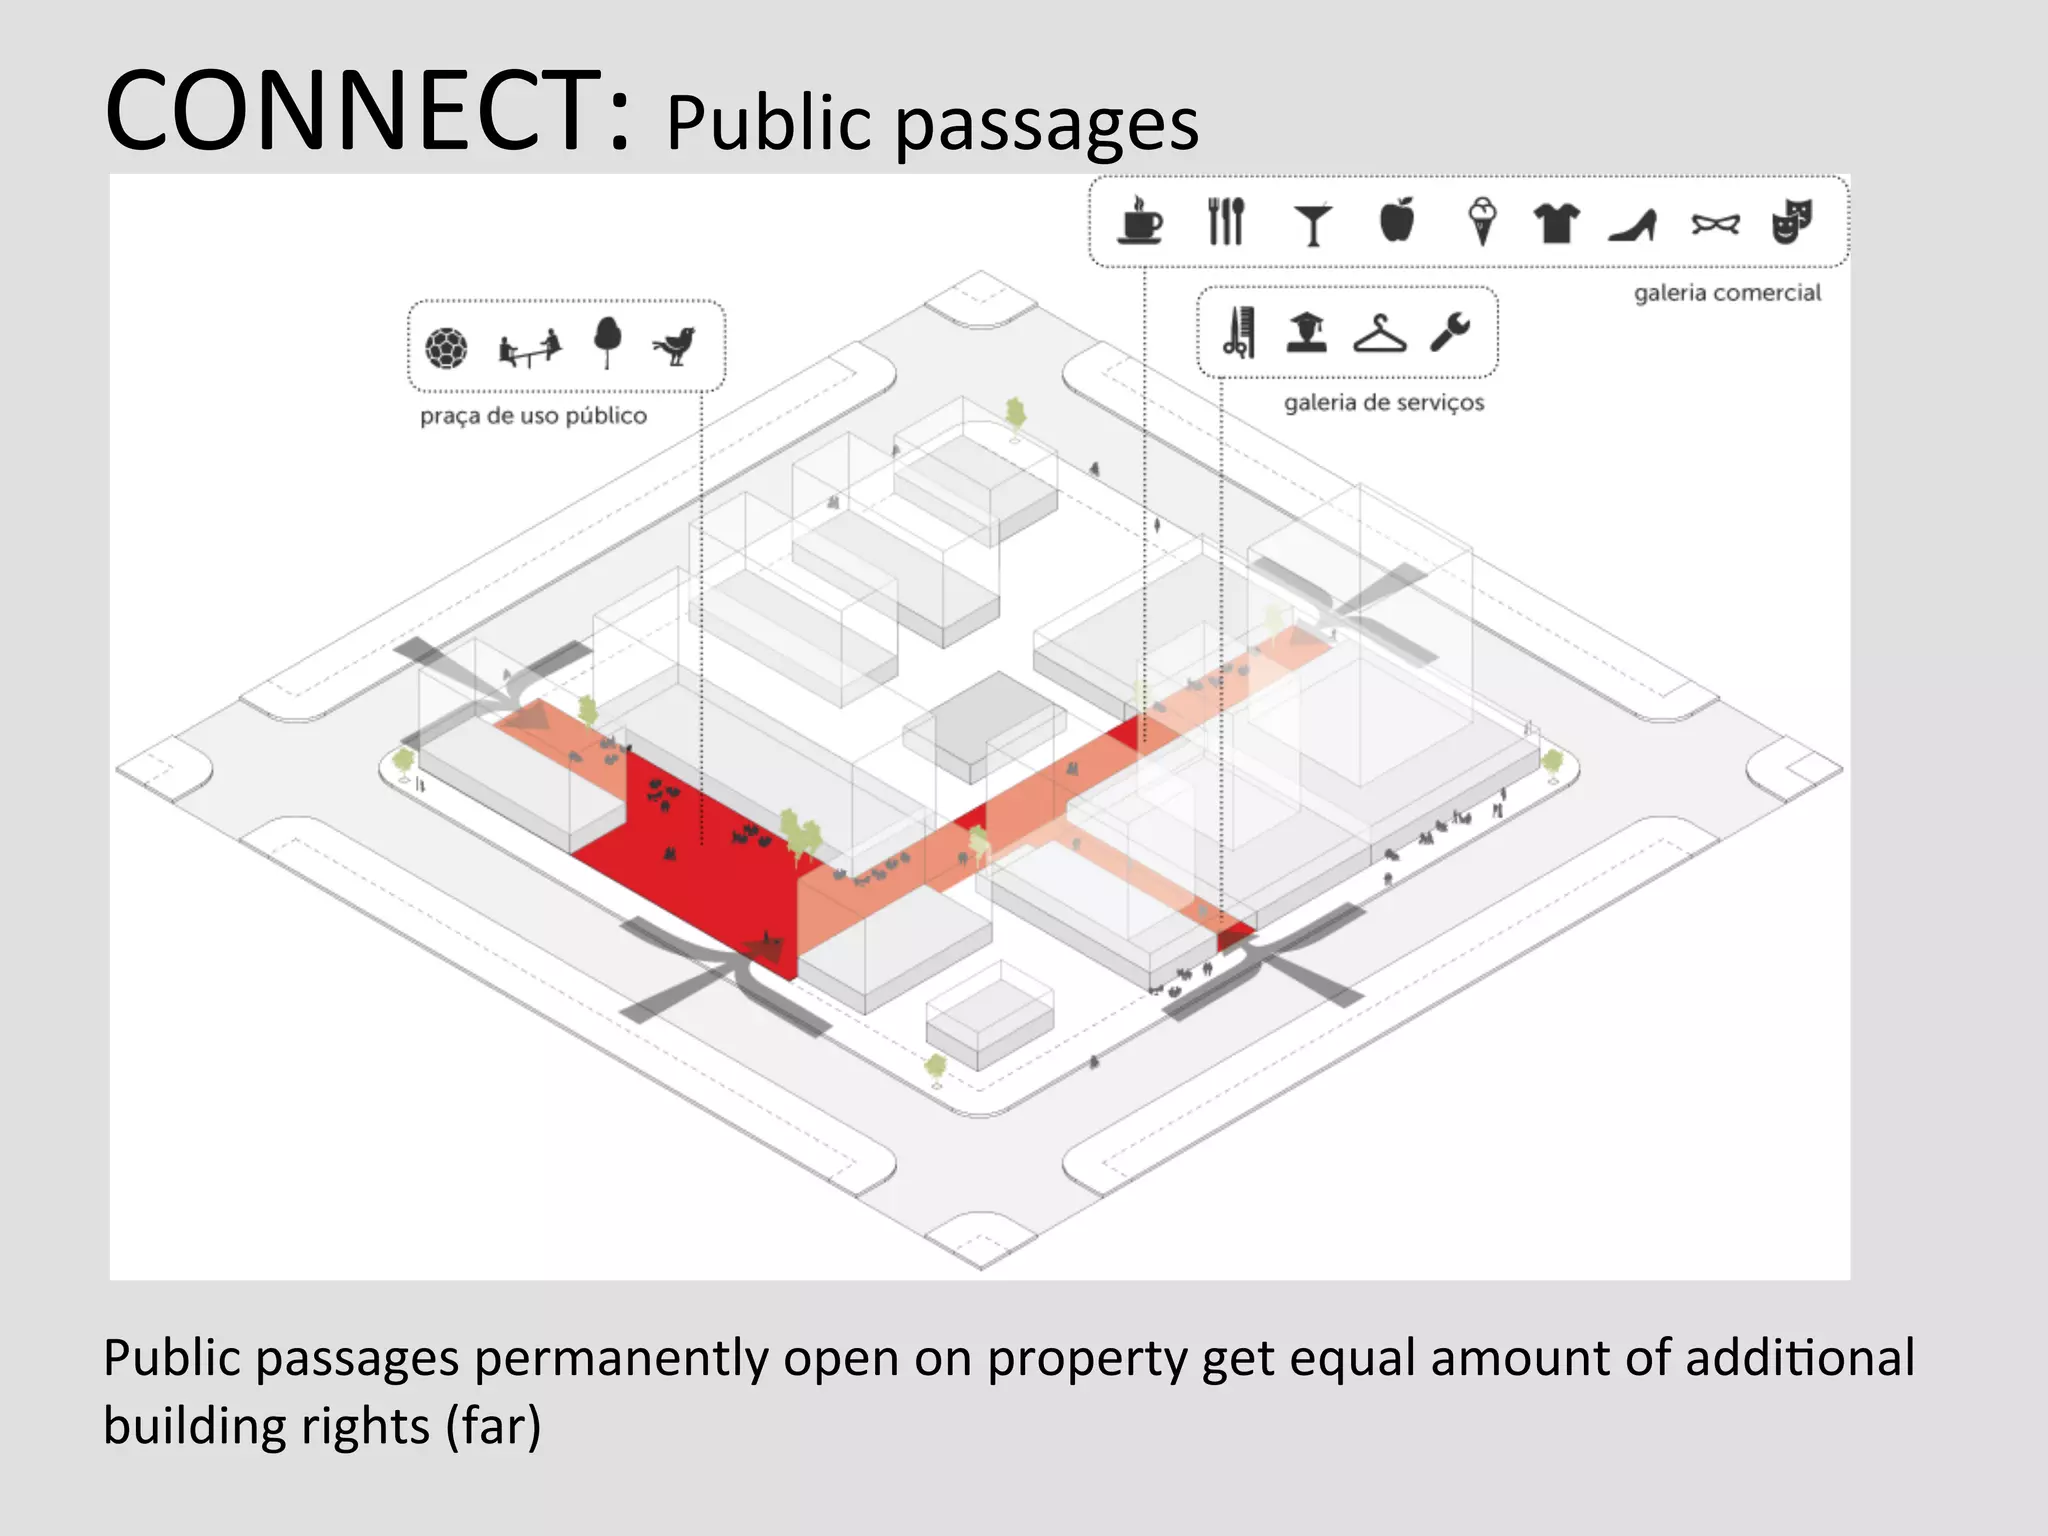
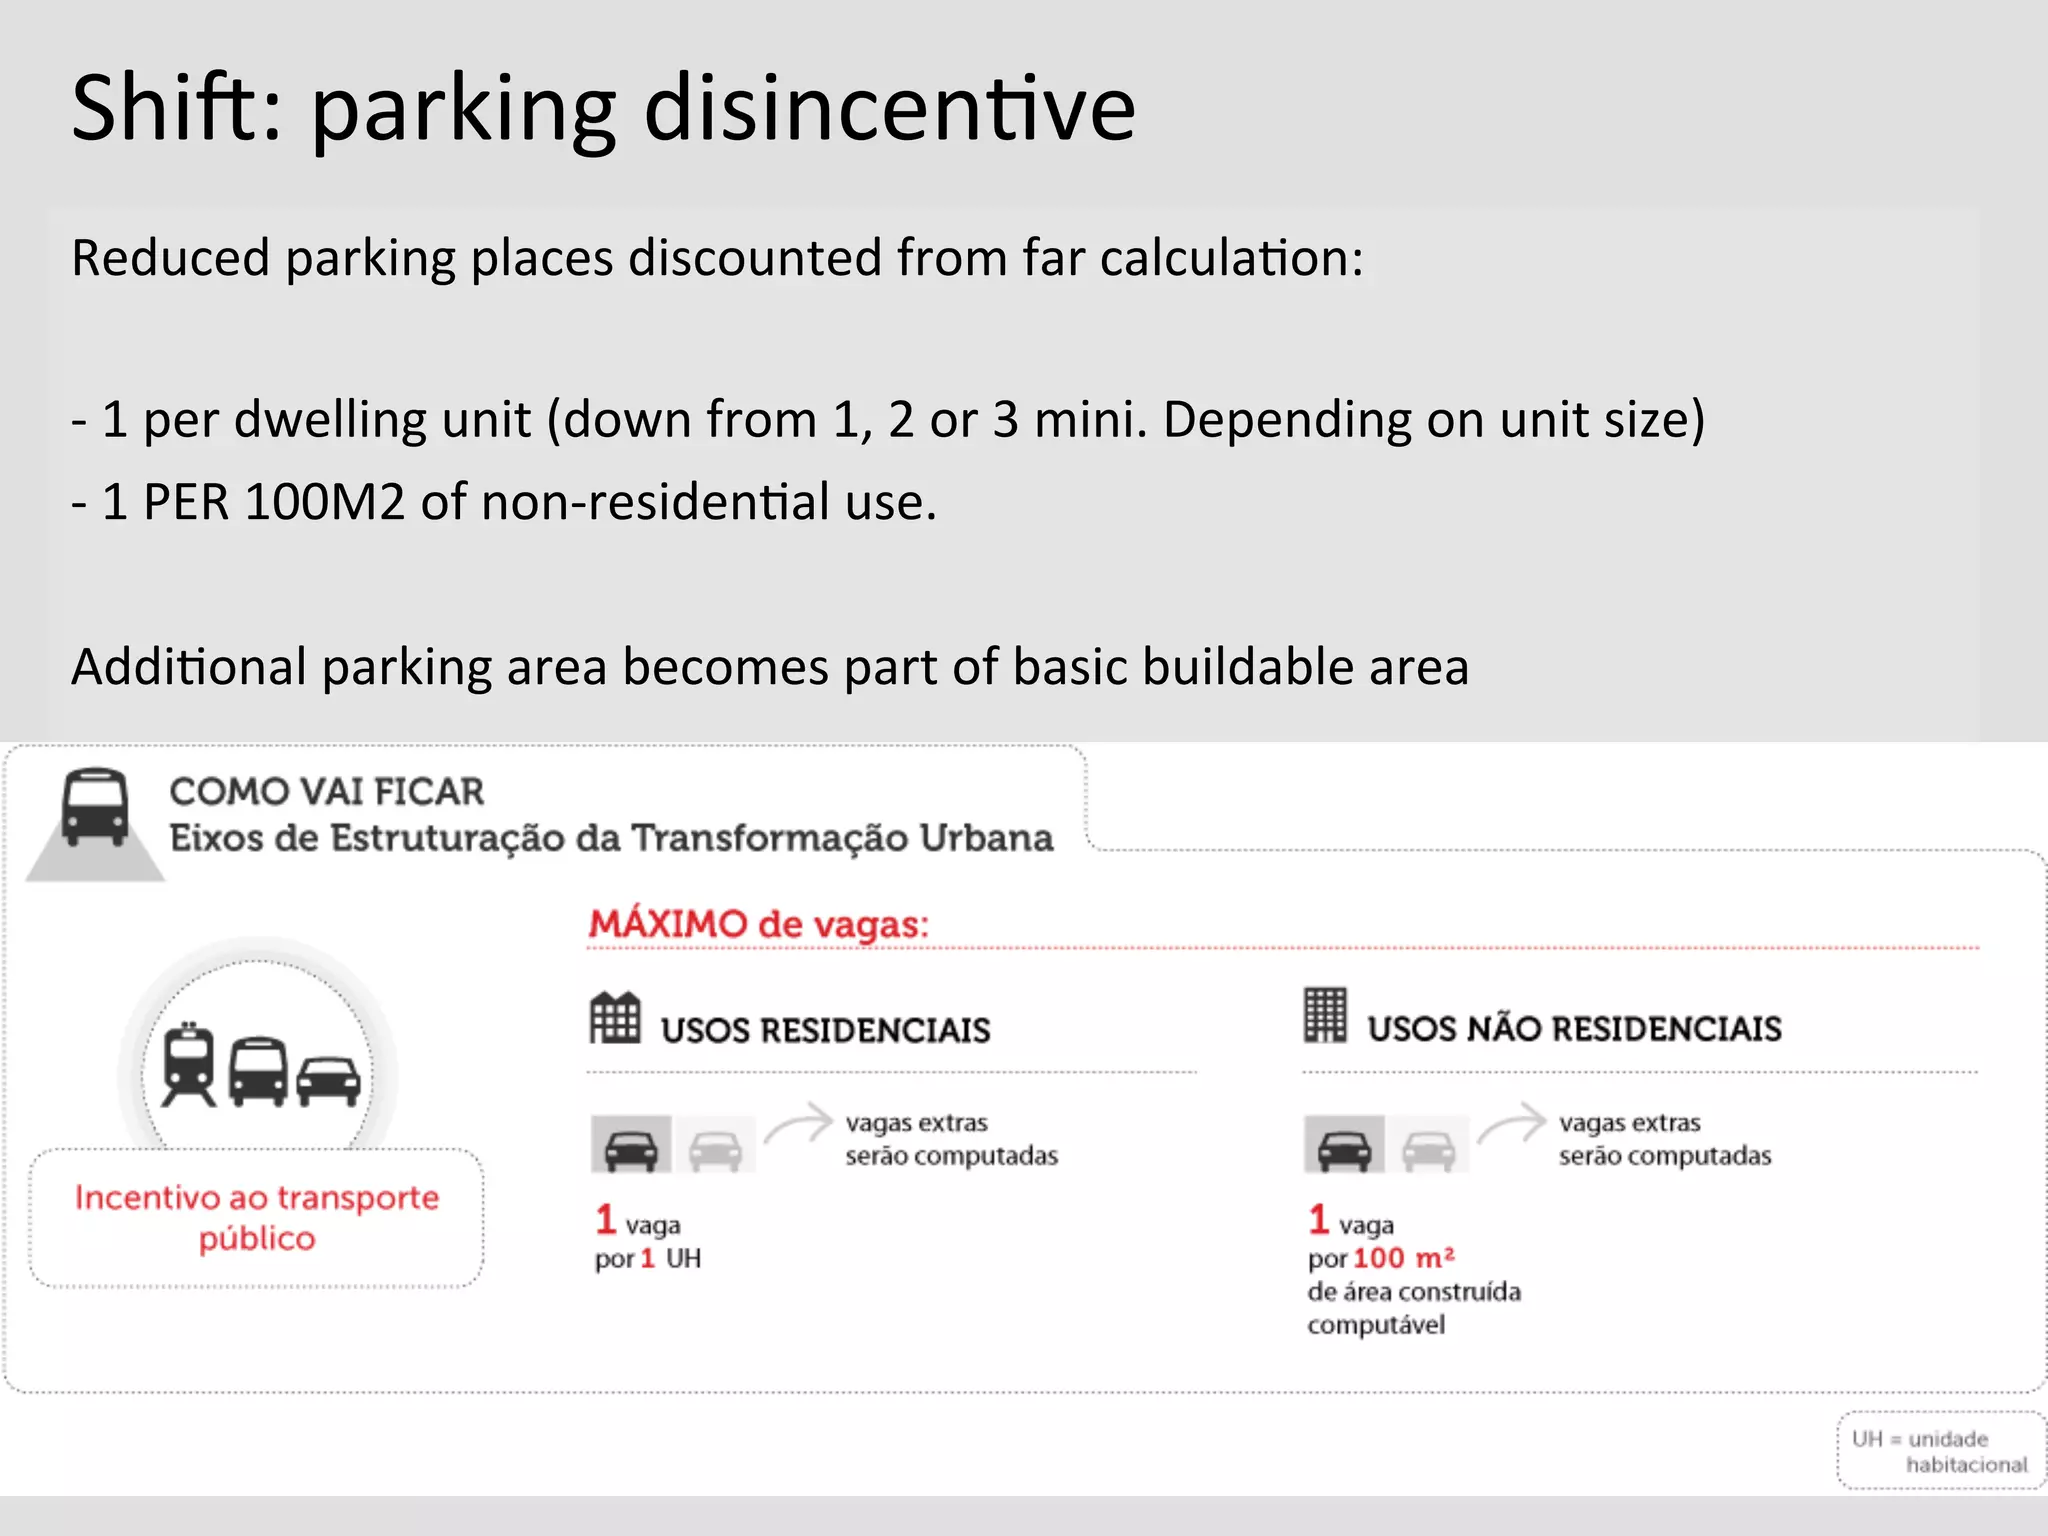
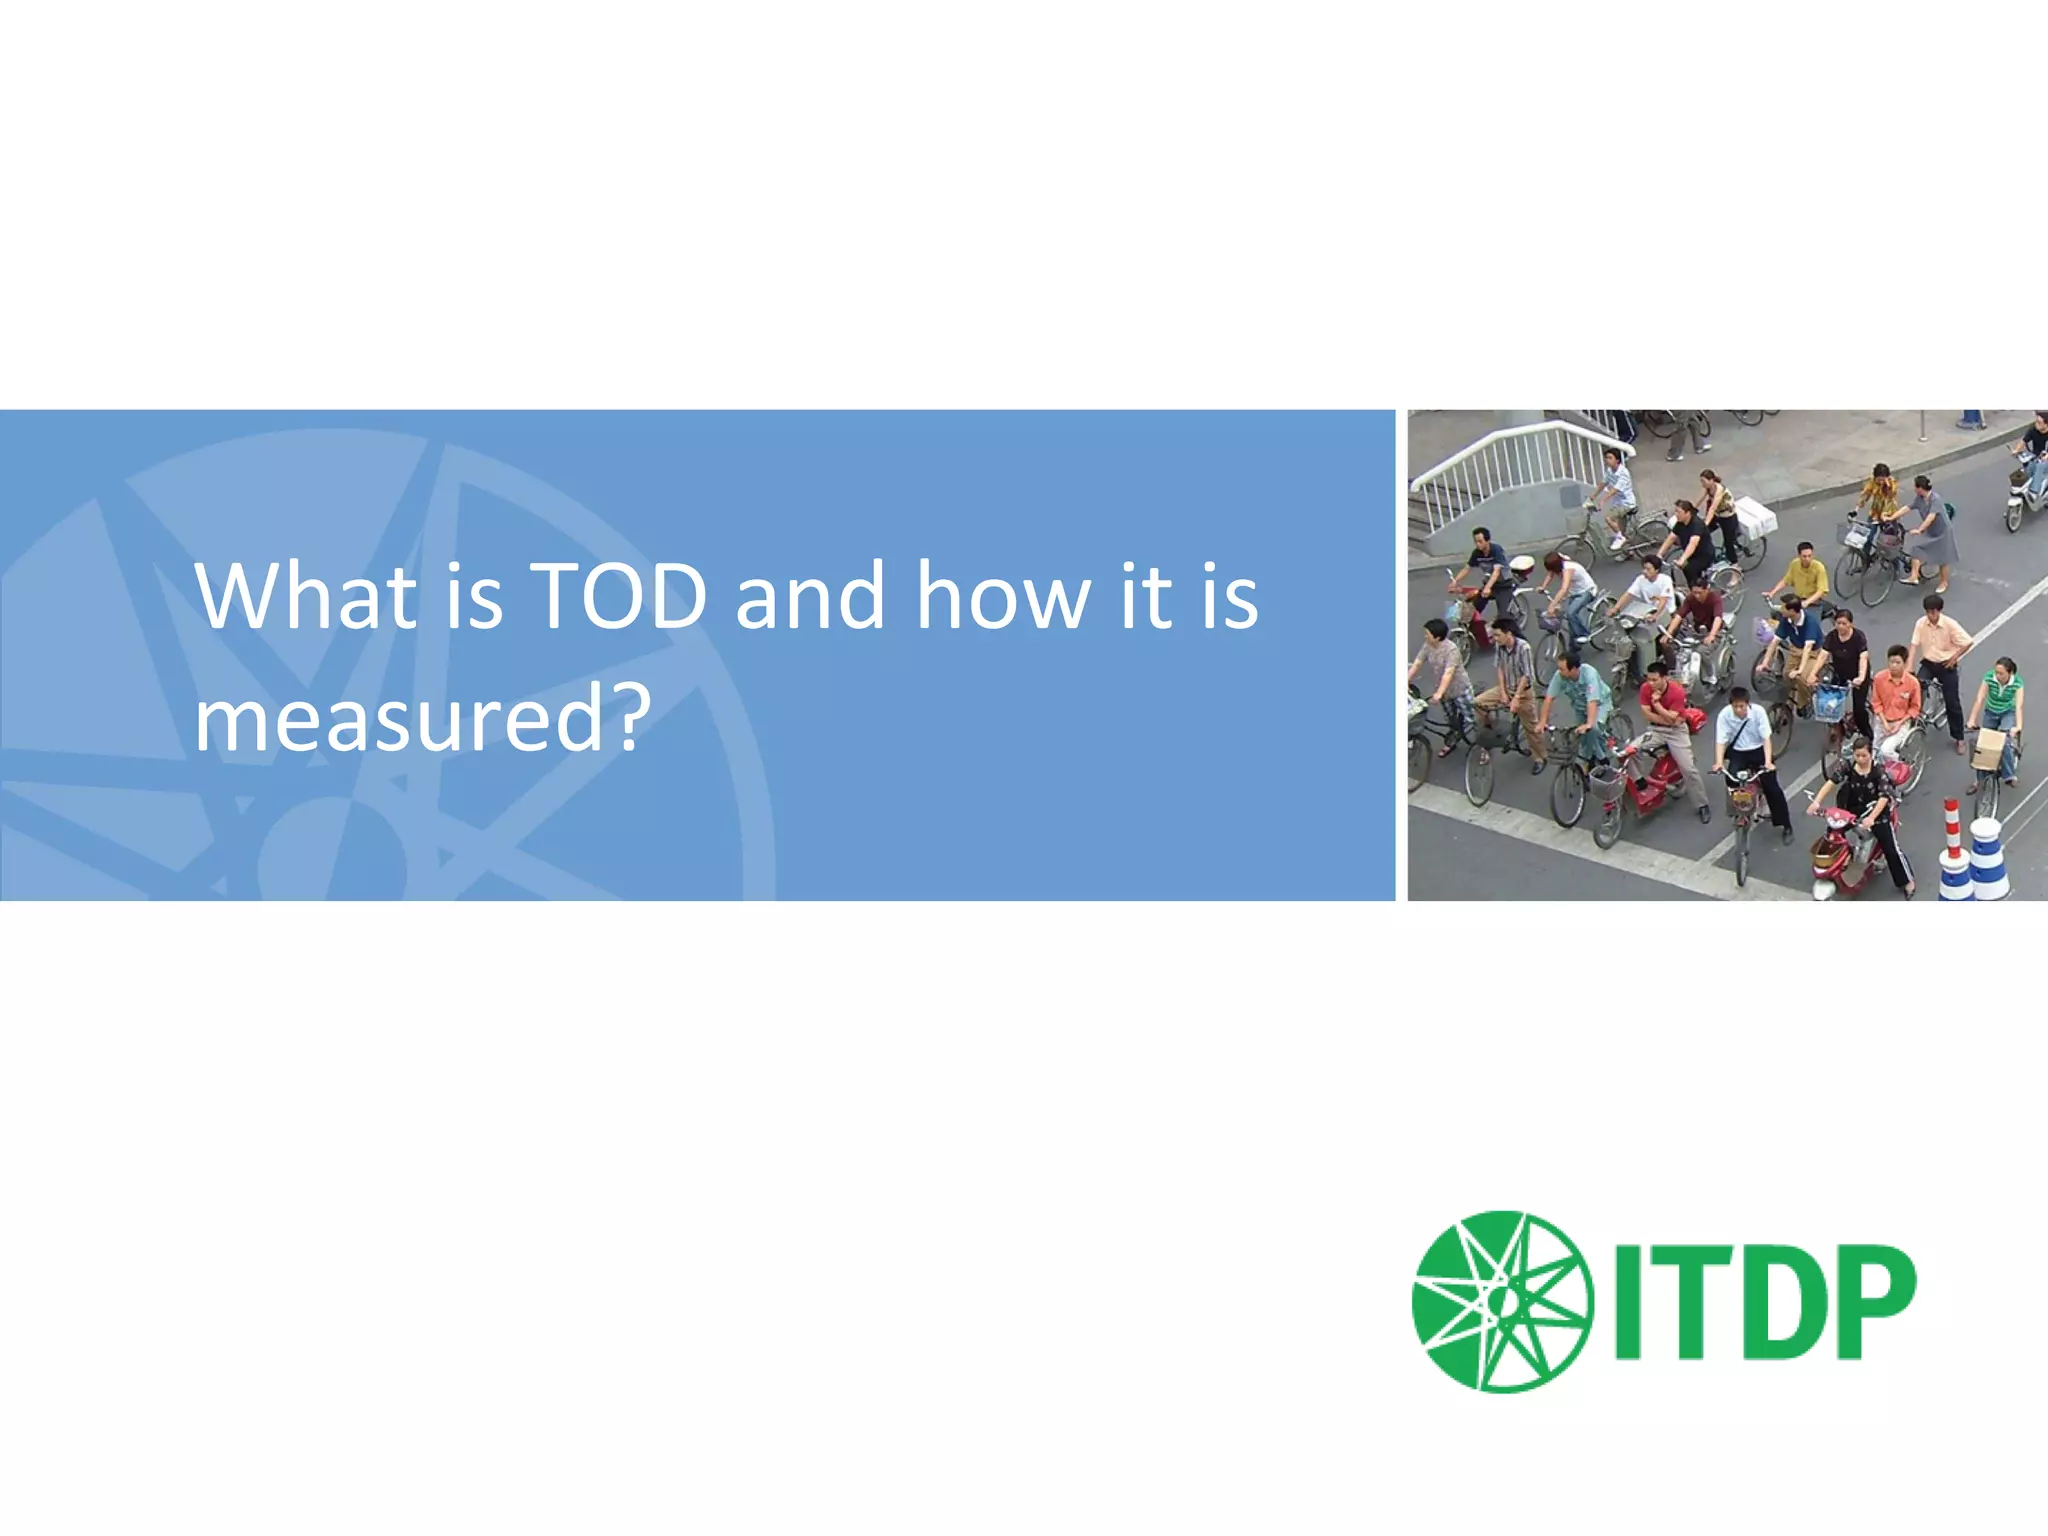


This document summarizes a presentation given at the 5th GIB Summit in May 2015 on the role of the public and private sectors in transit-oriented development. The presentation discusses how compact, mixed-use, transit-oriented development can help reduce transportation costs and emissions while improving economic growth by reducing infrastructure costs and encouraging more sustainable transportation options like walking, cycling, and public transit over private vehicle use.