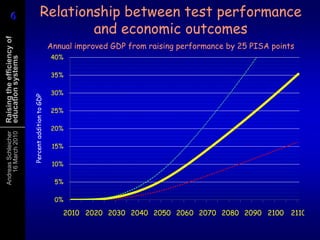
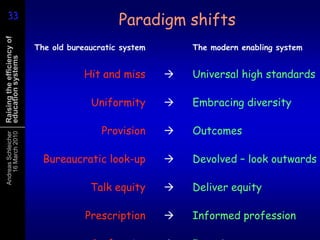
Raising the efficiency of educational servicesThe Hague, 16 March 2010Andreas SchleicherEducation Policy Advisor of the OECD Secretary-General
Changes in the number of students as well as changes in expenditure on educational institutions per studentprimary to secondary education (1995,2004)Index of change between 1995 and 2004 (1995=100, 2004 constant prices)Index of change (1995=100)B1.7a
Latin America then…Hanushek 2009
Latin America then and now…Hanushek 2009
Latin America then and now…Why quality is the keyHanushek 2009
Relationship between test performance and economic outcomesAnnual improved GDP from raising performance by 25 PISA pointsPercent addition to GDP
Catching up with Finland(in percent of GDP)% currrent GDP
Raise everyone to minimum of 400 PISA points% currrent GDP
Increased likelihood of postsec. particip. at age 19/21 associated with PISA reading proficiency at age 15 (Canada)after accounting for school engagement, gender, mother tongue, place of residence, parental, education and family income (reference group PISA Level 1)Odds ratioCollege entrySchool marks at age 15PISA performance at age 15
Some conclusionsThe higher economic outcomes that improved student performance entails dwarf the dimensions of economic cyclesEven if the estimated impacts of skills were twice as large as the true underlying causal impact on growth, the resulting present value of successful school reform still far exceeds any conceivable costs of improvement.
OECD’s PISA assessment of the knowledge and skills of 15-year-oldsCoverage of world economy83%77%81%85%86%87%
High science performanceAverage performanceof 15-year-olds in science – extrapolate and apply… 18 countries perform below this lineLow science performance
Money matters - but other things do tooQuestion:If better education results in more money, Does more money result in better education?
Student performancePISA Index of socio-economic backgroundAdvantageDisadvantageSchool performance and socio-economic background The NetherlandsStudent performance and students’ socio-economic background within schoolsSchool performance and schools’ socio-economic backgroundStudent performance and students’ socio-economic backgroundSchools proportional to size
OutputOutput inefficiencyInput inefficiencyInput
DEA estimates of technical efficiency at the school level1B. Output oriented efficiency1.  DEA performed with four inputs (teaching and computing resources, social-economic status of students and language background) and one output (average PISA score).
DEA estimates of cost efficiency at the national level1B. Output oriented efficiency1.  DEA performed with two inputs (cumulative expenditure per pupils and pupils’ socio-economic background) and one output (average PISA score).2.  Data for these countries concern public institutions only.
High science performanceAverage performanceof 15-year-olds in science – extrapolate and apply… 18 countries perform below this lineLow science performance
Spending choices on secondary schoolsContribution of various factors to upper secondary teacher compensation costsper student as a percentage of GDP per capita (2004)Percentage points
High ambitions and universal standardsRigor, focus and coherenceGreat systems attract great teachers and provide  access to best practice and quality professional development
Challenge and supportStrong supportPoor performanceImprovements idiosyncraticStrong performanceSystemic improvementLowchallengeHighchallengePoor performanceStagnationConflictDemoralisationWeak support
International Best PracticeThe pastPrincipals who are trained, empowered, accountable and provide instructional leadership
Principals who manage ‘a building’, who have little training and preparation and are accountable but not empowered
Attracting, recruiting and providing excellent training for prospective teachers from the top third of the graduate distribution
Attracting and recruiting teachers from the bottom third of the graduate distribution and offering training which does not relate to real classrooms
Incentives, rules and funding encourage a fair distribution of teaching talent
The best teachers are in the most advantaged communitiesHuman capital
International Best PracticeThe pastExpectations of teachers are clear; consistent quality, strong professional ethic and excellent professional development focused on classroom practice
Seniority and tenure matter more than performance; patchy professional development; wide variation in quality
Teachers and the system expect every child to succeed and intervene preventatively to ensure this
Wide achievement gaps, just beginning to narrow but systemic and professional barriers to transformation remain in placeHuman capital (cont…)

Improving the efficiency in education

  • 1.
    Raising the efficiencyof educational servicesThe Hague, 16 March 2010Andreas SchleicherEducation Policy Advisor of the OECD Secretary-General
  • 2.
    Changes in thenumber of students as well as changes in expenditure on educational institutions per studentprimary to secondary education (1995,2004)Index of change between 1995 and 2004 (1995=100, 2004 constant prices)Index of change (1995=100)B1.7a
  • 3.
  • 4.
    Latin America thenand now…Hanushek 2009
  • 5.
    Latin America thenand now…Why quality is the keyHanushek 2009
  • 6.
    Relationship between testperformance and economic outcomesAnnual improved GDP from raising performance by 25 PISA pointsPercent addition to GDP
  • 7.
    Catching up withFinland(in percent of GDP)% currrent GDP
  • 8.
    Raise everyone tominimum of 400 PISA points% currrent GDP
  • 9.
    Increased likelihood ofpostsec. particip. at age 19/21 associated with PISA reading proficiency at age 15 (Canada)after accounting for school engagement, gender, mother tongue, place of residence, parental, education and family income (reference group PISA Level 1)Odds ratioCollege entrySchool marks at age 15PISA performance at age 15
  • 10.
    Some conclusionsThe highereconomic outcomes that improved student performance entails dwarf the dimensions of economic cyclesEven if the estimated impacts of skills were twice as large as the true underlying causal impact on growth, the resulting present value of successful school reform still far exceeds any conceivable costs of improvement.
  • 11.
    OECD’s PISA assessmentof the knowledge and skills of 15-year-oldsCoverage of world economy83%77%81%85%86%87%
  • 12.
    High science performanceAverageperformanceof 15-year-olds in science – extrapolate and apply… 18 countries perform below this lineLow science performance
  • 13.
    Money matters -but other things do tooQuestion:If better education results in more money, Does more money result in better education?
  • 14.
    Student performancePISA Indexof socio-economic backgroundAdvantageDisadvantageSchool performance and socio-economic background The NetherlandsStudent performance and students’ socio-economic background within schoolsSchool performance and schools’ socio-economic backgroundStudent performance and students’ socio-economic backgroundSchools proportional to size
  • 15.
  • 16.
    DEA estimates oftechnical efficiency at the school level1B. Output oriented efficiency1. DEA performed with four inputs (teaching and computing resources, social-economic status of students and language background) and one output (average PISA score).
  • 17.
    DEA estimates ofcost efficiency at the national level1B. Output oriented efficiency1. DEA performed with two inputs (cumulative expenditure per pupils and pupils’ socio-economic background) and one output (average PISA score).2. Data for these countries concern public institutions only.
  • 18.
    High science performanceAverageperformanceof 15-year-olds in science – extrapolate and apply… 18 countries perform below this lineLow science performance
  • 19.
    Spending choices onsecondary schoolsContribution of various factors to upper secondary teacher compensation costsper student as a percentage of GDP per capita (2004)Percentage points
  • 20.
    High ambitions anduniversal standardsRigor, focus and coherenceGreat systems attract great teachers and provide access to best practice and quality professional development
  • 21.
    Challenge and supportStrongsupportPoor performanceImprovements idiosyncraticStrong performanceSystemic improvementLowchallengeHighchallengePoor performanceStagnationConflictDemoralisationWeak support
  • 22.
    International Best PracticeThepastPrincipals who are trained, empowered, accountable and provide instructional leadership
  • 23.
    Principals who manage‘a building’, who have little training and preparation and are accountable but not empowered
  • 24.
    Attracting, recruiting andproviding excellent training for prospective teachers from the top third of the graduate distribution
  • 25.
    Attracting and recruitingteachers from the bottom third of the graduate distribution and offering training which does not relate to real classrooms
  • 26.
    Incentives, rules andfunding encourage a fair distribution of teaching talent
  • 27.
    The best teachersare in the most advantaged communitiesHuman capital
  • 28.
    International Best PracticeThepastExpectations of teachers are clear; consistent quality, strong professional ethic and excellent professional development focused on classroom practice
  • 29.
    Seniority and tenurematter more than performance; patchy professional development; wide variation in quality
  • 30.
    Teachers and thesystem expect every child to succeed and intervene preventatively to ensure this
  • 31.
    Wide achievement gaps,just beginning to narrow but systemic and professional barriers to transformation remain in placeHuman capital (cont…)

Editor's Notes

  • #4 Let us go back to the 1960s. The chart shows you the wealth of world regions and the average years of schooling in these regions, which is the most traditional measure of human capital. Have a look at Latin America, it ranked third in wealth and third in years of schooling, so in the 1960s the world seemed pretty much in order.
  • #5 But when you look at economic growth between 1960 and 2000, you see that something went wrong. Despite the fact that Latin America did well in terms of years of schooling, only Sub-Saharan Africa did worse in terms of economic growth. So in 2000, Latin America had fallen back considerably in terms of GDP per capita.You can draw two conclusions from this: Either education is not as important for economic growth as we thought, or we have for a long time been measuring the wrong thing.
  • #6 Now let me add one additional element, and that is a measure of the quality of education, in the form of the score of the different world regions on international tests like PISA or TIMSS. And you see now that the world looks in order again, there seems a close relationship between test scores and economic growth. You can see that even more clearly when you put this into graphical form. This is one of the charts produced by Professor Hanushek. And, as Professor Hanushek will explain, the relationship holds even when you account for other factors, it even holds when you compare growth in economies with growth in learning outcomes, which is the closest we can come to examining causality.So what this tells you is that it is not simply years of schooling or the number of graduates we produce, but indeed the quality of learning outcomes that counts.
  • #10 The best way to find out whether what students have learned at school matters for their life is to actuallywatch what happens to them after they leave school. This is exactly what we have done that with around 30,000 students in Canada. We tested them in the year 2000 when they were 15 years old in reading, math and science, and since then we are following up with them each year on what choices they make and how successful they are in their transition from school to higher education and work.The horizontal axis shows you the PISA level which 15-year-old Canadians had scored in 2000. Level 2 is the baseline level on the PISA reading test and Level 5 the top level in reading.The red bar shows you how many times more successful someone who scored Level 2 at age 15 was at age 19 to have made a successful transition to university, as compared to someone who did not make it to the baseline PISA level 1. And to ensure that what you see here is not simply a reflection of social background, gender, immigration or school engagement, we have already statistically accounted for all of these factors. The orange bar. …How would you expect the picture to be like at age 21? We are talking about test scores here, but for a moment, lets go back to the judgements schools make on young people, for example through school marks. You can do the same thing here, you can see how well school marks at age 15 predict the subsequent success of youths. You see that there is some relationship as well, but that it is much less pronounced than when we use the direct measure of skills.
  • #11 At the OECD, we are measuring skills, with a focus on those non-routing cognitive skills, regularly through our PISA programme, now the most comprehensive international assessment of the quality of education. Every three years, we test roughly half a million of children in OECD countries in key competencies, and that’s not simply about checking whether students have learned what they were recently taught, but we examine to what extent students can extrapolate from what they have learned and apply their knowledge and skills in novel settings. Here you see the countries which we can compare, and how the set of countries being compared has expanded.