Improving operations with predictive maintenance
•
2 likes•1,120 views

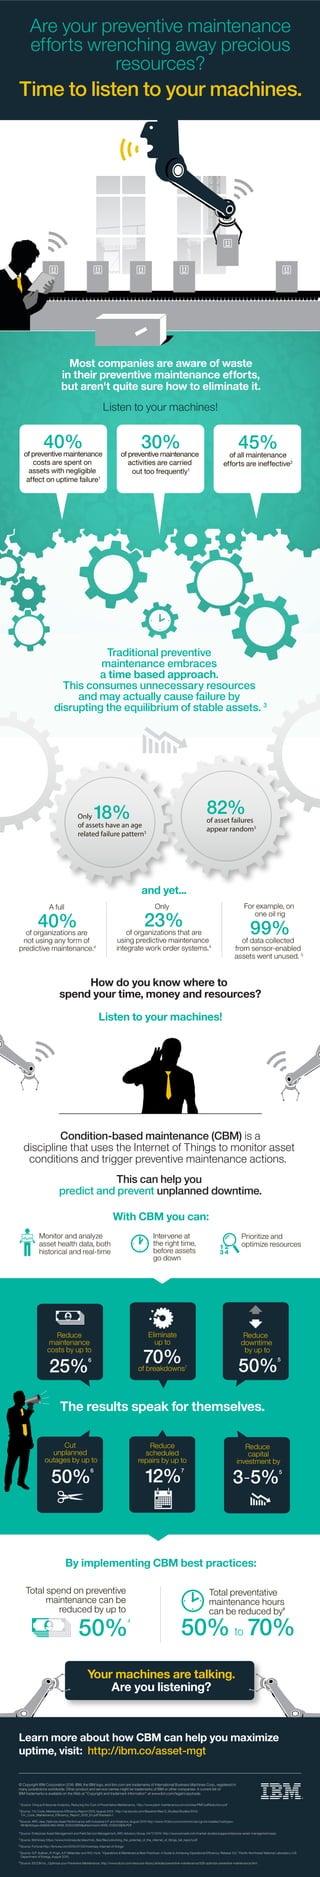
Condition-based maintenance (CBM) uses the Internet of Things to monitor asset conditions and trigger preventive maintenance actions, which can help you predict and prevent unplanned downtime. Find out more at: http://ibm.co/asset-mgmt
Report
Share
Report
Share
Download to read offline
Recommended
Root Cause Analysis By Deepak
ABOUT THE TRAINING PROGRAM :-
Root cause analysis (RCA) is a class of problem solving methods aimed at identifying the root causes of problems or events. The practice of RCA is predicated on the belief that problems are best solved by attempting to address, correct or eliminate root causes, as opposed to merely addressing the immediately obvious symptoms. By directing corrective measures at root causes, it is more probable that problem recurrence will be prevented.
DESIGNED FOR :-
Managers, Engineers, Supervisor and officers engaged in maintenance operation and engineering activities.
OBJECTIVE :-
At the end of the training program, participants will be able
- To gain a basic understanding of the problem solving and decision-making process and the applicable quality tools that support this process.
- To develop specific competencies to use the structured approach to problem solving and decision making and the supporting quality tools.
TRAINING PROGRAM COVERAGE :-
- Basic knowledge about RCA program.
- What are the RCA tools ?
- More about Why- Why analysis ?
- Videos and case studies on RCA
Quality Tools
This document introduces seven quality tools that can help with data collection and analysis: flowcharts, check sheets, histograms, Pareto diagrams, cause-and-effect diagrams, scatter diagrams, and control charts. Each tool is briefly described and its benefits are listed. Flowcharts map out process steps to improve understanding. Check sheets create easy-to-interpret data. Histograms show data distributions and capabilities. Pareto diagrams identify the most impactful causes. Cause-and-effect diagrams organize variable relationships. Scatter diagrams test relationships. And control charts monitor process performance over time.
Fmea alignment aiag_and_vda_-_eng
The document discusses efforts to align the Failure Mode and Effects Analysis (FMEA) methods of the German VDA and American AIAG standards. A working group with representatives from automakers and suppliers met over several years to harmonize differences in how the VDA and AIAG FMEA manuals evaluate potential failures. The group standardized criteria for severity, occurrence, and detection ratings and developed common approaches for design and process FMEAs. The ultimate goal is to create a single, global FMEA process that satisfies customers in both Europe and North America.
FMEA
This document provides an overview of Failure Mode and Effects Analysis (FMEA). FMEA is a systematic method to identify and prevent potential failures before production. It involves identifying all possible failures, their causes and effects. Teams then evaluate the severity, occurrence, and detection of each failure and prioritize issues to address based on their risk priority number. The document outlines the FMEA process and how to develop one to proactively address potential product and process failures.
Reliability
This is a presentation to the top management as to why reliability is important and what is the difference between a maintenance engineer and a reliability engineer.
FMEA Introduction.ppt
The document discusses Failure Mode and Effects Analysis (FMEA), a systematic method for evaluating potential failures in design, manufacturing, and production processes. It was originally developed in the 1940s for the military and is now commonly used in various industries. An FMEA involves analyzing how and how often a process might fail and classifying the failures by severity, occurrence, and detection. The analysis helps prioritize risks and identify actions needed to prevent failures.
7 qc tools
1. The document discusses 7 quantitative quality control tools and techniques for decision making: checksheets, Pareto charts, cause-and-effect diagrams, scatter diagrams, histograms, control charts, and stratification.
2. It provides examples and explanations of how each tool is used, such as using checksheets to track defects over time, Pareto charts to identify the most common issues, and scatter diagrams to analyze relationships between variables.
3. The tools help identify sources of variation, recognize changes in processes, and determine if quality improvements are effective. Strategic use of these techniques aids in problem diagnosis and driving processes toward statistical control.
Healthcare And Project Management 1
The document discusses best practices for healthcare project management. It outlines a typical project management plan consisting of four phases (P0-P3): project initiation, project planning, project execution, and project closure. Each phase has key tasks and mandatory/recommended documentation. Challenges are analyzed for each phase regarding technology, organization, timing and finances. Change management and six sigma approaches are also summarized. The overall goal is to ensure project success by meeting objectives, timelines and budgets through professional planning and management.
7 qc tools
The document discusses the 7 main quality control tools: check sheet, cause-and-effect diagram, flow chart, Pareto chart, control chart, scatter diagram, and histogram. It provides details on the purpose and use of each tool, such as using check sheets to collect real-time data, cause-and-effect diagrams to identify causes of problems, and control charts to monitor process variation over time. Overall, the 7 tools help analyze data, identify root causes of issues, measure results, and solve 95% of quality problems through techniques like data collection, visualization of processes and variables, and prioritization of key issues.
Maintenance_6.pdf
This document discusses various maintenance strategies and methods for power systems. It defines maintenance strategies as management methods used to achieve maintenance objectives like availability, cost reduction, and safety. Maintenance methods discussed include corrective, preventive, condition-based, scheduled overhauls, opportunity-based, total productive maintenance (TPM), reliability-centered maintenance (RCM), and risk-based maintenance. TPM focuses on continuous improvement through employee engagement. RCM was developed to focus on system functionality rather than individual equipment and identify equipment malfunctions that could cause system failure.
Root Cause Analysis (RCA) Tools
This document provides an overview of root cause analysis (RCA) and common RCA tools. It discusses the CPAR/SCPAR process for documenting problems, determining root causes, and implementing corrective actions. Three common RCA tools are described: 5 Why's analysis involves repeatedly asking why to drill down to the root cause; affinity diagrams group related causes to identify major causes; and fishbone diagrams illustrate the relationship between causes and effects. The document encourages using the appropriate tool based on the problem complexity and provides examples of applying each tool.
Advanced Pfmea
The document provides an overview of Failure Mode and Effects Analysis (FMEA) as a tool to identify, analyze, and prevent potential product and process failures. It discusses the history and definitions of FMEA, the different types of FMEAs (system, design, process), how to conduct an FMEA including forming a team, terminology, scoring, and developing action plans to address high risks.
Reliability engineering ppt-Internship
Authors: (i) Prashanth Lakshmi Narasimhan,
(ii) Mukesh Ravichandran
Industry: Automobile -Auto Ancillary Equipment ( Turbocharger)
This was presented after the completion of our 2 months internship at Turbo Energy Limited during our 3rd Year Summer holidays (2013)
Root cause analysis - tools and process
The document provides an overview of root cause analysis (RCA) tools and processes. It defines RCA as a systematic process for identifying the root causes of problems in order to prevent recurrence. The document outlines the key concepts, types of causes, common tools like fishbone diagrams and 5 whys, and a 5-step DMAIC process for conducting RCA including defining the problem, measuring its scope, analyzing root causes, implementing solutions, and controlling effectiveness. The goal of RCA is to develop sustainable solutions by understanding underlying causes rather than just addressing symptoms.
Fisbone Diagrams Assgnmnt1
1. Fishbone diagrams (also called Ishikawa or cause-and-effect diagrams) are a visual tool for identifying potential causes of problems or effects.
2. They resemble a fish skeleton and are used to structure a team's brainstorming to generate possible causes for quality issues or other problems in products, processes, or services.
3. The creation of fishbone diagrams involves identifying the main problem or effect, major causes, secondary causes, and relationships between causes to understand root causes and facilitate problem-solving.
Root Cause Analysis ( RCA )
Root Cause Analysis (RCA) is a structured technique used to identify the underlying cause of problems. It involves defining the problem, finding the cause, and charting a solution. The process typically includes determining what happened, why it happened, and what can be done to prevent reoccurrence. RCA aims to address the real cause of problems rather than just the symptoms. One common technique in RCA is the "5 Whys" method, which involves repeatedly asking "Why?" until the root cause is identified. RCA benefits organizations by helping improve processes, create lasting solutions, and develop a roadmap for thorough understanding. However, its limitations include assuming a single source of problems when in reality issues can have multiple interconnected causes.
Materi FMECA.pdf
This document provides an overview of failure modes and effects analysis (FMECA). It defines FMECA and discusses its purposes and procedures. FMECA is a technique used to identify, prioritize, and eliminate potential failures before they occur. The document outlines the typical steps in a FMECA, which include preparing worksheets, analyzing failure modes and effects, ranking risks, and identifying corrective actions. It also discusses FMECA standards and the two main approaches of bottom-up and top-down analysis.
Lean Daily Visual ManagementSystem(LDVMS)
This document provides an overview of the Lean Daily Visual Management System (LDVMS). The summary is:
The LDVMS is designed to continually decrease waste and increase quality, capacity, and worker involvement through extensive real-time measurement of key processes. It has five primary components: daily start-up meetings, driver measure boards, kaizen action sheets, short interval coaching on micro-process metrics, and 20 Keys assessments. These components work together to visually track goals and problems to drive continuous improvement.
FMEA Presentation V1.1
The document summarizes an FMEA (Failure Mode and Effects Analysis) performed on a water system to improve reliability and reduce costs. Key points:
- An FMEA was conducted on the Pine Creek Canyon DWID water system in Arizona to identify failures, effects, and improvement actions.
- The FMEA addressed subsystems like electrical, water storage, treatment and distribution. It identified actions to check generator fuel levels, inspect water tanks, install alarms and establish maintenance procedures.
- The FMEA process involves describing the system, identifying potential failures and effects, current controls, risk analysis by rating severity, occurrence and detection probabilities, and calculating a risk priority number.
MAINTENANCE POLICIES – PREVENTIVE MAINTENANCE
Maintenance categories – Comparative merits of each category – Preventive maintenance, maintenance schedules, repair cycle - Principles and methods of lubrication – TPM
Equipment reliability l1
This document provides an overview of equipment reliability training at different levels. It discusses measuring and improving equipment performance through metrics like Overall Equipment Effectiveness (OEE) and Total Effective Equipment Performance (TEEP). The training introduces reliability concepts and processes to apply reliability tools and methods. It aims to change culture from reacting to failures to preventing failures through early reliability considerations in equipment design, purchasing, and maintenance.
Examen mir-2015
The document discusses the benefits of exercise for mental health. Regular physical activity can help reduce anxiety and depression and improve mood and cognitive functioning. Exercise causes chemical changes in the brain that may help alleviate symptoms of mental illness and boost overall mental well-being.
Root cause analysis
The document provides an overview of root cause analysis. It defines root cause analysis as a method used to address problems by identifying their underlying root causes in order to correct or eliminate the cause and prevent recurrence. It describes traditional applications, objectives of training, definitions of root cause and approaches. Key steps in root cause analysis are identified as understanding the meaning of root cause, identifying the steps to find the root cause of problems, and using tools like fishbone diagrams, 5 whys, and asking questions.
DESIGN FMEA TRAINING FOR LITENS AUTOMOTIVE
This document outlines a training for Litens Automotive on Design Failure Mode and Effects Analysis (DFMEA). The training covers DFMEA basics, consequences of poorly performed DFMEAs, identifying single points of failure, using design of experiments to optimize designs, and reviewing DFMEA examples. It emphasizes that critical dimensions must be derived from the DFMEA and that DFMEAs are important legal documents that demonstrate due diligence in design and product safety.
Fish Bone
Fishbone diagrams, also known as Ishikawa diagrams or cause-and-effect diagrams, are a visual tool for organizing potential causes for a specific problem or effect. They help identify root causes by sorting possible causes into categories such as methods, materials, machines, people, measurements, and environment. To create a fishbone diagram, the problem is written at the head and main categories of causes are listed as bones extending from the head. Potential specific causes are then listed branching off from each category bone. The diagram can identify root causes and areas for further investigation through a visual representation of the interrelationships between various causes and effects.
Human Error Prevention
How can we prevent accidents caused by human error? This presentation deals with typical examples of severe accidents related to human errors, and shows methods to prevent them.
7 qc tools training material[1]
The document provides an overview of 7 quality control tools: Pareto diagram, stratification, scatter diagram, cause and effect diagram, histogram, check sheet, and control chart/graph. It describes each tool, including what they are, when they are used, and the typical results obtained from each tool. The tools are used to collect and analyze data, identify root causes, measure results, and help solve problems in quality control.
Control phase lean six sigma tollgate template
The document outlines the control phase tools and activities in a Lean Six Sigma project. It includes reviewing project documentation and metrics, developing standard operating procedures and controls, implementing and monitoring the solution, confirming goals are met, identifying opportunities for replication, and transitioning the project to the process owner. Key steps are developing a control plan to monitor processes and respond to variation, updating failure modes and effects analysis, and communicating project results and benefits.
10 innovative ways the Crystal building is using IoT
The crystal building is using IoT in several ways to change the way we view buildings. To find out more: https://www.thecrystal.org/
The New Retail Revolution: Connected Store
Even though e-commerce is driving quick sales growth, brick and mortar is still the major player in retail industry. According to the survey by TimeTrade, 85% of consumers still prefer to shop in-store. And there are more than 20 online retailers have opened physical stores. It's time for retailers to rethink their omnichannel strategies with store transformation.
The Internet of Things is revolutionizing retail store operations. With the connected devices and sensor data, retailers can receive real-time information of both physical and digital worlds. They can use these insights to offer timely and personalized customer services, make better operational decisions, and secure merchandising and supply networks. Learn about how can IoT provides new opportunities and values for retail business and start your IoT journey with The Honeywell Building Sense.
For more information, visit ibm.com/iot/retail
More Related Content
What's hot
7 qc tools
The document discusses the 7 main quality control tools: check sheet, cause-and-effect diagram, flow chart, Pareto chart, control chart, scatter diagram, and histogram. It provides details on the purpose and use of each tool, such as using check sheets to collect real-time data, cause-and-effect diagrams to identify causes of problems, and control charts to monitor process variation over time. Overall, the 7 tools help analyze data, identify root causes of issues, measure results, and solve 95% of quality problems through techniques like data collection, visualization of processes and variables, and prioritization of key issues.
Maintenance_6.pdf
This document discusses various maintenance strategies and methods for power systems. It defines maintenance strategies as management methods used to achieve maintenance objectives like availability, cost reduction, and safety. Maintenance methods discussed include corrective, preventive, condition-based, scheduled overhauls, opportunity-based, total productive maintenance (TPM), reliability-centered maintenance (RCM), and risk-based maintenance. TPM focuses on continuous improvement through employee engagement. RCM was developed to focus on system functionality rather than individual equipment and identify equipment malfunctions that could cause system failure.
Root Cause Analysis (RCA) Tools
This document provides an overview of root cause analysis (RCA) and common RCA tools. It discusses the CPAR/SCPAR process for documenting problems, determining root causes, and implementing corrective actions. Three common RCA tools are described: 5 Why's analysis involves repeatedly asking why to drill down to the root cause; affinity diagrams group related causes to identify major causes; and fishbone diagrams illustrate the relationship between causes and effects. The document encourages using the appropriate tool based on the problem complexity and provides examples of applying each tool.
Advanced Pfmea
The document provides an overview of Failure Mode and Effects Analysis (FMEA) as a tool to identify, analyze, and prevent potential product and process failures. It discusses the history and definitions of FMEA, the different types of FMEAs (system, design, process), how to conduct an FMEA including forming a team, terminology, scoring, and developing action plans to address high risks.
Reliability engineering ppt-Internship
Authors: (i) Prashanth Lakshmi Narasimhan,
(ii) Mukesh Ravichandran
Industry: Automobile -Auto Ancillary Equipment ( Turbocharger)
This was presented after the completion of our 2 months internship at Turbo Energy Limited during our 3rd Year Summer holidays (2013)
Root cause analysis - tools and process
The document provides an overview of root cause analysis (RCA) tools and processes. It defines RCA as a systematic process for identifying the root causes of problems in order to prevent recurrence. The document outlines the key concepts, types of causes, common tools like fishbone diagrams and 5 whys, and a 5-step DMAIC process for conducting RCA including defining the problem, measuring its scope, analyzing root causes, implementing solutions, and controlling effectiveness. The goal of RCA is to develop sustainable solutions by understanding underlying causes rather than just addressing symptoms.
Fisbone Diagrams Assgnmnt1
1. Fishbone diagrams (also called Ishikawa or cause-and-effect diagrams) are a visual tool for identifying potential causes of problems or effects.
2. They resemble a fish skeleton and are used to structure a team's brainstorming to generate possible causes for quality issues or other problems in products, processes, or services.
3. The creation of fishbone diagrams involves identifying the main problem or effect, major causes, secondary causes, and relationships between causes to understand root causes and facilitate problem-solving.
Root Cause Analysis ( RCA )
Root Cause Analysis (RCA) is a structured technique used to identify the underlying cause of problems. It involves defining the problem, finding the cause, and charting a solution. The process typically includes determining what happened, why it happened, and what can be done to prevent reoccurrence. RCA aims to address the real cause of problems rather than just the symptoms. One common technique in RCA is the "5 Whys" method, which involves repeatedly asking "Why?" until the root cause is identified. RCA benefits organizations by helping improve processes, create lasting solutions, and develop a roadmap for thorough understanding. However, its limitations include assuming a single source of problems when in reality issues can have multiple interconnected causes.
Materi FMECA.pdf
This document provides an overview of failure modes and effects analysis (FMECA). It defines FMECA and discusses its purposes and procedures. FMECA is a technique used to identify, prioritize, and eliminate potential failures before they occur. The document outlines the typical steps in a FMECA, which include preparing worksheets, analyzing failure modes and effects, ranking risks, and identifying corrective actions. It also discusses FMECA standards and the two main approaches of bottom-up and top-down analysis.
Lean Daily Visual ManagementSystem(LDVMS)
This document provides an overview of the Lean Daily Visual Management System (LDVMS). The summary is:
The LDVMS is designed to continually decrease waste and increase quality, capacity, and worker involvement through extensive real-time measurement of key processes. It has five primary components: daily start-up meetings, driver measure boards, kaizen action sheets, short interval coaching on micro-process metrics, and 20 Keys assessments. These components work together to visually track goals and problems to drive continuous improvement.
FMEA Presentation V1.1
The document summarizes an FMEA (Failure Mode and Effects Analysis) performed on a water system to improve reliability and reduce costs. Key points:
- An FMEA was conducted on the Pine Creek Canyon DWID water system in Arizona to identify failures, effects, and improvement actions.
- The FMEA addressed subsystems like electrical, water storage, treatment and distribution. It identified actions to check generator fuel levels, inspect water tanks, install alarms and establish maintenance procedures.
- The FMEA process involves describing the system, identifying potential failures and effects, current controls, risk analysis by rating severity, occurrence and detection probabilities, and calculating a risk priority number.
MAINTENANCE POLICIES – PREVENTIVE MAINTENANCE
Maintenance categories – Comparative merits of each category – Preventive maintenance, maintenance schedules, repair cycle - Principles and methods of lubrication – TPM
Equipment reliability l1
This document provides an overview of equipment reliability training at different levels. It discusses measuring and improving equipment performance through metrics like Overall Equipment Effectiveness (OEE) and Total Effective Equipment Performance (TEEP). The training introduces reliability concepts and processes to apply reliability tools and methods. It aims to change culture from reacting to failures to preventing failures through early reliability considerations in equipment design, purchasing, and maintenance.
Examen mir-2015
The document discusses the benefits of exercise for mental health. Regular physical activity can help reduce anxiety and depression and improve mood and cognitive functioning. Exercise causes chemical changes in the brain that may help alleviate symptoms of mental illness and boost overall mental well-being.
Root cause analysis
The document provides an overview of root cause analysis. It defines root cause analysis as a method used to address problems by identifying their underlying root causes in order to correct or eliminate the cause and prevent recurrence. It describes traditional applications, objectives of training, definitions of root cause and approaches. Key steps in root cause analysis are identified as understanding the meaning of root cause, identifying the steps to find the root cause of problems, and using tools like fishbone diagrams, 5 whys, and asking questions.
DESIGN FMEA TRAINING FOR LITENS AUTOMOTIVE
This document outlines a training for Litens Automotive on Design Failure Mode and Effects Analysis (DFMEA). The training covers DFMEA basics, consequences of poorly performed DFMEAs, identifying single points of failure, using design of experiments to optimize designs, and reviewing DFMEA examples. It emphasizes that critical dimensions must be derived from the DFMEA and that DFMEAs are important legal documents that demonstrate due diligence in design and product safety.
Fish Bone
Fishbone diagrams, also known as Ishikawa diagrams or cause-and-effect diagrams, are a visual tool for organizing potential causes for a specific problem or effect. They help identify root causes by sorting possible causes into categories such as methods, materials, machines, people, measurements, and environment. To create a fishbone diagram, the problem is written at the head and main categories of causes are listed as bones extending from the head. Potential specific causes are then listed branching off from each category bone. The diagram can identify root causes and areas for further investigation through a visual representation of the interrelationships between various causes and effects.
Human Error Prevention
How can we prevent accidents caused by human error? This presentation deals with typical examples of severe accidents related to human errors, and shows methods to prevent them.
7 qc tools training material[1]
The document provides an overview of 7 quality control tools: Pareto diagram, stratification, scatter diagram, cause and effect diagram, histogram, check sheet, and control chart/graph. It describes each tool, including what they are, when they are used, and the typical results obtained from each tool. The tools are used to collect and analyze data, identify root causes, measure results, and help solve problems in quality control.
Control phase lean six sigma tollgate template
The document outlines the control phase tools and activities in a Lean Six Sigma project. It includes reviewing project documentation and metrics, developing standard operating procedures and controls, implementing and monitoring the solution, confirming goals are met, identifying opportunities for replication, and transitioning the project to the process owner. Key steps are developing a control plan to monitor processes and respond to variation, updating failure modes and effects analysis, and communicating project results and benefits.
What's hot (20)
Viewers also liked
10 innovative ways the Crystal building is using IoT
The crystal building is using IoT in several ways to change the way we view buildings. To find out more: https://www.thecrystal.org/
The New Retail Revolution: Connected Store
Even though e-commerce is driving quick sales growth, brick and mortar is still the major player in retail industry. According to the survey by TimeTrade, 85% of consumers still prefer to shop in-store. And there are more than 20 online retailers have opened physical stores. It's time for retailers to rethink their omnichannel strategies with store transformation.
The Internet of Things is revolutionizing retail store operations. With the connected devices and sensor data, retailers can receive real-time information of both physical and digital worlds. They can use these insights to offer timely and personalized customer services, make better operational decisions, and secure merchandising and supply networks. Learn about how can IoT provides new opportunities and values for retail business and start your IoT journey with The Honeywell Building Sense.
For more information, visit ibm.com/iot/retail
Arrelic_Overview_2016
Arrelic is a predictive analytics startup firm that helps manufacturing industries improve plant productivity, reliability, and reduce costs through approaches like predictive maintenance and reliability engineering consulting services. It offers predictive analytics tools and consulting services covering asset management, best practices, and plant audits. Arrelic also provides training to help industry professionals achieve sustainable reliability improvements.
The (R)evolution of Predictive Operations & Maintenance
This document discusses the evolution of predictive operations and maintenance in the aerospace and defense industries. It argues that while disruptive digital technologies are becoming capable of enabling the industry's vision, there are still fundamental hurdles to overcome across the ecosystem, including legacy systems, siloed data and processes, and outdated skills. The document outlines a path to revolutionizing operations and maintenance through establishing a fully functioning digital thread and twin, reliable predictive analytics, optimized physical and cyber supply chains, and new decision-making organizations and skills.
Arrelic company brochure
Arrelic is a leading consulting, training, and predictive analytics firm specializing in reliability engineering, asset management, and operational excellence. It offers a range of consulting services including reliability engineering, asset management, operational excellence, and supply chain consulting. Arrelic also provides predictive maintenance services, training and development programs, reliability IT solutions including predictive analytics tools, and industry expertise in areas such as manufacturing, oil and gas, and utilities. The company focuses on developing its people and emphasizes flexibility, challenging work, and work-life balance for employees.
Demystifying Cognitive Approaches to Predictive Maintenance Part 1
This document summarizes a webinar about demystifying cognitive approaches to predictive maintenance. It discusses the current gaps in machine data analysis, such as low compute power limiting data size and models not being repeatable or operationalized. It then describes how cognitive approaches can build scalable and repeatable predictive models by using unsupervised learning on unlabeled data to generate labels for supervised learning. The webinar presents DataRPM's solution for building thousands of predictive models in parallel on large datasets to accurately predict failures. It provides an example use case of applying these techniques to predict washing machine failures for a Fortune 10 manufacturer.
5S Training materials From Deepak Sahoo
This document presents an overview and training program about 5S (Seiri, Seiton, Seiso, Seiketsu, Shitsuke), a methodology for organizing the workplace. It discusses the benefits of 5S including safety, efficiency, quality and eliminating breakdowns. It provides details on the 5 steps - Sort, Set in Order, Shine, Standardize, and Sustain. Examples and exercises are given to demonstrate how to implement each step. The goal is to create a clean, safe and efficient workplace through establishing standards and sustaining 5S practices over time.
cv bryan print 2016
Bryan Barry is a UI/UX designer based in digital design. He has a passion for technology and design and enjoys learning new skills and improving himself. He has experience as a UI/UX designer for Aleph Labs and as a web and digital designer for Xion Digital.
IASH poster .pptx
The document summarizes research on population aging and intergenerational relationships in Nigeria within the context of HIV/AIDS. It identifies two major challenges: 1) the need to strengthen and increase social pension schemes for elderly women caring for children orphaned by HIV/AIDS, and 2) for Nigeria to develop a comprehensive aging policy that protects elderly women. The document recommends disaggregated data collection, community-based research, and expanding social transfer programs to better support elderly female-headed households in the context of HIV/AIDS and population aging in Nigeria.
I&D-Catalog
This document provides information about Absolute I & D, a company that provides labor services for setting up and dismantling exhibits at trade shows. It lists the various cities they operate in across the US and provides hourly rates for labor in each city. It also describes the types of services Absolute I & D offers, including supervision, warehousing, shipping, decorating/rentals, graphics, and additional services. Their goal is to focus on client needs and exceed expectations with expert service and communication.
Chapter 01 - Introduction, aims and outline
1) The document introduces the concept of a Learning Health System (LHS) which aims to continuously improve health systems by leveraging data and analytics to learn from every patient interaction and feed that knowledge back to clinicians and stakeholders.
2) Building an LHS requires connecting multiple stakeholders and data sources in the complex healthcare ecosystem through a shared infrastructure that enables alignment and learning over time.
3) The thesis will explore how to build an LHS infrastructure to connect various parties in the field of cardiac rehabilitation (CR) in the Netherlands to improve care, increase knowledge of continuous learning facilitators, and identify success factors for building an LHS.
Katalog Siberian Health
Зa продуктите "Сибирско здраве"
Продуктите на Корпорация Сибирско здраве са предназначени за комплексно прочистване на вътрешната среда на организма. Всички продукти както и начина на тяхното приемане са съобразени с биоритмите на човешкия организъм. Природните ресурси на едни от най-чистите райони в света, заедно с опита на руските учени, ни давата привилегията да получим най-доброто за нашия организъм: природни имуномодулатори и антиоксидантипродукти за корекция на мастната и въглехидратната обмяна; за оптимизиране на състава на микрофлората на червата; за поддържане на функционалното състояние на сърдечно-съдовата система, черния дроб, костната система и ставите; храносмилателните органи и пикочоотделителната система, органите на зрението. Комплексни програми, както и отделни продукти за попълване на недостига от основни незаменими витамини и микроелементи. Не на последно място- голям брой козметични продукти и средства за лична хигиена, произвеждани на основата на природни биологично активни вещества от растителен, минерален и животински произход.
Понастоящем Корпорацията произвежда над 210 оздравителни и козметични продукти.
Много от тези продукти, както и водещите автори на оригинални патентни разработки са отличени с общо 25 дипломи на авторитетни и престижни изложения, 3 Златни медала „За практически постижения в укрепване на здравето на нацията” на името на И.И.Мечников (лауреат на Нобелова награда), 2 почетни медала „Е. Дашкова” (известен държавен и обществен деятел на Русия), 5 златни медала от широкоизвестната в Русия изложба „Сибирски панаир”.
Клиничните изпитания за ефективността на биологично активните хранителни добавки на Корпорацията се извършват от водещите клиники на Руската академия на науката
Nothing but the best, paul schrier
Paul K. Schrier and Florida Accident Law Help is a law firm with offices throughout Florida that has been helping injured clients for over 50 years. They offer legal assistance for auto accidents, slip and falls, work injuries, and more. The firm is known for its empathetic approach with clients and strong advocacy to deliver justice and obtain compensation for those harmed.
Personal injury lawyer
Paul K. Schrier has been practicing law for 28 years. It began when he received his first degree from Emory University in 1983
Diapositiva
Este documento resume las características principales del contrato de arrendamiento según el Código Civil español. Define el arrendamiento como un contrato en el que el arrendador cede temporalmente el uso de un bien al arrendatario a cambio del pago de una renta. Detalla los elementos esenciales como las partes involucradas (arrendador y arrendatario), las obligaciones de cada uno, y las formas de conclusión del contrato.
How ai empowers mi teaser
Abstract
Learn how artificial intelligence helps CI professionals to get unprecedented understanding of what’s going on in their industry : key trends, new technologies, competitor's moves and more…
This session is both theoretical and practical. This will be illustrated on how Machine Learning brings context when it comes to identifying information about companies.
Key topics
Provide an understanding of the current trends in the information industry, especially concerning MI/CI
Give an overview of the solutions offered by artificial intelligence technologies
Explain how disruptive providers can help, versus the challenge you are likely to face if you try alone
Viewers also liked (19)
10 innovative ways the Crystal building is using IoT
10 innovative ways the Crystal building is using IoT
The (R)evolution of Predictive Operations & Maintenance
The (R)evolution of Predictive Operations & Maintenance
Demystifying Cognitive Approaches to Predictive Maintenance Part 1
Demystifying Cognitive Approaches to Predictive Maintenance Part 1
Similar to Improving operations with predictive maintenance
AMB100: Ivanti Asset Management Suite from the Ground Up
Ivanti Asset Management Suite provides IT asset management capabilities including asset tracking, discovery, software compliance, and license optimization. It allows organizations to gain visibility into their IT assets, optimize software licensing, ensure compliance, and reduce IT costs by 25-50%. Key benefits include savings from reduced software spending, optimized license procurement, and cost avoidance from identifying unused licenses. Customers report savings ranging from $100,000 to $150 million by using Ivanti's ITAM solutions.
AI Use Cases OA
Using IBM OpenPower and AC922 server Object-automation has developed and deployed its solutions in all the sectors
AI Use Cases OA
Using IBM OpenPOWER and AC922 server Object Automation has developed and deployed its solutions in all the sectors
Information Governance
Information Governance Training - Learn how to establish an information accountability framework that reduces costs, manages risk, and optimizes value
Capgemini Smart Plant Supervision Solution
The document discusses smart plant supervision using Internet of Things (IoT) technology. It describes how IoT can be used to remotely monitor industrial equipment and processes using sensors, aggregate and analyze the sensor data using predictive analytics, and take actions like scheduling maintenance to prevent failures and optimize operations. Implementing such a smart plant supervision system using IoT could reduce costs through minimized downtime and waste while improving productivity, safety, and other benefits for manufacturing and other industries. The document provides examples of potential use cases and components of an IoT framework for smart plant supervision.
MaintSmart CMMS Software
CMMS software for work order management, preventive maintenance, equipment maintenance, downtime and equipment failure tracking, reliability analysis, overall equipment effectiveness, purchasing and inventory management.
Advanced manufacturing technology
This document discusses advanced manufacturing technology (AMT) and its impact on management accounting systems. It argues that traditional management accounting is inappropriate for companies using AMT. AMT refers to automated production technologies, computer-aided design/manufacturing, flexible manufacturing systems, robotics, total quality control, and production management systems like materials requirement planning and just-in-time systems. The objectives of AMT include helping companies compete globally through high quality, low cost production and flexibility. Concepts discussed in more detail include computer-aided design/manufacturing, flexible manufacturing systems, production management systems like materials requirement planning and just-in-time purchasing and production. The document examines the justification for promoting the use of A
Connected Service: Leveraging M2M and IoT Data to Create Proactive 1:1 Custom...
Most companies with M2M and IoT systems analyze the data only periodically to schedule predictive maintenance. At Capgemini, we use the data generated by connected devices in real-time to create a one-to-one post-purchase dialog with the business customer or consumer.
By analyzing the condition, performance and also use of connected products like cars and machines, our ConnectedService solution can trigger real-time customer interactions in sales, customer care, and service.
By using data in this manner, we enable a new set of proactive business cases like identifying new sales opportunities, decreasing emissions, improving safety, optimizing resources, and enhancing productivity.
First presented at Dreamforce 2014 by Michael Capone, Prof. Dr. Principal Business Analyst, DCX, Capgemini.
http://www.capgemini.com/salesforce
Meeting the challenges to adopt visual production management systems hms-whit...
This White Paper will provide an essential understanding of different initiatives towards having a Visual Production Management system, (VPMS), in a manufacturing environment. Also insights about why? and how? to implement a VPMS, highlighting the benefits of taking these actions, and further across your environment creating a learning organization.
Download from www.hmswebsite.com/vpms-white-paper/
Technology Solutions for Manufacturing
In today’s globalized, competitive marketplace, being able to leverage technology to deliver faster turnaround times, meet lower pricing goals and provide customizable options can mean the difference between sustainability and irrelevancy. In this ebook, we’ll explore some of the leading solutions transforming the manufacturing industry:
- Automation for cost savings
- 3D printing for improved productivity
- Smart data for quality assurance
- Connectivity for safety and communication
- Security solutions to protect it all
Learn more: http://ms.spr.ly/6006Twegg
AMI Global Award Write Up
2018 North American Integrated IIoT Solutions for Process Equipment Entrepreneurial Company of the Year Award
IRJET- Maintenance and Reliability Strategy of Mechanical Equipment in Industry
This document discusses maintenance and reliability strategies for mechanical equipment in industry. It describes four main strategies: run-to-failure, preventive maintenance, predictive maintenance, and reliability-centered maintenance. Preventive maintenance involves periodically inspecting and repairing equipment on a predetermined schedule. Predictive maintenance uses data from sensors to predict failures before they occur. Reliability-centered maintenance analyzes all possible failure modes for each piece of equipment to customize maintenance plans. The strategies are compared in terms of pros, cons, and cost to implement. Reliability-centered maintenance provides the most efficient maintenance schedule but requires the most resources to execute properly.
Preventive Maintenance
This document provides 16 ways to save time and money on preventive maintenance programs. It suggests that many PM programs are larger than needed and consume too many resources while still resulting in unexpected equipment failures. It recommends first considering predictive maintenance technologies before adding more PMs. Other tips include removing unnecessary PMs, questioning if PMs actually help productivity, getting data from PMs that can be trended over time, and ensuring PMs are completed within 10% of their scheduled due date. The goal of PM should be to detect small problems to plan repairs, not just prevent failures.
leewayhertz.com-AI in predictive maintenance Use cases technologies benefits ...
Predictive maintenance is a proactive approach that anticipates equipment failures before they happen. At the forefront of this innovative strategy is Artificial Intelligence (AI), which brings unprecedented precision and efficiency. AI in predictive maintenance is transforming industries by reducing downtime, minimizing costs, and enhancing productivity.
Analysis and optimization of maintenances management of instruments
This document appears to be a project report on analyzing and optimizing the maintenance management of instruments at Ashapura Volclay Ltd. It provides background information on the importance of maintenance management. The objectives of maintenance management are to minimize downtime and repair costs, use personnel and equipment efficiently, prolong asset life, and improve productivity and quality. It also provides a brief company profile of Ashapura Group, which is India's largest provider of industrial minerals and the parent company of Ashapura Volclay Ltd.
Optimizing connected system performance md&m-anaheim-sandhi bhide 02-07-2017
Sandhiprakash Bhide presenting at the Smart Manufacturing Innovation Summit/Industry 4.0 event on "Optimizing Connected System Performance and Establishing Tangible Goals for Sensor Use"
IRJET- Vendor Management System using Machine Learning
This document proposes a vendor management system that uses machine learning to help original equipment manufacturers (OEMs) more efficiently manage multiple vendors. The system would provide a business intelligence dashboard to analyze vendor data visually and predict top quality vendors. It would use logistic regression and machine learning models on historical vendor order and delivery data to generate performance reports and identify ideal vendors. This would help OEMs more easily select high-quality vendors, place orders, and reduce costs compared to traditional manual vendor management processes.
Manajemen Operasi Dalam Manajemen Program
Manajemen Operasi adalah area bisnis yang berfokus pada proses produksi, serta memastikan pemeliharaan dan perkembangan berlangsung secara efektif dan efisien. seorang manajer operasi bertanggung jawab mengelola proses perubahan input menjadi output
Master Data, From Inspection to Analytics to Business Decision
Machinery inspection data comes in a variety of forms, from vibration to ultrasound to infrared and oil analysis to motor current and human observations.
Each data set has its own characteristics, its own ability to detect defects in our equipment, and its own data formats.
Unifying these data items into a collaborative system is a multi-step process, yielding a trans-formative life of data and resulting information.
This presentation describes the data types, initial meta data, and equipment conditioning indicating features we can extract from the data.
From this point, condition indicating features combine in new forms to provide a holistic view of equipment health when combined with domain knowledge.
The presentation describes the fusion of inspection data sources with encapsulated domain knowledge that facilitates rapid assessments of machine health.
Case studies and a review of commercial systems supporting these concepts are provided to illustrate data management concepts described.
How to optimize the supply chain with ai
Just a few years back, artificial intelligence meant adaptions like Jarvis. Who would have thought that AI would soon become an application of our daily lives?
Artificial intelligence has the potential to streamline several business processes, analyze data for insights, and help in building fruitful business strategies. Hence, globally, it is being used to remediate old processes, invent new methods, and improve productivity.
Similar to Improving operations with predictive maintenance (20)
AMB100: Ivanti Asset Management Suite from the Ground Up
AMB100: Ivanti Asset Management Suite from the Ground Up
Connected Service: Leveraging M2M and IoT Data to Create Proactive 1:1 Custom...
Connected Service: Leveraging M2M and IoT Data to Create Proactive 1:1 Custom...
Meeting the challenges to adopt visual production management systems hms-whit...
Meeting the challenges to adopt visual production management systems hms-whit...
IRJET- Maintenance and Reliability Strategy of Mechanical Equipment in Industry
IRJET- Maintenance and Reliability Strategy of Mechanical Equipment in Industry
leewayhertz.com-AI in predictive maintenance Use cases technologies benefits ...
leewayhertz.com-AI in predictive maintenance Use cases technologies benefits ...
Analysis and optimization of maintenances management of instruments
Analysis and optimization of maintenances management of instruments
Optimizing connected system performance md&m-anaheim-sandhi bhide 02-07-2017
Optimizing connected system performance md&m-anaheim-sandhi bhide 02-07-2017
IRJET- Vendor Management System using Machine Learning
IRJET- Vendor Management System using Machine Learning
Master Data, From Inspection to Analytics to Business Decision
Master Data, From Inspection to Analytics to Business Decision
More from IBM Internet of Things
Regulatory Reality Check: Improve trust, compliance and visibility with IoT a...
Regulatory Reality Check: Improve trust, compliance and visibility with IoT a...IBM Internet of Things
The document discusses how blockchain and IoT can improve trust, compliance and visibility for asset-intensive industries. It provides examples of how non-compliance costs industries billions annually and introduces blockchain as an immutable ledger that can be used with Maximo to improve processes like maintenance, repair, and disposal that involve multiple parties. The remainder demonstrates how Maximo and blockchain could be used together for various asset management scenarios through a network that allows external participants while maintaining data security and integrity.Top 3 Sessions featuring AI and IoT at Think 2019
Don't miss the Watson IoT Trends and Directions Keynote Session, an amazing panel on Optimizing Operations with AI and Advanced Analytics, and an important panel discussion about gender bias in AI. Add these sessions to your Think agenda! https://www.ibm.com/events/think/watch/
IBM at MaximoWorld 2018: Journey Map
Everything you need to know about getting connected with IBM at MaximoWorld to learn about Enterprise Asset Management. We are expecting over 1,000 asset management and reliability experts to converge on The Walt Disney Dolphin in Orlando. People come for the community and stay for the keynotes. Visit the IBM booth to meet the experts.
Hannover Messe: Evolution of a cognitive Digital Twin
"Designing Better Machines: Evolution of a cognitive Digital Twin"
Industry 4.0 Meets Industrial Internet of Things Forum at Hannover Messe 2018 with IBM Watson IoT CTO Sky Matthews @blueskyflash @IBMIoT #HM18 #IBM #WatsonIoT
Genius of Things Houston
As everything becomes connected—from exploration
technology to drilling equipment to offshore platforms,
conveyor belts, and refineries—businesses that apply
AI to IoT data will win. They will extract valuable
insights to improve virtually every aspect of their
operations and enable innovative, new business models.
Ensure your business is capitalizing on this with IBM's
IoT solutions powered by Watson.
http://www.ibm.com/events/2018/GoTHouston
IBM Maximo Asset Management
An overview of what it is and how it can benefit your operations. Enterprise Asset Management (EAM) is the lifecycle management of the physical assets of an organization. An asset can be such things as machines, equipment, tools, buildings, plants, vehicles or ships.
Try IBM Maximo today: https://www.ibm.com/us-en/marketplace/maximo
Digital Twin: Starting the journey
The document discusses preparing organizations for digital twins using IoT platforms and technologies like AI, analytics, and cloud services. It emphasizes positioning AI to augment human insights, reinventing operations with new digital data sources, and leveraging proven industrial expertise. Digital twins can provide real-time virtual representations of physical systems to improve decision making across their lifecycles using multiple data sources and models. The document recommends preparing for digital twins as part of an extensible IoT platform.
Maximo Field Service Management
For asset-intensive organizations, mobility continues to drive significant productivity gains, improve worker effectiveness and safety, and eliminate errors by capturing data directly from the work source.
Visit our web site to learn how enterprise asset management can help you transform your maintenance and asset management practices using IoT data, weather data and powerful, cognitive analytics. https://www.ibm.com/us-en/marketplace/maximo
IoT Slam Keynote: The Rise of the IoT Application with Chris O'Connor
The Internet of Things is transforming the way we work and live. IoT technologies are enabling enterprises to create new business models, transform customer engagements and catapult entire industries forward. Technologies like cognitive computing, IoT Platforms, blockchain and Digital Twin are rapidly reinventing how businesses are driving industry transformation. This session explores how businesses across the world are taking advantage of the ever-more-connected world to drive smarter and more profitable business. Watch the replay on IoT Practitioner. https://iotpractitioner.com/iot-slam-live-2017-headline-keynote-chris-oconnor/
IBM Watson Internet of Things: Introducing Digital Twin
What is the Digital Twin?
Digital twin is the ability to make a virtual representation of the physical elements and the dynamics of how an Internet of Things device operates and works. It's more than a blueprint, it's more than a schematic. It's not just a picture. It's a lot more than a pair of ‘virtual reality’ glasses. It's a virtual representation of both the elements and the dynamics of how an Internet of Things device responds throughout its lifecycle. It can be a jet engine, a building, process on factory floor, and much, much more.
Watch the video introduction of this keynote presentation from Genius of Things Summit in Munich https://youtu.be/RaOejcczPas
The Full Spectrum of IoT Electronics
The document discusses how the Internet of Things (IoT) is driving a fundamental shift in the $3 trillion electronics industry from product-based to sensor and data-driven services. It outlines several industry segments that can benefit from an IoT strategy, including medical devices, consumer electronics, network equipment, office products, semiconductors, and power/automation. Representative IoT transformations are presented for each segment, such as asset optimization, intelligent fulfillment, plant performance management, and connected products.
Journey to Industry 4.0 and beyond with Cognitive Manufacturing
A look at how cognitive computing is driving new productivity and gains in the manufacturing industry. TO learn more: http://www.ibm.com/internet-of-things/iot-solutions/connected-manufacturing/
World of Watson IoT Journey Map
Excited about all the Internet of Things sessions at World of Watson? Check out this journey map to make sure you don't miss a thing.
IBM and Siemens are transforming Real Estate
The Siemens and IBM partnership delivers unriveled global expertise, technology, and services to convert your real estate accounts in to active contributors to buisness success
Race Across America 206 with David Haase
The Race Across America (RAAM) is a 3,000+ mile bicycle race from California to Maryland that is considered the single toughest race in the world. Riders face extreme heat, high winds, and sand in the desert portions. Many riders do not finish due to the harsh conditions. Dave Haase, a 4-time top American finisher, has created the "Internet of Dave" by connecting sensors on his bike and body to the IBM Watson IoT Platform and analytics apps. This allows him to monitor heart rate, temperature, speed, and other metrics in real-time. The data is analyzed to provide forecasts and optimize racing versus resting decisions to help Dave race in a perfect manner and improve his chances
IBM Internet of Things Offerings
An overview of IBM IoT offerings and how they can help you harness the connected world to transform your enterprise.
More from IBM Internet of Things (16)
Regulatory Reality Check: Improve trust, compliance and visibility with IoT a...
Regulatory Reality Check: Improve trust, compliance and visibility with IoT a...
Hannover Messe: Evolution of a cognitive Digital Twin
Hannover Messe: Evolution of a cognitive Digital Twin
IoT Slam Keynote: The Rise of the IoT Application with Chris O'Connor
IoT Slam Keynote: The Rise of the IoT Application with Chris O'Connor
IBM Watson Internet of Things: Introducing Digital Twin
IBM Watson Internet of Things: Introducing Digital Twin
Journey to Industry 4.0 and beyond with Cognitive Manufacturing
Journey to Industry 4.0 and beyond with Cognitive Manufacturing
Recently uploaded
Columbus Data & Analytics Wednesdays - June 2024
Columbus Data & Analytics Wednesdays, June 2024 with Maria Copot 20
Energy Efficient Video Encoding for Cloud and Edge Computing Instances
Energy Efficient Video Encoding for Cloud and Edge Computing Instances
Main news related to the CCS TSI 2023 (2023/1695)
An English 🇬🇧 translation of a presentation to the speech I gave about the main changes brought by CCS TSI 2023 at the biggest Czech conference on Communications and signalling systems on Railways, which was held in Clarion Hotel Olomouc from 7th to 9th November 2023 (konferenceszt.cz). Attended by around 500 participants and 200 on-line followers.
The original Czech 🇨🇿 version of the presentation can be found here: https://www.slideshare.net/slideshow/hlavni-novinky-souvisejici-s-ccs-tsi-2023-2023-1695/269688092 .
The videorecording (in Czech) from the presentation is available here: https://youtu.be/WzjJWm4IyPk?si=SImb06tuXGb30BEH .
TrustArc Webinar - 2024 Global Privacy Survey
How does your privacy program stack up against your peers? What challenges are privacy teams tackling and prioritizing in 2024?
In the fifth annual Global Privacy Benchmarks Survey, we asked over 1,800 global privacy professionals and business executives to share their perspectives on the current state of privacy inside and outside of their organizations. This year’s report focused on emerging areas of importance for privacy and compliance professionals, including considerations and implications of Artificial Intelligence (AI) technologies, building brand trust, and different approaches for achieving higher privacy competence scores.
See how organizational priorities and strategic approaches to data security and privacy are evolving around the globe.
This webinar will review:
- The top 10 privacy insights from the fifth annual Global Privacy Benchmarks Survey
- The top challenges for privacy leaders, practitioners, and organizations in 2024
- Key themes to consider in developing and maintaining your privacy program
How to Interpret Trends in the Kalyan Rajdhani Mix Chart.pdf
A Mix Chart displays historical data of numbers in a graphical or tabular form. The Kalyan Rajdhani Mix Chart specifically shows the results of a sequence of numbers over different periods.
Monitoring and Managing Anomaly Detection on OpenShift.pdf
Monitoring and Managing Anomaly Detection on OpenShift
Overview
Dive into the world of anomaly detection on edge devices with our comprehensive hands-on tutorial. This SlideShare presentation will guide you through the entire process, from data collection and model training to edge deployment and real-time monitoring. Perfect for those looking to implement robust anomaly detection systems on resource-constrained IoT/edge devices.
Key Topics Covered
1. Introduction to Anomaly Detection
- Understand the fundamentals of anomaly detection and its importance in identifying unusual behavior or failures in systems.
2. Understanding Edge (IoT)
- Learn about edge computing and IoT, and how they enable real-time data processing and decision-making at the source.
3. What is ArgoCD?
- Discover ArgoCD, a declarative, GitOps continuous delivery tool for Kubernetes, and its role in deploying applications on edge devices.
4. Deployment Using ArgoCD for Edge Devices
- Step-by-step guide on deploying anomaly detection models on edge devices using ArgoCD.
5. Introduction to Apache Kafka and S3
- Explore Apache Kafka for real-time data streaming and Amazon S3 for scalable storage solutions.
6. Viewing Kafka Messages in the Data Lake
- Learn how to view and analyze Kafka messages stored in a data lake for better insights.
7. What is Prometheus?
- Get to know Prometheus, an open-source monitoring and alerting toolkit, and its application in monitoring edge devices.
8. Monitoring Application Metrics with Prometheus
- Detailed instructions on setting up Prometheus to monitor the performance and health of your anomaly detection system.
9. What is Camel K?
- Introduction to Camel K, a lightweight integration framework built on Apache Camel, designed for Kubernetes.
10. Configuring Camel K Integrations for Data Pipelines
- Learn how to configure Camel K for seamless data pipeline integrations in your anomaly detection workflow.
11. What is a Jupyter Notebook?
- Overview of Jupyter Notebooks, an open-source web application for creating and sharing documents with live code, equations, visualizations, and narrative text.
12. Jupyter Notebooks with Code Examples
- Hands-on examples and code snippets in Jupyter Notebooks to help you implement and test anomaly detection models.
HCL Notes und Domino Lizenzkostenreduzierung in der Welt von DLAU
Webinar Recording: https://www.panagenda.com/webinars/hcl-notes-und-domino-lizenzkostenreduzierung-in-der-welt-von-dlau/
DLAU und die Lizenzen nach dem CCB- und CCX-Modell sind für viele in der HCL-Community seit letztem Jahr ein heißes Thema. Als Notes- oder Domino-Kunde haben Sie vielleicht mit unerwartet hohen Benutzerzahlen und Lizenzgebühren zu kämpfen. Sie fragen sich vielleicht, wie diese neue Art der Lizenzierung funktioniert und welchen Nutzen sie Ihnen bringt. Vor allem wollen Sie sicherlich Ihr Budget einhalten und Kosten sparen, wo immer möglich. Das verstehen wir und wir möchten Ihnen dabei helfen!
Wir erklären Ihnen, wie Sie häufige Konfigurationsprobleme lösen können, die dazu führen können, dass mehr Benutzer gezählt werden als nötig, und wie Sie überflüssige oder ungenutzte Konten identifizieren und entfernen können, um Geld zu sparen. Es gibt auch einige Ansätze, die zu unnötigen Ausgaben führen können, z. B. wenn ein Personendokument anstelle eines Mail-Ins für geteilte Mailboxen verwendet wird. Wir zeigen Ihnen solche Fälle und deren Lösungen. Und natürlich erklären wir Ihnen das neue Lizenzmodell.
Nehmen Sie an diesem Webinar teil, bei dem HCL-Ambassador Marc Thomas und Gastredner Franz Walder Ihnen diese neue Welt näherbringen. Es vermittelt Ihnen die Tools und das Know-how, um den Überblick zu bewahren. Sie werden in der Lage sein, Ihre Kosten durch eine optimierte Domino-Konfiguration zu reduzieren und auch in Zukunft gering zu halten.
Diese Themen werden behandelt
- Reduzierung der Lizenzkosten durch Auffinden und Beheben von Fehlkonfigurationen und überflüssigen Konten
- Wie funktionieren CCB- und CCX-Lizenzen wirklich?
- Verstehen des DLAU-Tools und wie man es am besten nutzt
- Tipps für häufige Problembereiche, wie z. B. Team-Postfächer, Funktions-/Testbenutzer usw.
- Praxisbeispiele und Best Practices zum sofortigen Umsetzen
Fueling AI with Great Data with Airbyte Webinar
This talk will focus on how to collect data from a variety of sources, leveraging this data for RAG and other GenAI use cases, and finally charting your course to productionalization.
HCL Notes and Domino License Cost Reduction in the World of DLAU
Webinar Recording: https://www.panagenda.com/webinars/hcl-notes-and-domino-license-cost-reduction-in-the-world-of-dlau/
The introduction of DLAU and the CCB & CCX licensing model caused quite a stir in the HCL community. As a Notes and Domino customer, you may have faced challenges with unexpected user counts and license costs. You probably have questions on how this new licensing approach works and how to benefit from it. Most importantly, you likely have budget constraints and want to save money where possible. Don’t worry, we can help with all of this!
We’ll show you how to fix common misconfigurations that cause higher-than-expected user counts, and how to identify accounts which you can deactivate to save money. There are also frequent patterns that can cause unnecessary cost, like using a person document instead of a mail-in for shared mailboxes. We’ll provide examples and solutions for those as well. And naturally we’ll explain the new licensing model.
Join HCL Ambassador Marc Thomas in this webinar with a special guest appearance from Franz Walder. It will give you the tools and know-how to stay on top of what is going on with Domino licensing. You will be able lower your cost through an optimized configuration and keep it low going forward.
These topics will be covered
- Reducing license cost by finding and fixing misconfigurations and superfluous accounts
- How do CCB and CCX licenses really work?
- Understanding the DLAU tool and how to best utilize it
- Tips for common problem areas, like team mailboxes, functional/test users, etc
- Practical examples and best practices to implement right away
National Security Agency - NSA mobile device best practices
Threats to mobile devices are more prevalent and increasing in scope and complexity. Users of mobile devices desire to take full advantage of the features
available on those devices, but many of the features provide convenience and capability but sacrifice security. This best practices guide outlines steps the users can take to better protect personal devices and information.
OpenID AuthZEN Interop Read Out - Authorization
During Identiverse 2024 and EIC 2024, members of the OpenID AuthZEN WG got together and demoed their authorization endpoints conforming to the AuthZEN API
Project Management Semester Long Project - Acuity
Acuity is an innovative learning app designed to transform the way you engage with knowledge. Powered by AI technology, Acuity takes complex topics and distills them into concise, interactive summaries that are easy to read & understand. Whether you're exploring the depths of quantum mechanics or seeking insight into historical events, Acuity provides the key information you need without the burden of lengthy texts.
AI 101: An Introduction to the Basics and Impact of Artificial Intelligence
Imagine a world where machines not only perform tasks but also learn, adapt, and make decisions. This is the promise of Artificial Intelligence (AI), a technology that's not just enhancing our lives but revolutionizing entire industries.
“Building and Scaling AI Applications with the Nx AI Manager,” a Presentation...
“Building and Scaling AI Applications with the Nx AI Manager,” a Presentation...Edge AI and Vision Alliance
For the full video of this presentation, please visit: https://www.edge-ai-vision.com/2024/06/building-and-scaling-ai-applications-with-the-nx-ai-manager-a-presentation-from-network-optix/
Robin van Emden, Senior Director of Data Science at Network Optix, presents the “Building and Scaling AI Applications with the Nx AI Manager,” tutorial at the May 2024 Embedded Vision Summit.
In this presentation, van Emden covers the basics of scaling edge AI solutions using the Nx tool kit. He emphasizes the process of developing AI models and deploying them globally. He also showcases the conversion of AI models and the creation of effective edge AI pipelines, with a focus on pre-processing, model conversion, selecting the appropriate inference engine for the target hardware and post-processing.
van Emden shows how Nx can simplify the developer’s life and facilitate a rapid transition from concept to production-ready applications.He provides valuable insights into developing scalable and efficient edge AI solutions, with a strong focus on practical implementation.Generating privacy-protected synthetic data using Secludy and Milvus
During this demo, the founders of Secludy will demonstrate how their system utilizes Milvus to store and manipulate embeddings for generating privacy-protected synthetic data. Their approach not only maintains the confidentiality of the original data but also enhances the utility and scalability of LLMs under privacy constraints. Attendees, including machine learning engineers, data scientists, and data managers, will witness first-hand how Secludy's integration with Milvus empowers organizations to harness the power of LLMs securely and efficiently.
Let's Integrate MuleSoft RPA, COMPOSER, APM with AWS IDP along with Slack
Discover the seamless integration of RPA (Robotic Process Automation), COMPOSER, and APM with AWS IDP enhanced with Slack notifications. Explore how these technologies converge to streamline workflows, optimize performance, and ensure secure access, all while leveraging the power of AWS IDP and real-time communication via Slack notifications.
Introduction of Cybersecurity with OSS at Code Europe 2024
I develop the Ruby programming language, RubyGems, and Bundler, which are package managers for Ruby. Today, I will introduce how to enhance the security of your application using open-source software (OSS) examples from Ruby and RubyGems.
The first topic is CVE (Common Vulnerabilities and Exposures). I have published CVEs many times. But what exactly is a CVE? I'll provide a basic understanding of CVEs and explain how to detect and handle vulnerabilities in OSS.
Next, let's discuss package managers. Package managers play a critical role in the OSS ecosystem. I'll explain how to manage library dependencies in your application.
I'll share insights into how the Ruby and RubyGems core team works to keep our ecosystem safe. By the end of this talk, you'll have a better understanding of how to safeguard your code.
Recently uploaded (20)
Energy Efficient Video Encoding for Cloud and Edge Computing Instances
Energy Efficient Video Encoding for Cloud and Edge Computing Instances
How to Interpret Trends in the Kalyan Rajdhani Mix Chart.pdf
How to Interpret Trends in the Kalyan Rajdhani Mix Chart.pdf
Monitoring and Managing Anomaly Detection on OpenShift.pdf
Monitoring and Managing Anomaly Detection on OpenShift.pdf
HCL Notes und Domino Lizenzkostenreduzierung in der Welt von DLAU
HCL Notes und Domino Lizenzkostenreduzierung in der Welt von DLAU
HCL Notes and Domino License Cost Reduction in the World of DLAU
HCL Notes and Domino License Cost Reduction in the World of DLAU
National Security Agency - NSA mobile device best practices
National Security Agency - NSA mobile device best practices
AI 101: An Introduction to the Basics and Impact of Artificial Intelligence
AI 101: An Introduction to the Basics and Impact of Artificial Intelligence
Deep Dive: AI-Powered Marketing to Get More Leads and Customers with HyperGro...
Deep Dive: AI-Powered Marketing to Get More Leads and Customers with HyperGro...
“Building and Scaling AI Applications with the Nx AI Manager,” a Presentation...
“Building and Scaling AI Applications with the Nx AI Manager,” a Presentation...
Generating privacy-protected synthetic data using Secludy and Milvus
Generating privacy-protected synthetic data using Secludy and Milvus
Let's Integrate MuleSoft RPA, COMPOSER, APM with AWS IDP along with Slack
Let's Integrate MuleSoft RPA, COMPOSER, APM with AWS IDP along with Slack
Introduction of Cybersecurity with OSS at Code Europe 2024
Introduction of Cybersecurity with OSS at Code Europe 2024
Improving operations with predictive maintenance
- 1. © Copyright IBM Corporation 2016. IBM, the IBM logo, and ibm.com are trademarks of International Business Machines Corp., registered in many jurisdictions worldwide. Other product and service names might be trademarks of IBM or other companies. A current list of IBM trademarks is available on the Web at “Copyright and trademark information” at www.ibm.com/legal/copytrade. 1 Source: Oniqua Enterprise Analytics, Reducing the Cost of Preventative Maintenance, http://www.plant-maintenance.com/articles/PMCostReduction.pdf 2 Source: T.A. Cook, Maintenance Efficiency Report 2013, August 2013. http://uk.tacook.com/fileadmin/files/3_Studies/Studies/2013/ T.A._Cook_Maintenance_Efficiency_Report_2013_En.pdf?tracked=1 3 Source: ARC view, Optimize Asset Performance with Industrial IoT and Analytics, August 2015 http://www-01.ibm.com/common/ssi/cgi-bin/ssialias?subtype= WH&infotype=SA&htmlfid=WWL12350USEN&attachment=WWL12350USEN.PDF 4 Source: Enterprise Asset Management and Field Service Management, ARC Advisory Group, 04/17/2015. http://www.arcweb.com/market-studies/pages/enterprise-asset-management.aspx 5 Source: McKinsey https://www.mckinsey.de/sites/mck_files/files/unlocking_the_potential_of_the_internet_of_things_full_report.pdf 6 Source: Fortune http://fortune.com/2015/07/22/mckinsey-internet-of-things/ 7 Source: G.P. Sullivan, R. Pugh, A.P. Melendez and W.D. Hunt, “Operations & Maintenance Best Practices: A Guide to Achieving Operational Efficiency, Release 3.0,” Pacific Northwest National Laboratory, U.S. Department of Energy, August 2010. 8 Source: IDCON Inc., Optimize your Preventive Maintenance, http://www.idcon.com/resource-library/articles/preventive-maintenance/528-optimize-preventive-maintenance.html Learn more about how CBM can help you maximize uptime, visit: http://ibm.co/asset-mgt A full 40%of organizations are not using any form of predictive maintenance.4 50% 4 Total spend on preventive maintenance can be reduced by up to 23%of organizations that are using predictive maintenance integrate work order systems.4 Only For example, on one oil rig 99%of data collected from sensor-enabled assets went unused. 5 30%of preventive maintenance activities are carried out too frequently1 45%of all maintenance efforts are ineffective2 Most companies are aware of waste in their preventive maintenance efforts, but aren't quite sure how to eliminate it. Traditional preventive maintenance embraces a time based approach. This consumes unnecessary resources and may actually cause failure by disrupting the equilibrium of stable assets. 3 How do you know where to spend your time, money and resources? Your machines are talking. Are you listening? Condition-based maintenance (CBM) is a discipline that uses the Internet of Things to monitor asset conditions and trigger preventive maintenance actions. This can help you predict and prevent unplanned downtime. With CBM you can: Listen to your machines! The results speak for themselves. By implementing CBM best practices: and yet... Monitor and analyze asset health data, both historical and real-time Intervene at the right time, before assets go down Prioritize and optimize resources Listen to your machines! Are your preventive maintenance efforts wrenching away precious resources? Time to listen to your machines. Eliminate up to of breakdowns7 70%25% 6 Reduce maintenance costs by up to 50% 5 Reduce downtime by up to 12% 7 Reduce scheduled repairs by up to 50% 6 Cut unplanned outages by up to 3-5%5 Reduce capital investment by 50% to 70% Total preventative maintenance hours can be reduced by8 40%of preventive maintenance costs are spent on assets with negligible affect on uptime failure1 Only 18%of assets have an age related failure pattern3 82%of asset failures appear random3