Download to read offline

![Nurdin, Syaiful Bahri, Zulkarnain, Sukendi
http://www.iaeme.com/IJCIET/index.asp 331 editor@iaeme.com
1. INTRODUCTION
Good planning for land use is very important in improving the performance of a catchment
area in maintaining water stability used for various interests, especially for the benefit of the
wider community. Increased population growth affects land conversion, especially from forest
areas to non-forest areas or cultivation areas.
The Koto Panjang hydropower catchment area is in three districts, namely, Kampar,
Pasaman, and Lima Puluh Kota. Quoting from the Central Statistics Bureau of Pasaman
Regency (2016), Pasaman Regency was dominated by Mapat Tunggul Selatan District with a
population growth of 1.56%. Based on the Central Statistics Bureau of Lima Puluh Kota
Regency (2016), Lima Puluh Kota Regency was dominated by Kapur IX Subdistrict with a
population growth of 1.02%, Bukik Barisan District with a population growth of 0.85%, and
Pangkalan Koto Baru District with a growth of 0. 82%. From the data sources of the Central
Statistics Agency of Kampar Regency (2016) it was noted that in Kampar District there were
two subdistricts in the catchment area, namely XIII Koto Kampar District with a population
growth of 1.48%, and Koto Kampar Hulu Subdistrict with a population growth of 3.81%.
Population growth which tends to increase causes the ongoing development process is also
very fast, causing changes in land use patterns, where the built space increasingly dominates
and urges natural space to change functions (Suasti et al, 2012) [1].
Changes in land use due to an increase in population affect the hydrology characteristics
of watershed (Mobarok, 2015) [2]. The results of the interpretation of Landsat images in
2002 land cover of forest in the catchment area 1,167.08 km (Mulyadi, 2003) [3]. According
to Mustiono (2010) [4] over a period of eight year forest cover experienced a major change to
904,327 km, mainly changed to cultivated crops and open land. The extent of open land or
deforestation can accelerate the flow of water to the reservoir and also affect fluctuations that
affect the level of the reservoir water level.
The hydrological model of the Soil and Water Assessment Tool (SWAT) can help
simulate the effects of land use changes on hydrological characteristics in producing water.
According to Junaidi, and Tarigan (2012) [5] SWAT which is connected to GIS and integrates
with Decision Support System (DSS). Firdaus et al. (2014) [6] said, the SWAT model can
analyze the best hydrological response based on the determination of conservation techniques.
Likewise, Singh et al. (2013) [7] said, the method used for calibration and validation using
SUFI-2 and GLUE from SWAT CUP.
The purpose of this study is to analyze the hydrological characteristics due to changes in
land use, and can provide recommendations on the best land use in the catchment area of Koto
Panjang Hydroelectric power.
2. LITERATURE REVIEW
Changes in land use due to an increase in population affect the hydrology characteristics of
watershed (Mobarok, 2015) [2]. The results of the interpretation of Landsat images in 2002
land cover of forest in the catchment area 1,167.08 km (Mulyadi, 2003) [3]. According to
Mustiono (2010) [4] over a period of eight year forest cover experienced a major change to
904,327 km, mainly changed to cultivated crops and open land. The extent of open land or
deforestation can accelerate the flow of water to the reservoir and also affect fluctuations that
affect the level of the reservoir water level.
The hydrological model of the Soil and Water Assessment Tool (SWAT) can help
simulate the effects of land use changes on hydrological characteristics in producing water.
According to Junaidi, and Tarigan (2012) [5] SWAT which is connected to GIS and integrates
with Decision Support System (DSS). Firdaus et al. (2014) [6] said, the SWAT model can
analyze the best hydrological response based on the determination of conservation techniques.](https://image.slidesharecdn.com/ijciet1002036-190312061848/75/Ijciet-10-02_036-2-2048.jpg)
![Hydrological Characteristics Analysis Due to Changes in Land Use with the Swat Model in the
Koto Panjang Hydropower Catchment Area
http://www.iaeme.com/IJCIET/index.asp 332 editor@iaeme.com
Likewise, Singh et al. (2013) [7] said, the method used for calibration and validation using
SUFI-2 and GLUE from SWAT CUP.
The purpose of this study is to analyze the hydrological characteristics due to changes in
land use, and can provide recommendations on the best land use in the catchment area of Koto
Panjang Hydroelectric power.
3. MATERIALS AND RESEARCH METHOD
This research was conducted in the water catchment area of Koto Panjang Hydroelectric
Power Plant, in West Sumatra Province consisting of Pasaman District in Mapat Tunggul
Selatan District, Lima Puluh Kota District in Kapur IX Subdistrict, Bukit Barisan and
Pangkalan Koto Baru, in Riau Province within Kampar Regency consisting of Koto Kampar
Hulu Subdistrict and XIII Koto Kampar subdistrict.
Equipment needed are: soil sample testing equipment, GPS devices, computer devices,
GIS software, SWAT consisting of ArcSWAT and SWAT CUP SUFI 2.
The source of the research data consisted of Land use maps 2014, Image of Shuttle Radar
Topography Mission ( STRM) (30 x 30) m for Digital Elevation Model (DEM) data input
with scene numbers are ASTGTM2_N00E100 and ASTGTM2 _S01E100, Administrative
maps of Kampar, Pasaman, and Lima Puluh Kota year 2008, land use maps year 2014, maps
of the river, map soil type, slope class map, climate data (consisting of temperature, relative
humidity, wind, and solar radiation, rainfall data) year 2009 - 2014, discharge data and water
level of in the Koto Panjang Hydroelectric power catchment area year 2009 - 2014.
Several management scenarios in land use were simulated to determine the best land use
management in the catchment area of Koto Panjang Hydroelectric power. Stages of activities
consisting of collecting maps data, processing data input, and running SWAT models,
calibration and validation, outputs and land use management simulations. Collection of Maps
and Data consisting of; soil type map, land use map in 2011 and 2014 results of image
interpretation, slope class of land map, Digital Elevation Model (DEM), physical properties
data of soil from laboratory analysis based on soil samples in the catchment area, climate data,
and river maps.
Input data processing consisting of; Watersheed Deliniator delineated based on input
data in the form of DEM data, Hydrology Respont Unit (HRU) analysis based on land use
maps input data, slope class maps, soil type maps and physical properties data of soil tests.
Climate data base (Weather Data Generator) by creating climate generator data results from
calculation of rainfall data, temperature, solar radiation, humidity, and wind speed.
The Method of Running the SWAT Model is to describe the catchment area (Watersheed
Deliniator) with a stage consisting of: entering DEM data, determining the river network,
determining the catch outlet points, and calculating catch parameters. Conduct HRU
(Hydrology Respect Unit) analysis in the form of defining data input with an overlay between
year 2011 and 2014 land use maps with land maps, and slope classes. Providing climate data
other than rain to calculate evapranspiration using sampling methods in the form of air
temperature, air humidity, solar radiation and wind speed year 2009-2014 which must be
provided in the SWAT model. SWAT simulations are carried out by selecting a heating time
of 2 year from 1 January year 2009 to 31 December year 2010, which will be simulated in the
Run SWAT menu for land use year 2011 and 2014. The output data storage from the
simulation results is done by selecting the ReadSWAT Output sub-menu.
Calibration is a process of adjusting the combination of parameter values that affect the
hydrological conditions of on SWAT CUP SUFI 2, in obtaining the results of the model that](https://image.slidesharecdn.com/ijciet1002036-190312061848/75/Ijciet-10-02_036-3-2048.jpg)
![Nurdin, Syaiful Bahri, Zulkarnain, Sukendi
http://www.iaeme.com/IJCIET/index.asp 333 editor@iaeme.com
approaches the measurement results. Field measurement discharge data (discharge of
observation) was used, namely the period of January 1 year 2011 to December 31 year 2012
with land use in 2011. The calibration method used in the study was manual method with trial
and error. The calibration procedure follows Neitsch et al. (2011) [8]. Statistical analysis used
in calibration and validation is Nash Sutcliffe (NS) coefficient, and determination coefficient
(R²) :
a. Nash Sutcliffe (NS) coefficient,
i misi
i misi
QQ
QQ
NS 2
2
1 (1)
Where, NS = Nash Sutcliffe coefficient, QS1 = observation variable (actual discharge), Qm =
simulation result variable (model discharge), Ǭ = average variable (average measured
discharge). Nash Sutcliffe (NS) coefficient according to Moriasi et al. (2007) [9] consists of 4
classes: Very good, if 0.75 < NS ≤ 1.00, Good, if 0.65 < NS ≤ 0.75, Satisfactory, if 0.50 < NS
≤ 0.65, and less satisfactory if, NS < 0.50.
b. Determination coefficient (R²),
2
22
2
ssimmi
i sisimmi
QQQQ
QQQQ
R
(2)
Where, Qmi = observation variable (actual measured discharge), Ǭm = average observation
variable (measured average actual discharge), Qsi = model calculation variable (simulation
output discharge), Ǭs = the average model calculation variable (simulation result discharge),
with an R² value between 0 - 1 (Abbaspour, 2015) [10].
Validation aims to prove the consistency of the results of the SWAT model with
measurement discharge data in other periods in this case the debit data 1 January 2013 to 31
December 2014 with land use in 2014. The parameter values used in the validation process
are the same as the parameter values in the calibration process. Furthermore validation is
carried out for each planned land use management scenario.
Hydrological characteristics analysis due to land use change is based on 2011 and 2014
land use data simulated with the SWAT model, where input data consists of digital elevation
model (DEM) images with 30 m resolution, slope class maps, soil type maps and climate data
year 2009-2014. So that very important hydrological characteristics can be known in the form
of; the amount of total water (YLD WATER) discussed by Neitdch et al. (2011) [8], runoff
coefficient (C) and river regime coefficient (KRS) with small values use the following
equation:
Water Yield
pondtlossQQQWyld gwlatsurf
(3)
Where, Wyld = the total amount of water entering the main river / reservoir during the
simulation period (mm), Qsurf = surface flow to-i (mm), Qlat = lateral flow entering the main
river on the i-day ( mm), Qgw = subsurface flow or base-flow on day to-i (mm), tloss = water
lost from the river due to surface drainage (mm), and pond = water lost through water holding
ponds (embung / mm)](https://image.slidesharecdn.com/ijciet1002036-190312061848/75/Ijciet-10-02_036-4-2048.jpg)
![Hydrological Characteristics Analysis Due to Changes in Land Use with the Swat Model in the
Koto Panjang Hydropower Catchment Area
http://www.iaeme.com/IJCIET/index.asp 334 editor@iaeme.com
Runoff coefficient (C)
tahunan
tahunansurf
P
Q
C
(4)
Where, C = runoff coefficient, Qsurf-tahunan = annual surface flow (mm), Ptahunan = annual
rainfall (mm). The runoff coefficient (C) consists of 3 classes; good if, C < 0.25, medium if,
0.25 < C ≤ 0.50 and, bad if, 0.50 < C ≤ 1.0.
River regime coefficient (KRS),
(5)
Where; KRS = river regime coefficient, Qmax = highest annual average discharge (Q), Qmin
= lowest annual average discharge (Q). The coefficient of the River Regime (KRS) consists of
3 classes; good if, KRS < 50, medium if, 50 < KRS ≤ 120 dan, buruk jika, KRS > 120
To improve the hydrological characteristics in increasing the water yield in the catchment
area of Koto Panjang Hydroelectric power is with create a land use planning scenario as
below; 1. Applying a simple agroforestry pattern to agricultural cultivation areas (scenario I)
; 2. Applying complex agroforestry patterns to agricultural land areas (scenario II), and 3.
Implementing a simple and complex pattern of agoforestry in the area of agricultural land
(scenario III). So that the hydrological characteristics of each scenario can be analyzed
namely, surface flow (Qsurf), lateral flow (Qlat), and base flow (Qgw) in producing a better total
river water (WATER YLD).
4. RESULTS AND DISCUSSION
HRU analysis in the delineation process of the catchment area is based on three maps, namely
land use map, slope class, and soil type, land use and soil characteristics based on soil
physical properties. Soil data is data from the results of laboratory tests of the physical
properties of soil samples from the catchment area by the Riau Laboratory of Soil. HRU
analysis is carried out automatically by the SWAT program so as to produce a form of 60
HRU. Every HRU that is formed will produce hydrological characteristics in accordance with
the characteristics of each HRU. All hydrological characteristics of HRU that have been
formed with land use year and climate data for year 2011-2012 with SWAT model
simulations resulted in coefficients R² is 0.67 and NS is 0.59 before the calibration parameter
input was in a pretty good category. However, to get a better R² and NS value it needs to be
calibrated
4.1. Calibration
The calibration process uses SWAT CUP SUFI 2 with observation data year 2011-2012 is
done parameters input manually by trying to get 15 adjustable parameters consisting of 11
most sensitive parameters and 4 less sensitive parameters as in Table 1 . Mubarok et al.
(2015)[2] get 13 parameters that can be changed are CN2, ALPHA_BF, GW_DELAY,
GWQMN, RCHRG_DP, ESCO, EPCO, CH_N2, CH_K2, SOL_K, SOL_AWC, and
SURLAG.
minQ
Q
KRS maks
](https://image.slidesharecdn.com/ijciet1002036-190312061848/75/Ijciet-10-02_036-5-2048.jpg)
![Nurdin, Syaiful Bahri, Zulkarnain, Sukendi
http://www.iaeme.com/IJCIET/index.asp 335 editor@iaeme.com
Tabel 1 Absolute parameter that influence the R² and NS values using SWAT- CUP SUFI 2
Parameter Keterangan Fitted_
Value
Rentang Satuan
CN2
ALPHA_BF
(SCS Curve Number) Type of
land use based on soil hydrology
group
Basic flow alpha factor
36.37
0.67
35 – 98
0 - 1
-
day
GW_DELAY Groundwater recharging time 43.30 0 - 500 day
GWQMN The depth of the shallow aquifer
threshold is needed
321.68 0 - 5000 mm (H2O)
GW_REVAP Groundwater evaporation
coefficient
0.09 0.02 – 0.2 -
ESCO The factor of change in soil
evaporation
0.16 0 – 1 -
CH_N2 Manning roughness values on
the main channel
0,03 -0.01 – 0.3 -
CH_K2 Conductivity on the main
channel
254.69 -0.01 - 500 mm/jam
ALPHA_BNK asic flow factor for storage 0.16 0 – 1 day
SOL_AWC Water capacity is available in
the soil layer
0.73 0 – 1 mm(H2O)/m
m soil
SOL_K Hydraulic conductivity is
saturated
254.13 0 – 200 mm/jam
SOL_BD Density of soil type 0.89 0.9 – 2.5 g/cm³
SURLAG The surface flow pause
coefficient
4.16 0.05 - 24 day
USLE_P USLE land management factor 0.38 1 - 1 -
SLSUBBSN Long slope of surface flow 30.14 10 - 150 m
The results of the calibration process get the R² coefficient is 0.701, NS eficiensy is 0.75.
NS eficiensy of 0.75 is good classified (0.65 ≤ NS ≤ 0.75) based on Moriasi (2007) [9].
Hydrological characteristics for all HRUs formed after the calibration process based on
climate data and discharge observations year 2011 - 2012 with land use year 2011 with the
highest discharge of Qmax is 521,70 m³/sec and the Qmin is 43.61 m³/sec. The amount of PREC
is 3,387.24 mm, Qsurf is 644.19 mm with WATER YLD in the catchment area is 2,413.38 mm
so it is obtained the surface flow C coefficient is 0.19 classified of good according to
Pramono (2014) [11], KRS coefficient of catchment area is 11,949 < 50 classified of good in
accordance with Pramono (2014) [11].
4.2. Validation
The validation process aims to test the results of the calibration to other circumstances uses SWAT
CUP SUFI 2 with the observation discharge data used is the period of January 1, 2013 to December 31
year 2014 with land use year 2014 using the same parameters as the process of calibration . This
validation process gets the R² coefficient of 0.64, NS efficiency value is 0.60. The value of NS
efficiency is 0.60 in satisfactory classified (0 .50 < NS ≤ 0.65) according to Moriasi (2007) [9].
4.3. Changes In Land Use
Changes in land use that occurred between year 2011 and 2014 in the Koto Panjang
hydropower of cathment area presented in Table 2. Land conversion between year 2011 and
2014 in the form of a decrease in the primary dryland forest area is 7,137.92 ha and
Secondary dryland forerest is 2,528.25 ha, the broad decline in Mixed dry land agriculture is
74.61 ha, and shrubs is 990.72 ha and As a result, there was an increase in the area of
Plantattion is 1,183.56 ha, Residential area is 1,069.83 ha, Dry land agriculture to be 6,730.71](https://image.slidesharecdn.com/ijciet1002036-190312061848/75/Ijciet-10-02_036-6-2048.jpg)
![Hydrological Characteristics Analysis Due to Changes in Land Use with the Swat Model in the
Koto Panjang Hydropower Catchment Area
http://www.iaeme.com/IJCIET/index.asp 336 editor@iaeme.com
ha, and Open land is 1,828.37 ha. In 2014 the remaining forest area was 142,160.07 ha
(44.43%) > 30% as required by Law Number 41 year 1999. Better than when compared to
Sihotang (2012) [12] forest area in the Lake Toba catchment area only 23.83% and Maryanto
et al. (2013) [13] the extent of the Way Besay watershed forest area is only 13.60%.
Tabel 2 Landuse in Catchment Area of Kotopanjang hydroelectric power
Land use
Area 2011 Area 2014 Change
(ha) (%) (ha) (%) (ha) (%)
Primary dryland
forest
81.633,71 25,56 74.495,79 23,28
-
7.137,92
-2,28
Secondary dryland
forest
70.192,53 21,98 67.664,27 21,15
-
2.528,25
-0,83
Plantation 10.756,74 3,37 11.940,30 3,73 1.183,56 0,36
Residential area 948,13 0,30 2.017,96 0,63 1.069,83 0,33
Dry land agriculture 78.149,88 24,47 84.880,59 26,53 6.730,71 2,06
Mixed dry land
agriculture
72.877,65 22,82 71.886,93 22,47 -990,72 -0,35
Rice fields 3.502,80 1,10 4.042,19 1,26 539,38 0,17
Shrubs 360,79 0,11 286,17 0,09 -74,61 -0,02
Open land 916,89 0,29 2.745,26 0,86 1.828,37 0,57
Water body 10.984,33 10.363,97 -620,36
Land area 319.339,12 100,00 319.959,48 100,00 620,36 0,00
Catchment area 330.323,45 330.323,45 0,00
Show an increase in WATER YLD, where WATER YLD year 2011 is 2,413.38 mm while
the WATER YLD was much smaller is 1,008.63 mm. This happened because of the difference
in rainfall which was too large between year 2011 amounting to 3,387.24 mm, surface flow is
644.19 mm, Qlat is 1,489.92 mm, with C coefficient is 0.19. When compared with the small
amount of PREC in 2014, only 1,625.00 mm, the small amount of rainfall causes the soil
layer to absorb water on a large scale, where only a small portion of the Qsurf is 102.12 mm
and partly flow into the ground as Qlat is 821.25 mm and base flow Qgw is 80.27 mm, so that
C coefficient shows a decrease with a value is 0.063. The small C coefficient in 2014 could
be the main cause is the small amount of PREC that occurred in that year. Hydrological
characteristics as the effect of land use changes are presented in Table 3.
Tabel 3 Hydrological characteristics in Catchment Area of Kotopanjang hydroelectric power
Hydrograph component
Hydrological characteristics
2011 2014
Surface runoff (Qsurf) (mm) 644.19 102.12
Interflow (Qlat) (mm) 1,489.92 821.65
Base flow (Qgw) (mm) 264.81 80.57
Water yield (mm) 2,413.38 1,008.63
Coefficient of surface runoff ( C ) 0.190 0.063
Coefficient of river regim (KRS) 11.949 12.212
The surfce runoff coefficient obtained for land use year 2011 is 0.19 and land use year
2014 is 0.063 was still in line and better than Mubarok et al. (2015) [2] with coefficient C is
0.31 in the period year 2001 - 2006 classified as moderate (0.25 ≤ C ≤ 0.50) and the period of
year 2006 - 2010 was good (C < 0 , 25). Diferent Hidayat et al. (2014) [14] surface runoff
coefficient value C of 0.43 in the period year 1999-2003 and 0.43 in the period year 2004 -
2011 classified as moderate (0.25≤ C ≤ 0.50).](https://image.slidesharecdn.com/ijciet1002036-190312061848/75/Ijciet-10-02_036-7-2048.jpg)
![Nurdin, Syaiful Bahri, Zulkarnain, Sukendi
http://www.iaeme.com/IJCIET/index.asp 337 editor@iaeme.com
According to Mahmud et al. (2009) [16] if the ratio of maximum discharge to minimum
has a small value, it means that the flow of water occurs throughout the year, in other words
the ability of the soil to enter and exit water is still quite good.The Qmak and Qmin simulation
(model) occurred at land use 2011 respectively 521.70 m³ / sec and 43.61 m³ / sec with a KRS
value is 11.949. For land use year 2014 the Qmak and Qmin simulation (model) respectively
521.70 m³/sec and 42.72 m³/sec with a KRS value is 12.212. The KRS value for land use year
2011, and 2014 respectively 11,949 and 12,212 < 50 , based on the classification by Pramono
et al. (2014) [12] as good classification. With the value of the KRS 2011 and 2014 were still
relatively good it can be said that, in the span of one month for the entire year the flow of
water flowing in controlled fluctuations.
The KRS value obtained is smaller and better than KRS value from the results of Hidayat
et al. (2014) [15], in the period 1999 - 2011 the KRS value in the Ciujung watershed was
between 83 - 163 (while was bad), and Mubarok et al. (2015) [2] the KRS values in the Way
Betung watershed 2001, 2006 and 2010 were 30.65, 66.25, and 53.57 respectively (good-
medium) and Mahmud et al. (2009) [16] with the KRS values in the Serang watershed in 2004
- 2007 between 69 - 200 (while - bad).
Based on the primary and secondary dryland forest area, the remaining 44.33% > 30% as
required, and in line with KRS that are still relatively good, the most appropriate step to take
is to make the cultivation area this agriculture can approach forest functions. Thus, it can
minimize the flow of surfaces that enter the river so that the falling rainfall can be absorbed
mostly as lateral flow, and the basic flow and finally produce a stable Water Yield. To
maintain agricultural cultivation can approach forest functions is to manage agricultural
cultivation areas with the application of agroforestry patterns.
4.4. Effect of Land Change on Hydrological Characteristics
According to Rendra et a.l (2016) [17] agroforestry is also a land use system that is carried
out with various technologies through the use of annual crops, annual crops, and/or livestock
at the same time or taking turns in certain periods so that ecological, social and economic
interactions are formed. Agroforestry systems have more advantages than other land use
systems.
Land use management with agroforestry patterns is planned in the form of simple and
complex agroforestry in agricultural cultivation areas which are simulated using the SWAT
hydrological model in three scenarios namely: scenario I simple agroforestry is planned in dry
land agriculture, plantations, rice fields, open land with a land area is 103,608, 34 ha (32.38%)
of the land area of the catchment area; scenario II complex agroforestry is planned in dry land
agriculture mixed with shrubs, shrubs with an area is 72,273.11 ha (22.56%) of the land area
of the the catchment area ; scenario III simple agroforestry and complex agoforestry on
scenario I and II is 175,881.45 ha (54.94%) of the land area of the the catchment area. The
Hydrological characteristics of results the scenario of the management of the use of
agricultural cultivation areas with a simple and complex agroforestry pattern in the Koto
Panjang Hydroelectric power plant catchment area are presented in Table 4. While the KRS
value based on the maximum and minimum discharge by carrying out scenario I - III is
presented in Table 5.
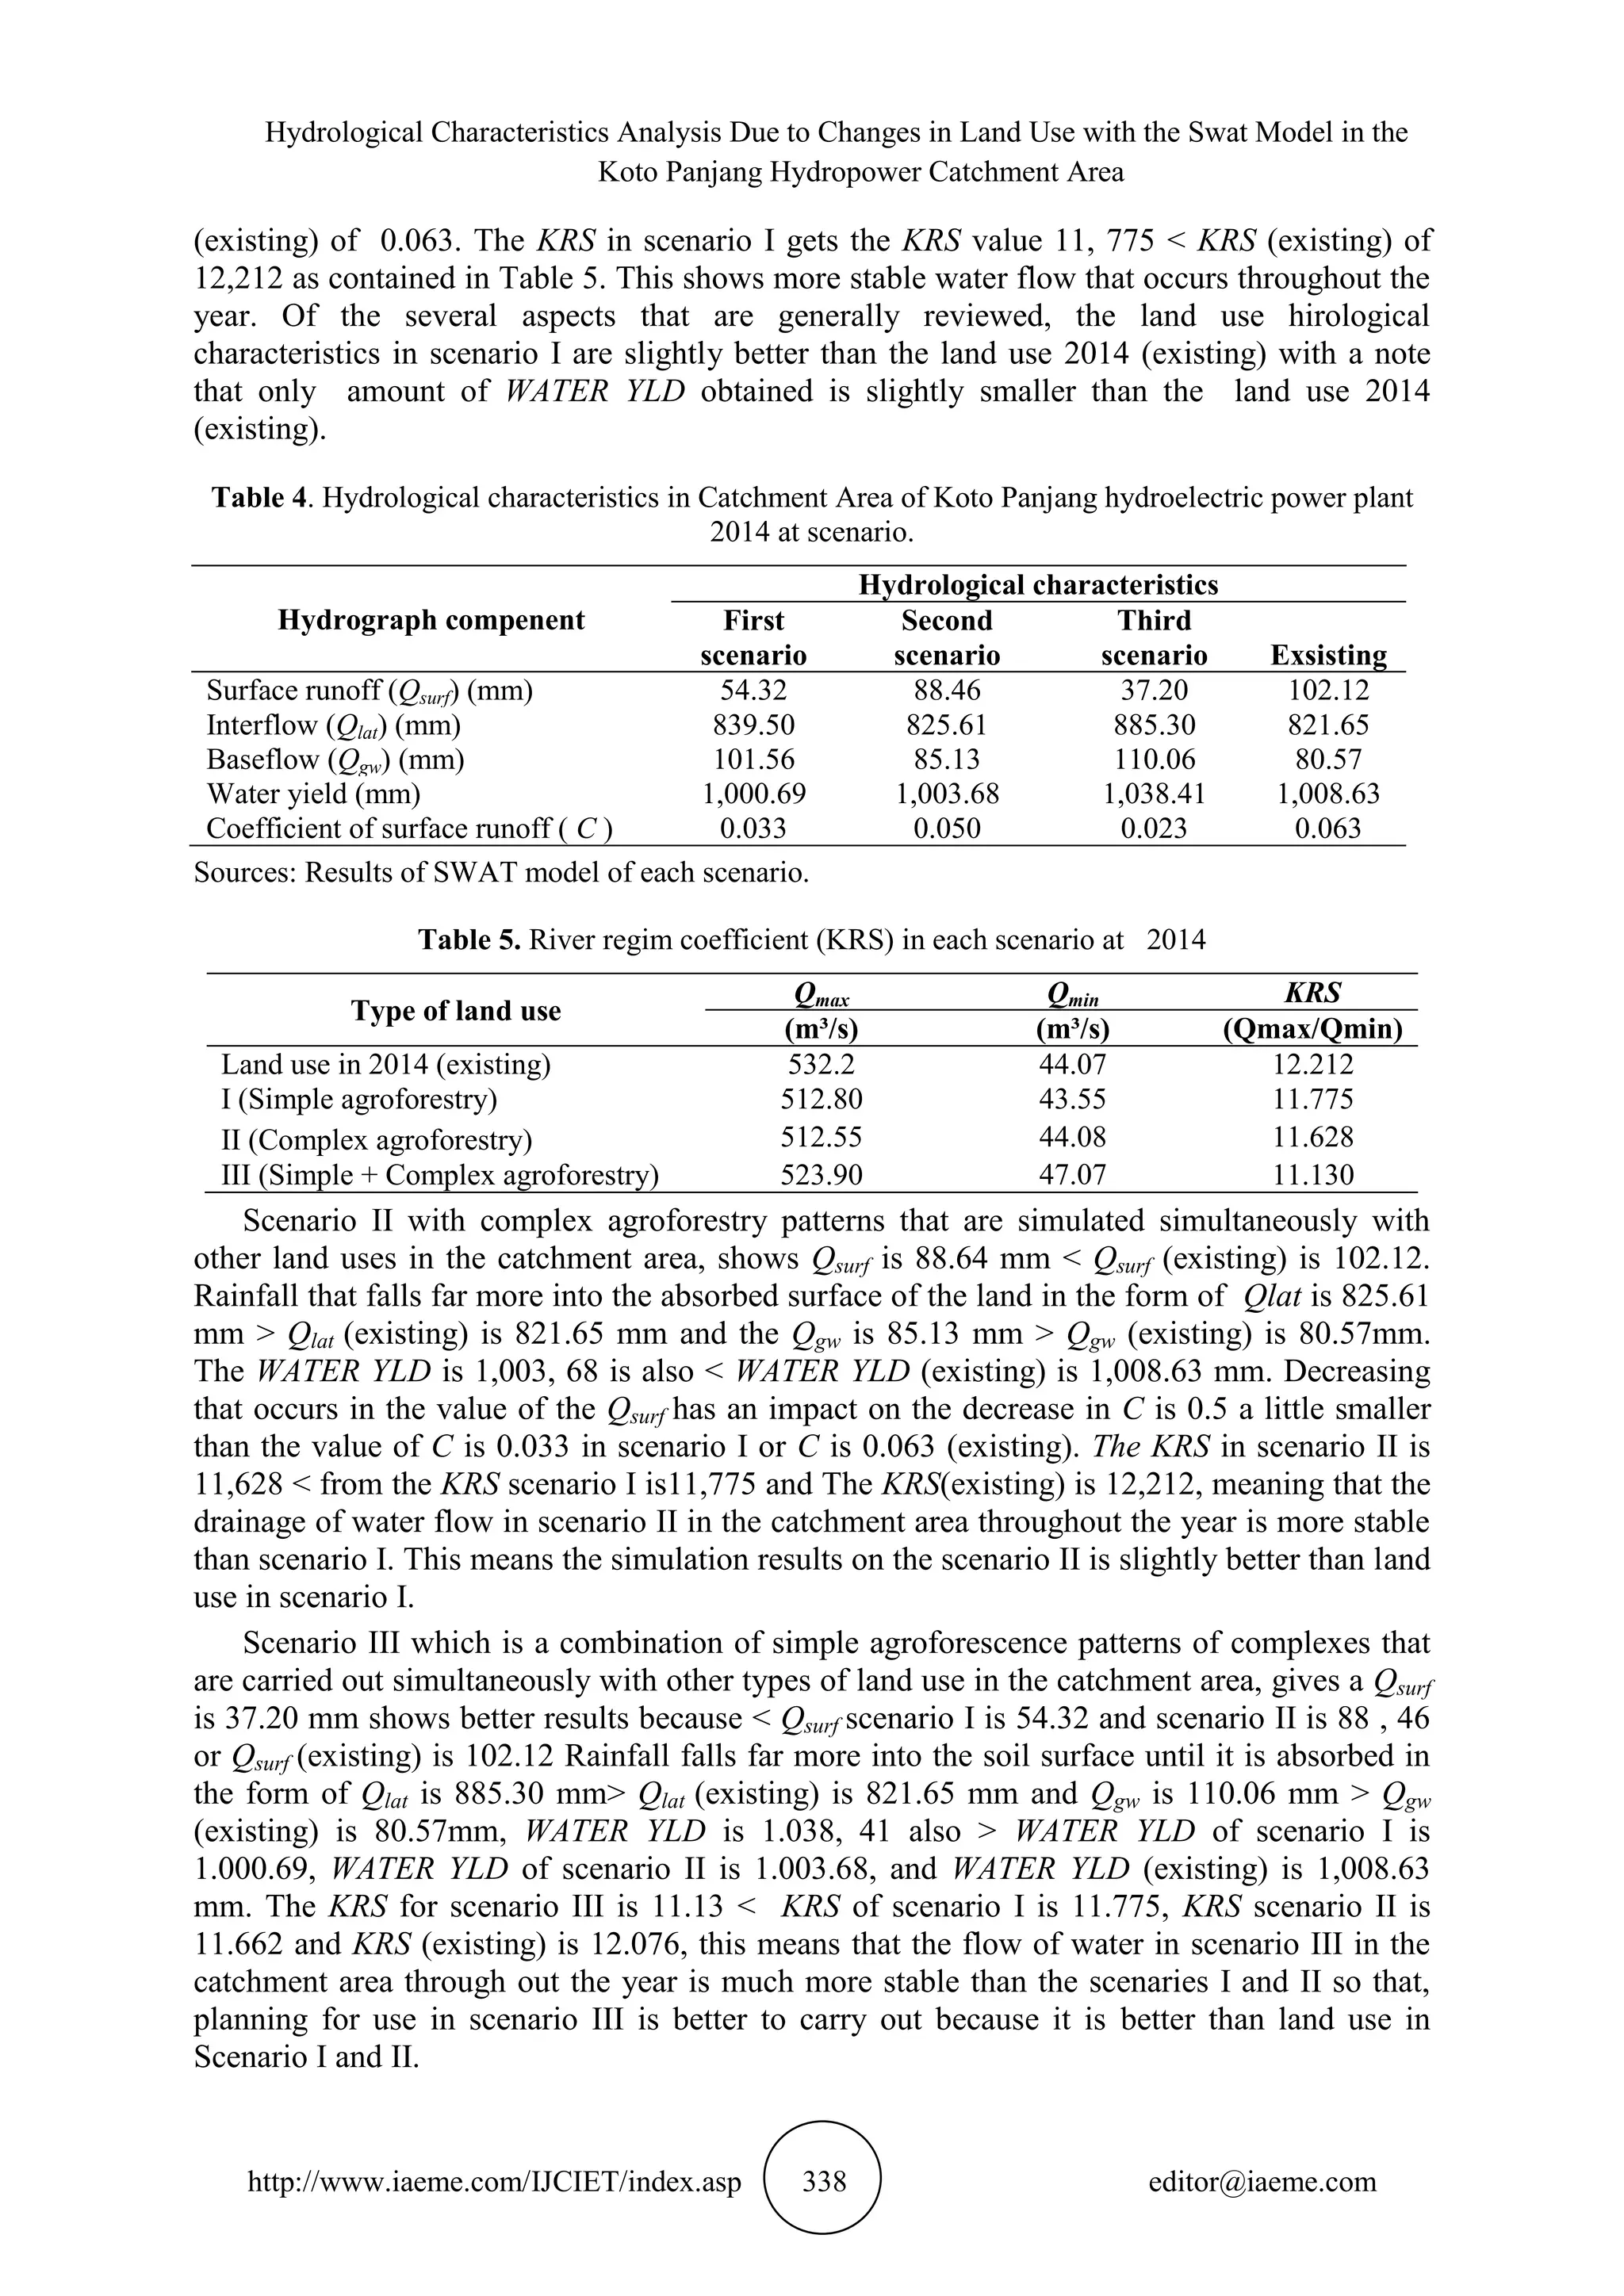
In scenario I with a simple agroforestry pattern by simulating together with other land
uses in the catchment area, the results show Qsurf is 54.32 mm < QSurf of land use year 2014
(existing) is 102.12 mm, this indicates that rainfall that has fallen can be absorbed in the form
of Qlat is 839.50 mm > Qlat (existing) is 821.65 mm and the Qgw is 101.56 mm > Qgw
(existing) of 80.57mm, but WATER YLD is 1.000,69 < WATER YLD (existing) of 1,008.63
mm. From the decrease in the value Qsurf also has an effect in reducing C is 0.033 < C](https://image.slidesharecdn.com/ijciet1002036-190312061848/75/Ijciet-10-02_036-8-2048.jpg)
![Nurdin, Syaiful Bahri, Zulkarnain, Sukendi
http://www.iaeme.com/IJCIET/index.asp 339 editor@iaeme.com
5. ONCLUSIONS AND SUGGESTIONS
5.1. Conclusions
The results of a study on the analysis of the response of hydrological characteristics as a result
of changes in land use in the Koto Panjang Hydroelectric power plant catchment area resulted
in the following conclusions;
1. The best characteristics of the three land cover planning scenarios are, water yield (WATER
YLD) is 1,038, 41 mm, runoff coefficient (C) is 0,023 and river regime coefficient (KRS) is
11,13
2. The land cover model recommended in the Kotopanjang hydropower catchment is scenario
III (simple and complex agroforestry pattern)
5.2. Suggestions
To carry out the pattern of simple and complex agroforesri land use simultaneously in this
agricultural cultivation area, an authority body that should be formed for those concerned with
the Koto Panjang Hydroelectric power plant catchment area consists of elements of PT. PLN,
Riau Provincial Government, West Sumatra Province Government and Forum or An
interested public institution.
THANK-YOU NOTE
Gratitude is conveyed to PT. PLN (Persero) Generation of Northern Sumatra Pekanbaru
Generation Sector who has provided data and permission to conduct research in the Koto
Panjang Hydroelectric of cathment area, Thank you also to BPDASHL Indragiri Rokan and
BWS Sumatera III who have provided data in this research.
REFERENCES
[1] Suasti, Y. D., Herman, and Ahyuni, Impact of population growth on land conversion in
Padang City, Directorate of Population and National Family Planning Population Impacts,
Jakarta, 2012.
[2] Mubarok, Z., K. Murtilaksosno, dan E. D. Wahjunie, Study of land use change response
to the hirological characteristics of Way Betung - Lampung watershed, Journal of
Wallacea Forestry Research, 4(1), 2015, pp. 1 – 10.
[3] Mulyadi, A., Electricity Industry of Koto Panjang Hydroelectric Power Plant Vs
environmental problems, Journal of Industrial and Urban, 3(13), 2003, pp. 625 – 63.
[4] Mustiono, I.D., Study of community economic activities on the environmental
sustainability of the Koto Panjang Hydroelectric Power Plant Cthment Area of Kampar
Regency, Jurnal of Environmental Science, 2010, pp. 54 – 62.
[5] Tarigan, R., Regional economic theory and revised edition applications, PT. Bumi Aksara,
Jakarta, 2005.
[6] Firdaus, G., O. Haridjaja, and S. D. Tarigan, Analysis of the hydrological response to the
application of soil conservation techniques in the Lengkong Sub watershed using the
SWAT model, Jurnal of Environmental Land, 16(1),2014, pp.16 – 23.
[7] Singh, V., N. Bankar, S. S. Salunkhe, A. K. Bera, and J. R. Sharma, 2013. Hydrological
stream flow modelling on Tungabhadra catchment: parameterization anduncertainty
analysis using SWAT CUP, RESEARCH ARTICLES CURRENT
SCIENCE,104(9),2013, pp. 1187 – 1199.](https://image.slidesharecdn.com/ijciet1002036-190312061848/75/Ijciet-10-02_036-10-2048.jpg)
![Hydrological Characteristics Analysis Due to Changes in Land Use with the Swat Model in the
Koto Panjang Hydropower Catchment Area
http://www.iaeme.com/IJCIET/index.asp 340 editor@iaeme.com
[8] Neitsch, S. L., J. G. Arnold, J. R. Kiniry, and J. R. Williams, Soil And Water Assessment
Tool Theoretical DocumentationVersion 2009, Soil and Water Reasearch Laboratory-
Agricultural Research Service Blackland Reasearch Center – Texes Agrilife Research,
Texes Water Resources Institute Technical Report No. 406, Texes A&M University
Sistem Colege Station, Texes, 2011.
[9] Moriasi, D. N., J. G. Arnold, M. W. Van Liew, R. L. Biginer, R. H. Marmel, and T. L.
Veith, Model Evaluation Guidelines for Sistematic Quantification of Accuracy in
Watershed Simulations, Journal ASABE,50(3), 2007, pp. 885 – 900.
[10] Abbaspour, K. C., 2015. SWAT-CUP : SWAT calibration and uncertainty progrms-a user
manual, Ewag : Swiss Federal Institute of Aquatic Technology, 2015.
[11] I. B. Pramono, E. Savitri, S. Donie, and T. M. Basuki. 2014. System of catchment area
management reservoir, Forest Technology Research Institute of Watershed Management,
Ministry of Environment and Forestry, Surakarta, 2014.
[12] Sihotang, H., Lake Toba's conservation model of water resources. Dissertation. Graduate
School of Bogo Agricultural Institute. Bogor, 2012.
[13] Maryanto, A., K, Murtilaksono, and L. M. Rachman, 2014. Planning land use and its
effects on water resources in the Way Besai-Lampung watershed, Journal of Wallacea
Forestry Research, 3(2), 2014, pp. 85 – 95.
[14] Hidayat,Y., L. M. Rachman, and S. D. Tarigan, Study of the impact of land use change on
the flow of the Ciujung watershed, Journal of Infrastructure,4(2), 2014, pp. 78 – 85.
[15] Mahmud, H. Joko, and S. Susanto, 2009. Assessment of watershed status (case study of
Serang sub watershed), Journalof AGRITECH, 29(4), 2009, pp. 198 – 207.
[16] Rendra, P.P.R., N. Sulaksana, and B.Y.C.S.S.S. Alam, 2016. Optimization of the use of
agroforestry systems as a form of adaptation and migration of landslides, Bulletin of
Scientific Contribution, 14(2), 2016, pp. 117 - 126.
[17] SS.Asadi, V.Abhlash Reddy and G.Sandeep Kumar, Evaluation of Land Use/Land Cover
on Mining Area: A Model Study, International Journal of Mechanical Engineering and
Technology 9(1), 2018. pp. 873–880
[18] Jayesh Juremalani and Krupesh A. Chauhan, Evaluation of Urban Accessibility Through
Travel Behavior For Mixed Land Use Zones, International Journal of Civil Engineering
and Technology (IJCIET), 10 (1), 2019, pp. 233–241.
[19] A. A. Adegun, N.O. Akande, R. O. Ogundokun and E.O. Asani, Image Segmentation And
Classification Of Large Scale Satellite Imagery For Land Use: A Review Of The State Of
The Arts, International Journal of Civil Engineering and Technology, 9(11), 2018, pp.
1534–1541.](https://image.slidesharecdn.com/ijciet1002036-190312061848/75/Ijciet-10-02_036-11-2048.jpg)

This study analyzes hydrological characteristics changes in the Koto Panjang hydropower catchment area due to land use changes using the SWAT model. The results indicate significant effects on water yield and runoff coefficients, suggesting that implementing agroforestry patterns can improve water stability. Recommendations include enhancing land use management to maintain hydrological balance and support sustainable agriculture.


