


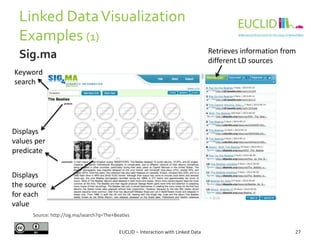
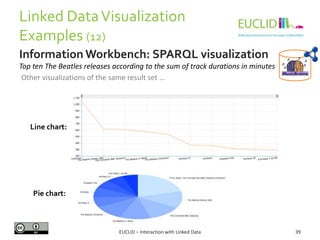
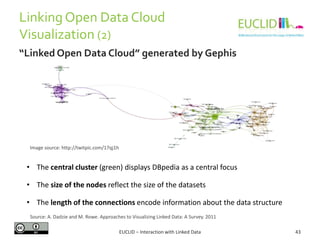
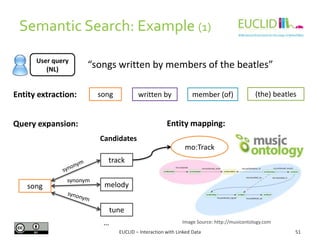
![R for SPARQL: Example (2)
EUCLID – Interaction with Linked Data 82
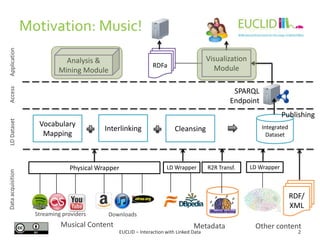
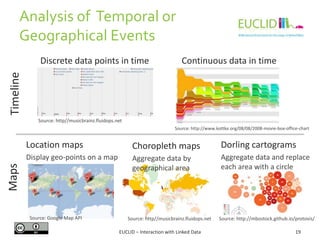
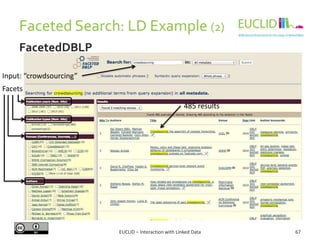
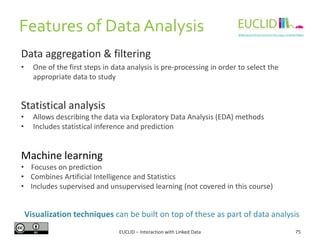
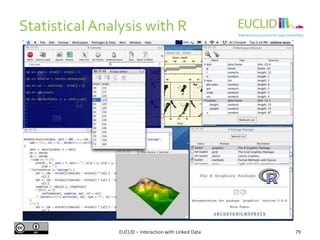
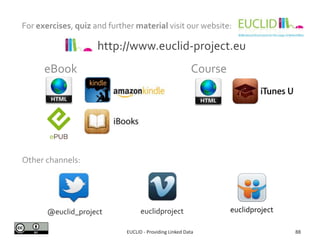
4. Link the result to an object
• res <- SPARQL(endpoint,q)$results
5. Handling the results
• res$row <- -res$row
• coordinates(res) <- ~col - row
6. Chose the graphical format and plot the results
• spplot(res,"DEFOR_2002",col.regions=rev(heat.colors(
17))[-1], at=(0:16)/100, main="relative
deforestation per pixel during 2002")
Source: http://linkedscience.org/tools/sparql-package-for-r](https://image.slidesharecdn.com/interactionwithld-130616093515-phpapp01/85/Interaction-with-Linked-Data-82-320.jpg)

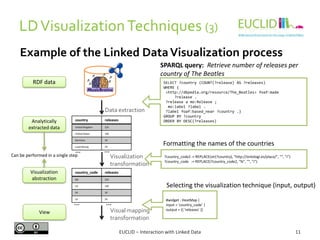
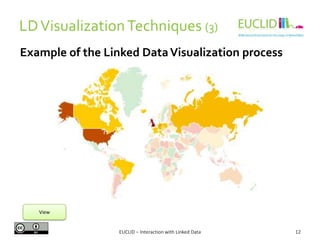
This document discusses interaction with linked data, focusing on visualization techniques. It begins with an overview of the linked data visualization process, including extracting data analytically, applying visualization transformations, and generating views. It then covers challenges like scalability, handling heterogeneous data, and enabling user interaction. Various visualization techniques are classified and examples are provided, including bar charts, graphs, timelines, and maps. Finally, linked data visualization tools and examples using tools like Sigma, Sindice, and Information Workbench are described.