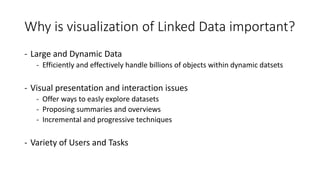
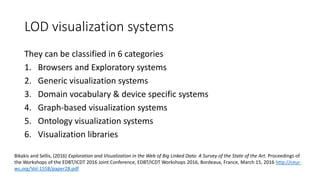
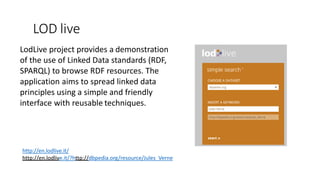
Talk at 3th Keystone Training School - Keyword Search in Big Linked Data - Institute for Software Technology and Interactive Systems, TU Wien, Austria, 2017
Northern New England Tableau User Group (TUG) May 2024
Linked Open Data Visualization
1. Linked Data Visualization
3th Keystone Training School - Keyword Search in Big Linked Data
Institute for Software Technology and Interactive Systems, TU Wien, Austria
Laura Po, PhD
Department of Engineering "Enzo Ferrari"
University of Modena and Reggio Emilia
Italy
2.
3. Goal of the Talk
• To provide practical skills required for exploring LOD sources
• The importance of visualization
• How a Linked Data Visualization Process can be defined
• Practical use of LOD/ RDF browsers and visualization toolkits
Outline
4. Why is visualization of Linked Data important?
- Large and Dynamic Data
- Efficiently and effectively handle billions of objects within dynamic datsets
- Visual presentation and interaction issues
- Offer ways to easly explore datasets
- Proposing summaries and overviews
- Incremental and progressive techniques
- Variety of Users and Tasks
5. BOLD – Big Open Linked Data
"The bigger the number, the harder it can be to visualise"
Bratsas et al (2016), Preface on special session “data impact: Big, open, linked data innovations” at 11th International Workshop on Semantic and Social Media Adaptation and Personalization (SMAP) https://doi.org/10.1109/SMAP.2016.7753368
Dwivedi et al, (2017) Driving innovation through big open linked data (BOLD): Exploring antecedents using interpretive structural, Inf Syst Front (2017) 19:197–212 https://link.springer.com/article/10.1007/s10796-016-9675-5
Saxena, (2017) BOLD (Big and Open Linked Data): what’s next?, Library Hi Tech News, Vol. 34 Issue: 5, pp.10-13, https://doi.org/10.1108/LHTN-04-2017-0020
Craig, (2016), BOLD: The power and potential of Big Open Linked Data, Published on 11 Oct 2016 on the Thomson Reuters Blog https://blogs.thomsonreuters.com/answerson/bold-power-potential-big-open-linked-data/
6. Why visualize data instead of provide statistic
analysis?
http://en.wikipedia.org/wiki/Anscombe's_quartet
• Anscombe's
quartet of datasets
having similar
statistical
properties but
appearing very
different when
plotted
8. LOD Visualization
• LOD simplifies accessing and integrating data from different sources
• SPARQL makes it easy to select from, and analyse the data
• It's natural to visualise the data as graphs (networks)
… but other forms of visualisation also possible
9. RDF Graph
Reference for the picture: http://www.obitko.com/tutorials/ontologies-semantic-web/rdf-graph-and-syntax.html
12. LOD visualization systems
They can be classified in 6 categories
1. Browsers and Exploratory systems
2. Generic visualization systems
3. Domain vocabulary & device specific systems
4. Graph-based visualization systems
5. Ontology visualization systems
6. Visualization libraries
Bikakis and Sellis, (2016) Exploration and Visualization in the Web of Big Linked Data: A Survey of the State of the Art. Proceedings of
the Workshops of the EDBT/ICDT 2016 Joint Conference, EDBT/ICDT Workshops 2016, Bordeaux, France, March 15, 2016 http://ceur-
ws.org/Vol-1558/paper28.pdf
13. Evolution over time
Marie and Gandon, (2014) Survey of Linked Data Based Exploration Systems, Proceedings of the 3rd International Workshop on Intelligent Exploration of
Semantic Data (IESD 2014) co-located with the 13th International Semantic Web Conference (ISWC 2014), Riva del Garda, Italy, October 20, 2014
http://ceur-ws.org/Vol-1279/iesd14_8.pdf
14. Exploratory search
• Exploratory search systems (ESS) forms a special category of seeking
information on the Web with the purpose of revealing related
information to the searcher along with retrievals of what have been
searched for.
Palagi, et al. (2017), A Survey of Definitions and Models of Exploratory Search. Proceedings of the 2017 ACM Workshop on Exploratory Search and
Interactive Data Analytics. ACM, http://doi.acm.org/10.1145/3038462.3038465
Marie,(2015) , Linked data based exploratory search. PhD Thesis, Université Nice Sophia, Antipolis, https://tel.archives-ouvertes.fr/tel-01130622
16. Hoefler, Patrick, et al. "Linked Data
Query Wizard: A Novel Interface for
Accessing SPARQL
Endpoints." LDOW. 2014.
http://code-research.eu/
EU project 2012-2014
https://code.know-center.tugraz.at/search
17. TEST
• Using CODE Linked Data Query Wizard search for "Johann Strauss II"
within the Dbpedia source
• Explore the result
• Add columns that show some property like "birth place", "given
name", "music composer of ", ...
20. TEST
• Navigate the Linked Jazz cloud
• Change the visualization option (fized, similar, gender, dynamic)
21. LOD live
LodLive project provides a demonstration
of the use of Linked Data standards (RDF,
SPARQL) to browse RDF resources. The
application aims to spread linked data
principles using a simple and friendly
interface with reusable techniques.
http://en.lodlive.it/
http://en.lodlive.it/?http://dbpedia.org/resource/Jules_Verne
22.
23. TEST
By using LodLive online to explore dbpedia resources, search for Johann
Strauss II http://en.lodlive.it/
- who is he?
- where was he born? where did he died?
- Is he the son of Johann Strauss?
- find which type are associated to him
24.
25. LODmilla
Micsik, András, Sándor Turbucz, and Zoltán
Tóth. "Exploring publication metadata graphs
with the LODmilla browser and
editor." International Journal on Digital
Libraries 16.1 (2015): 15-24.
Micsik, András, Sándor Turbucz, and Zoltán
Tóth. "Browsing and traversing linked data with
lodmilla." ERCIM News 2014.96 (2014): 35-36.
http://lodmilla.sztaki.hu/lodmilla
26. TEST
Using LODMilla search and add the following node from Dbpedia:
• Johann Strauss II
• Vienna
• The Blue Danube
• Austria
• Johann Strauss I
• Wolfgang Amadeus Mozart
• Composer
• Musician
• Look at the connections between nodes
27. LODEX
It is a tool for producing a representative summary of a Linked open Data (LOD)
source starting from scratch, thus supporting users in exploring and
understanding the contents of a dataset.
LODeX extracts statistical indexes that uses to build the representative summary, by
quering the SPARQL endpoint of a LOD source.
• LODeX 2.0 (http://www.dbgroup.unimo.it/lodex2 ) includes the possibility to
compose visual queries by selecting objects from the representative summary of
a LOD source
• LODeX Cluster (http://www.dbgroup.unimo.it/lodex2/testCluster ) provides a
more concise schema for huge datasets
28. LODeX Architecture
LOD Cloud
SPARQL
Queries
LODeX
Post-
processing
Statistical
Indexes
LODeX
Indexes
Extraction
Endpoint
URLs
Schema
Summary
NoSQL
SPARQL
Queries
Schema
Summary
Query
Orchestrator
Schema
Summary
Visualizzation
Basic
QueryResults
Benedetti, et al. (2015), Exposing the Underlying Schema of LOD Sources. 2015 IEEE/WIC/ACM International Conference on Web Intelligence and Intelligent Agent Technology (WI-IAT)
(IEEE) ISBN: 9781467396189
Benedetti, et al. (2015), Visual Querying LOD sources with LODeX. Proceedings of the 8th International Conference on Knowledge Capture (ACM)
Benedetti, et al. (2015), LODeX: A tool for Visual Querying Linked Open Data. Proceedings of the ISWC 2015 Posters & Demonstrations Track @ (ISWC 2015), n. volume 1486
Benedetti, et al. (2014), A Visual Summary for Linked Open Data sources. ISWC 2014 Posters & Demo Track, Riva del Garda, Italy, ISSN: 1613-0073
Benedetti, et al. (2014), Online Index Extraction from Linked Open Data Sources. Second International Workshop on Linked Data for Information Extraction (LD4IE) @ (ISWC 2014), Riva del
Garda, Italy, ISSN: 1613-0073
29. A running example
ex:Sector foaf:Organization
owl:Class
ex:sector
“sector”
rdf:type rdf:type
rdf:Propertyrdf:type
owl:ObjectProperty
rdf:type
sector1 organization1ex:sector
dc:title
“Energy”
Extensional
Classes
Extensional
Knowledge
Intensional
Knowledge
ex:activity
“Village electrification
in the Pacific”
organization2 “+41331231”
rdfs:label
rdfs:label
rdfs:domain
rdf:type
ex:sector
rdf:type rdf:type
dbpedia:fax
person1
foaf:Person
ex:activity
“Paolo”
rdf:type
ex:ceo
rdf:type foaf:firstName
foaf:lastName “Rossi”
The information contained in the Intensional knowledge can be incomplete
or absent
32. TEST
By using Lodex http://www.dbgroup.unimore.it/lodex2/ find, navigate and
explore the following datasets:
• European Television Heritage
• How many classes it has? How many properties it has?
• How many vocabulary are used?
• Nobel Prizes
• How many vocabulary are used?
• Define a query that select person (label, gender,name) that won a Nobel Prize ,
i.e.have an Award (year,label), add also the Category of the Award if it exists
33. Conclusions
• Analysis of the needs for visualization in the LOD context
• Practical use of some LOD browsers and visualization toolkits
• Navigation and exploration of some datasets and the construction of
different visualizations
34. Actual limitations and challenges
• Most of the LOD visualization tools are still in-lab prototypes
• Lots tools allow the exploration of a limited list of datasets or have
limitations in terms of size, format (SPARQL endpoint/RDF dumps) of the
datasets they can explore
• SPARQL endpoints might be offline or have bad performance such as taking
long time to respond to some queris.
• For dealing with BOLD, graph simplification is needed:
• reducing size could be possible through filtering or aggregation
36. Feel free to contact me at
laura.po@unimore.it
You can find more information on
my research and my group at
www.dbgroup.unimore.it
Slide are available on
http://www.slideshare.net/polaura