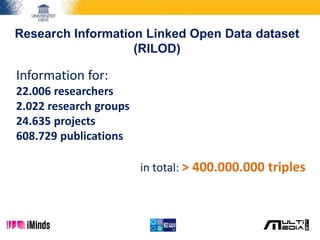
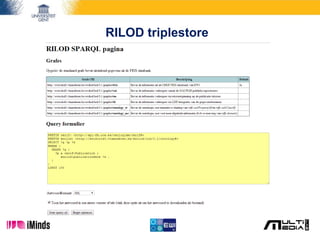
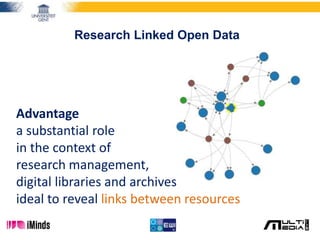
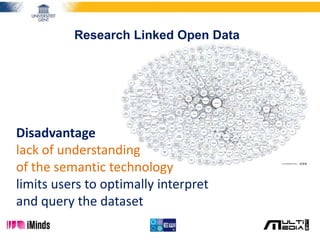
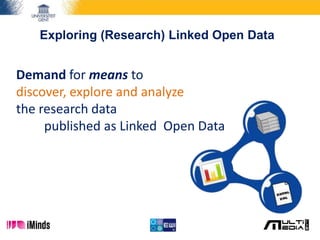
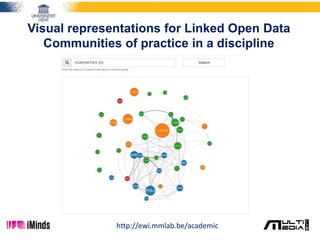
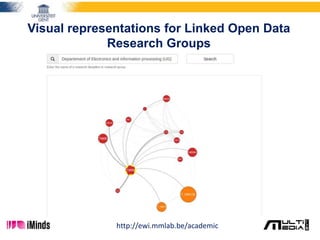
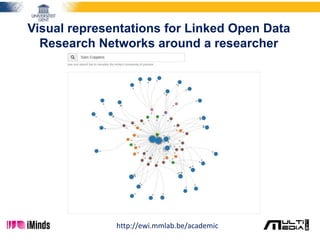
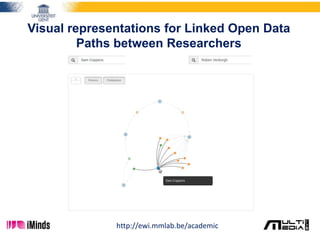
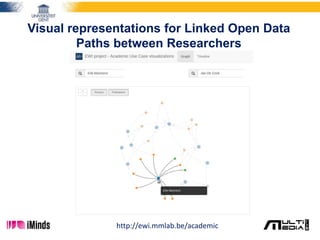
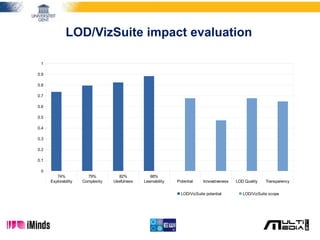
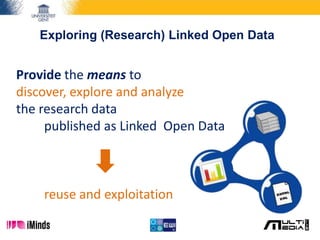
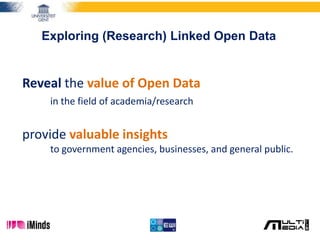
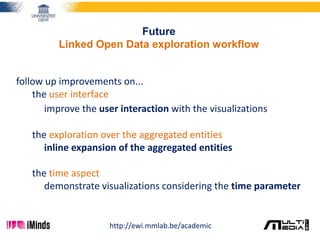
A
Visualizing the information
of a Linked Open Data enabled
Research Information System
Anastasia Dimou1, Laurens De Vocht1,
Geert Van Grootel2, Leen Van Campe2, Jeroen Latour3,
Erik Mannens1, and Rik Van de Walle1
1Ghent University – iMinds – Multimedia Lab
2Flemish Government, Department of Economy, Science and Innovation
3IBM Netherlands
CRIS2014, Rome, Italy, 13th May 2014
@natadimou anastasia.dimou@ugent.be ewi.mmlab.be/academic
Research Information Linked Open Data
(RILOD)
Data source:
Flemish research institutions
Flemish Academic Bibliographic Database (VABB)
Research Information Linked Open Data
(RILOD) dataset
Research Information Linked Open Data dataset
(RILOD)
Information for:
22.006 researchers
2.022 research groups
24.635 projects
608.729 publications
in total: > 400.000.000 triples
RILOD ontologies:
CERIF + EWILOD + IWETO DISCIPLINES
Research Information Linked Open Data
(RILOD) dataset
Graphs:
oai  information obtained from the OAI-PMH public repositories
fris  information obtained from the CERIF FRIS database (projects)
tm  information obtained from text mining of the publications
RILOD Architecture
RILOD triplestore
Research Linked Open Data
Advantage
a substantial role
in the context of
research management,
digital libraries and archives
ideal to reveal links between resources
Research Linked Open Data
Disadvantage
lack of understanding
of the semantic technology
limits users to optimally interpret
and query the dataset
Exploring (Research) Linked Open Data
Demand for means to
discover, explore and analyze
the research data
published as Linked Open Data
A visual demonstration
of the resources represented
as Linked Open Data
and their links
to let users
explore, discover and analyze
the dataset’s content
Visual representations for Linked Open Data
The user gets familiar with the dataset
no explicit assumption regarding the dataset
the dataset itself reveals its underlying model
and the relationships between its resources
LOD/VizSuite for RILOD
Visual representations for Linked Open Data
Communities of practice in a discipline
http://ewi.mmlab.be/academic
Visual representations for Linked Open Data
Research Groups
http://ewi.mmlab.be/academic
Visual representations for Linked Open Data
Research Networks around a researcher
http://ewi.mmlab.be/academic
Visual representations for Linked Open Data
Paths between Researchers
http://ewi.mmlab.be/academic
Visual representations for Linked Open Data
Paths between Researchers
http://ewi.mmlab.be/academic
LOD/VizSuite
Timelines
http://ewi.mmlab.be/academic
LOD/VizSuite architecture
http://thedatatank.com/
http://ceur-ws.org/Vol-996/papers/ldow2013-paper-04.pdf
LOD/VizSuite for RILOD
Monitoring...
the research activity
Research Networks
the existence and the nature of collaborations →
Collaboration networks and
Communities of practice
the evolution over time → Timelines
complementary information → Charts
LOD/VizSuite technical evaluation
LOD/VizSuite impact evaluation
74% 79% 82% 88%
Explorability Complexity Usefulness Learnability Potential Innovativeness LOD Quality Transparency
0
0.1
0.2
0.3
0.4
0.5
0.6
0.7
0.8
0.9
1
LOD/VizSuite potential LOD/VizSuite scope
Exploring (Research) Linked Open Data
Provide the means to
discover, explore and analyze
the research data
published as Linked Open Data
reuse and exploitation
Exploring (Research) Linked Open Data
Reveal the value of Open Data
in the field of academia/research
provide valuable insights
to government agencies, businesses, and general public.
Future
Linked Open Data exploration workflow
follow up improvements on...
the user interface
improve the user interaction with the visualizations
the exploration over the aggregated entities
inline expansion of the aggregated entities
the time aspect
demonstrate visualizations considering the time parameter
http://ewi.mmlab.be/academic
Future
Linked Open Data exploration workflow
Integrate
LOD/VizSuite + ResXplorer
offer a graph-based interactive visual workflow
for the exploration of Research Linked Open Data
http://dl.acm.org/citation.cfm?id=2579039
http://ResXplorer.org http://ewi.mmlab.be/academic
Conclusions
Novel visual representations for exploring research resources
User interfaces based on graph visualizations
and enhanced with optimized search in Linked Data.
Enables
to view and navigate through
combined aspects of research data
to come up spontaneously with observations
whose reasoning can be directly investigated
Visualizing the information
of a Linked Open Data enabled Research
Information System
LOD/VizSuite: http://ewi.mmlab.be/academic
EWILOD: http://ewilod.be/ewilod/html/sparql-test.html
LOD Experimental platform project: http://ewi.mmlab.be
Contact us
Anastasia Dimou anastasia.dimou@ugent.be @natadimou
Geert Van Grootel geert.vangrootel@ewi.vlaanderen.be @Department_EWI

Visualizing the information of a Linked Open Data enabled Research Information System

  • 1.
    A Visualizing the information ofa Linked Open Data enabled Research Information System Anastasia Dimou1, Laurens De Vocht1, Geert Van Grootel2, Leen Van Campe2, Jeroen Latour3, Erik Mannens1, and Rik Van de Walle1 1Ghent University – iMinds – Multimedia Lab 2Flemish Government, Department of Economy, Science and Innovation 3IBM Netherlands CRIS2014, Rome, Italy, 13th May 2014 @natadimou anastasia.dimou@ugent.be ewi.mmlab.be/academic
  • 2.
    Research Information LinkedOpen Data (RILOD) Data source: Flemish research institutions Flemish Academic Bibliographic Database (VABB) Research Information Linked Open Data (RILOD) dataset
  • 3.
    Research Information LinkedOpen Data dataset (RILOD) Information for: 22.006 researchers 2.022 research groups 24.635 projects 608.729 publications in total: > 400.000.000 triples
  • 4.
    RILOD ontologies: CERIF +EWILOD + IWETO DISCIPLINES
  • 5.
    Research Information LinkedOpen Data (RILOD) dataset Graphs: oai  information obtained from the OAI-PMH public repositories fris  information obtained from the CERIF FRIS database (projects) tm  information obtained from text mining of the publications
  • 6.
  • 7.
  • 8.
    Research Linked OpenData Advantage a substantial role in the context of research management, digital libraries and archives ideal to reveal links between resources
  • 9.
    Research Linked OpenData Disadvantage lack of understanding of the semantic technology limits users to optimally interpret and query the dataset
  • 10.
    Exploring (Research) LinkedOpen Data Demand for means to discover, explore and analyze the research data published as Linked Open Data
  • 11.
    A visual demonstration ofthe resources represented as Linked Open Data and their links to let users explore, discover and analyze the dataset’s content
  • 12.
    Visual representations forLinked Open Data The user gets familiar with the dataset no explicit assumption regarding the dataset the dataset itself reveals its underlying model and the relationships between its resources
  • 13.
  • 14.
    Visual representations forLinked Open Data Communities of practice in a discipline http://ewi.mmlab.be/academic
  • 15.
    Visual representations forLinked Open Data Research Groups http://ewi.mmlab.be/academic
  • 16.
    Visual representations forLinked Open Data Research Networks around a researcher http://ewi.mmlab.be/academic
  • 17.
    Visual representations forLinked Open Data Paths between Researchers http://ewi.mmlab.be/academic
  • 18.
    Visual representations forLinked Open Data Paths between Researchers http://ewi.mmlab.be/academic
  • 19.
  • 20.
  • 21.
    LOD/VizSuite for RILOD Monitoring... theresearch activity Research Networks the existence and the nature of collaborations → Collaboration networks and Communities of practice the evolution over time → Timelines complementary information → Charts
  • 22.
  • 23.
    LOD/VizSuite impact evaluation 74%79% 82% 88% Explorability Complexity Usefulness Learnability Potential Innovativeness LOD Quality Transparency 0 0.1 0.2 0.3 0.4 0.5 0.6 0.7 0.8 0.9 1 LOD/VizSuite potential LOD/VizSuite scope
  • 24.
    Exploring (Research) LinkedOpen Data Provide the means to discover, explore and analyze the research data published as Linked Open Data reuse and exploitation
  • 25.
    Exploring (Research) LinkedOpen Data Reveal the value of Open Data in the field of academia/research provide valuable insights to government agencies, businesses, and general public.
  • 26.
    Future Linked Open Dataexploration workflow follow up improvements on... the user interface improve the user interaction with the visualizations the exploration over the aggregated entities inline expansion of the aggregated entities the time aspect demonstrate visualizations considering the time parameter http://ewi.mmlab.be/academic
  • 27.
    Future Linked Open Dataexploration workflow Integrate LOD/VizSuite + ResXplorer offer a graph-based interactive visual workflow for the exploration of Research Linked Open Data http://dl.acm.org/citation.cfm?id=2579039 http://ResXplorer.org http://ewi.mmlab.be/academic
  • 28.
    Conclusions Novel visual representationsfor exploring research resources User interfaces based on graph visualizations and enhanced with optimized search in Linked Data. Enables to view and navigate through combined aspects of research data to come up spontaneously with observations whose reasoning can be directly investigated
  • 29.
    Visualizing the information ofa Linked Open Data enabled Research Information System LOD/VizSuite: http://ewi.mmlab.be/academic EWILOD: http://ewilod.be/ewilod/html/sparql-test.html LOD Experimental platform project: http://ewi.mmlab.be Contact us Anastasia Dimou anastasia.dimou@ugent.be @natadimou Geert Van Grootel geert.vangrootel@ewi.vlaanderen.be @Department_EWI