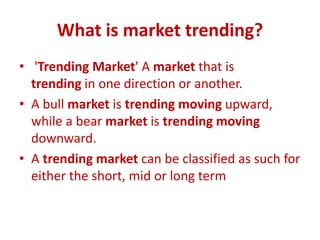
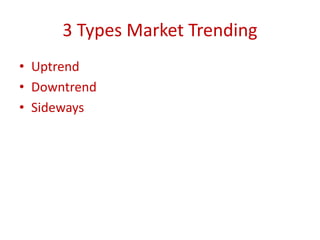
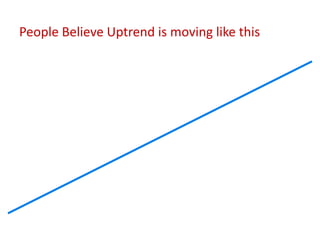
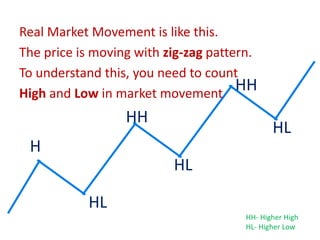
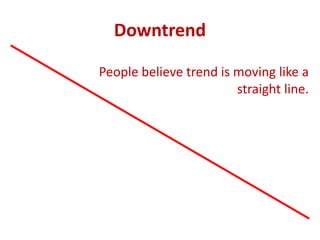
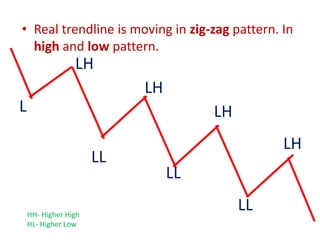
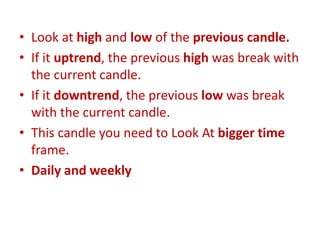
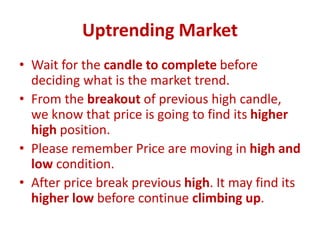
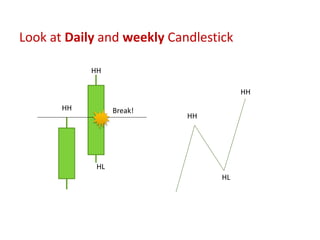
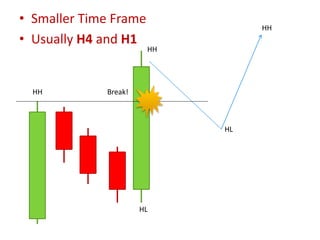
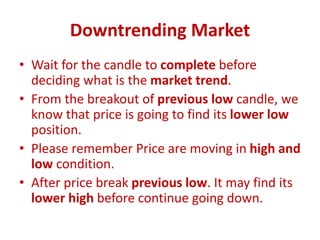
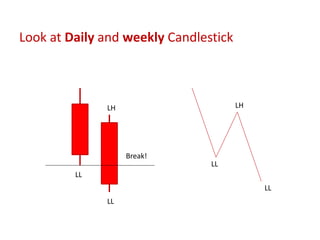
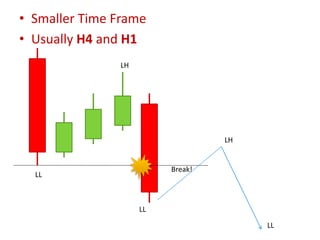
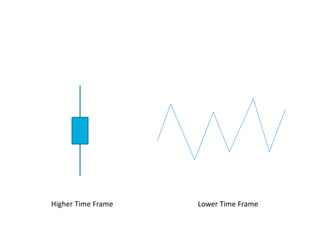
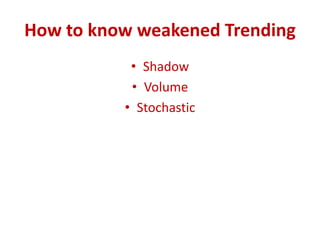
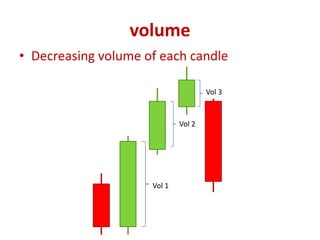
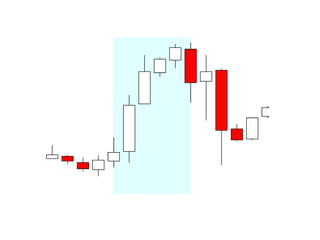
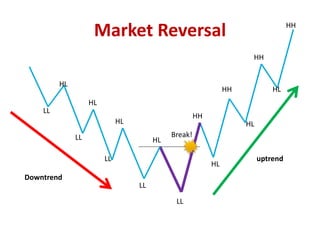
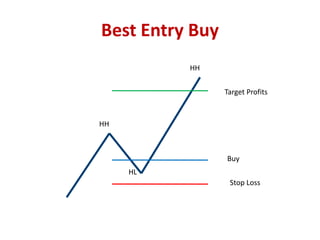
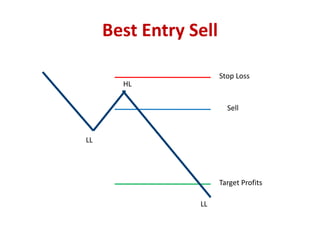
Forex Lesson 3 :
Market Trending
Forex Tips & Trading Strategy For You
Disclaimer
This Document is for educational purpose only.
By viewing this you agree that it is general educational material and you will not hold
anybody responsible for loss resulting from the content provided by pipsumo website.
Forex currency trading have large potential rewards but also large potential risk.
Don’t put your Money that you can’t afford to loose.
Market Trending
Forex Lesson 3
• Trending Market
– 3 Types Market Trending
– Understand Market Structure
– 3 ways to know weakened trending market.
– Trending Reversal
– Best entry on trending market.
What is market trending?
• 'Trending Market' A market that is
trending in one direction or another.
• A bull market is trending moving upward,
while a bear market is trending moving
downward.
• A trending market can be classified as such for
either the short, mid or long term
Chart
• OHLC is Open, High, Low and Close
• We can know the information from
candlesticks.
OHLC
open
close
high
low
high
open
close
low
3 Types Market Trending
• Uptrend
• Downtrend
• Sideways
Uptrend
People Believe Uptrend is moving like this
Real Market Movement is like this.
The price is moving with zig-zag pattern.
To understand this, you need to count
High and Low in market movement
H
HH
HL
HL
HL
HH
HH- Higher High
HL- Higher Low
Downtrend
Downtrend
People believe trend is moving like a
straight line.
• Real trendline is moving in zig-zag pattern. In
high and low pattern.
L
LH
LL
LH
LH
LH
LL
LLHH- Higher High
HL- Higher Low
Confirmation
• Break! High/low
• In order for you to know the market are
trending.
• You need to count the high and low.
• Look at high and low of the previous candle.
• If it uptrend, the previous high was break with
the current candle.
• If it downtrend, the previous low was break
with the current candle.
• This candle you need to Look At bigger time
frame.
• Daily and weekly
Uptrend
Uptrending Market
• Wait for the candle to complete before
deciding what is the market trend.
• From the breakout of previous high candle,
we know that price is going to find its higher
high position.
• Please remember Price are moving in high and
low condition.
• After price break previous high. It may find its
higher low before continue climbing up.
Break!
HH
HL
Look at Daily and weekly Candlestick
HL
HH
HH
HH
HH Break!
HL
• Smaller Time Frame
• Usually H4 and H1
HL
HH
HH
Downtrend
Downtrending Market
• Wait for the candle to complete before
deciding what is the market trend.
• From the breakout of previous low candle, we
know that price is going to find its lower low
position.
• Please remember Price are moving in high and
low condition.
• After price break previous low. It may find its
lower high before continue going down.
Break!
LL
LHLH
LL
Look at Daily and weekly Candlestick
LL
LL
• Smaller Time Frame
• Usually H4 and H1
LH
Break!
LL
LH
LL
LL
Sideways
• Sideways happened when there is not much
price moving.
• If we look at the higher time frame,
candlestick formed as doji.
• The market are indecisive.
• Some of traders, they don’t trade at this
market condition.
Higher Time Frame Lower Time Frame
How to know weakened Trending
• Shadow
• Volume
• Stochastic
Shadow
• By looking at the shadow. The longer the
shadow. The higher the pressure from the
opposite trader.
shadow
volume
• Decreasing volume of each candle
Vol 1
Vol 2
Vol 3
Stochastic
• Stochastis is use for trend confirmation.
• This is to know what market condition is
overbought/oversold.
• You can just use the standard settings indicator
of stochastic.
• 5,3,3
• %K - 5 , %D - 5 , Slowing – 3
• Stochastic use to support your decision on
looking at the market trending.
overbought
oversold
Click here to download
• If you want to know more about stochastic
and divergence, you can download this ebook.
Market Reversal
HH
HL
HH
HL
HH
HL
HH
HL
LL
HL
HL
LL
LL
LL
LL
HL
Break!
Downtrend
uptrend
Best Entry Buy
Target Profits
Buy
Stop Loss
HH
HL
HH
Best Entry Sell
Target Profits
Sell
Stop Loss
LL
LL
HL
Forex Trending
• For More Forex Trending to discover, can also
download this ebook.
Conclusion
• Market is moving in high and low condition.
• To determine the market trending, always
refer to higher time frame.
• Entry at smaller time frame
Forex Lesson 4
• Forex Strategy
– 3 killer candlestick reversal signal
– How to trade forex with candlestick reversal
– Parabolic SAR and moving average strategy
– Settings on indicator
– Entry in the market
visit

Forex lesson 3 market trending

  • 1.
    Forex Lesson 3: Market Trending
  • 2.
    Forex Tips &Trading Strategy For You Disclaimer This Document is for educational purpose only. By viewing this you agree that it is general educational material and you will not hold anybody responsible for loss resulting from the content provided by pipsumo website. Forex currency trading have large potential rewards but also large potential risk. Don’t put your Money that you can’t afford to loose.
  • 3.
  • 4.
    Forex Lesson 3 •Trending Market – 3 Types Market Trending – Understand Market Structure – 3 ways to know weakened trending market. – Trending Reversal – Best entry on trending market.
  • 5.
    What is markettrending? • 'Trending Market' A market that is trending in one direction or another. • A bull market is trending moving upward, while a bear market is trending moving downward. • A trending market can be classified as such for either the short, mid or long term
  • 6.
    Chart • OHLC isOpen, High, Low and Close • We can know the information from candlesticks.
  • 7.
  • 8.
    3 Types MarketTrending • Uptrend • Downtrend • Sideways
  • 9.
  • 10.
    People Believe Uptrendis moving like this
  • 11.
    Real Market Movementis like this. The price is moving with zig-zag pattern. To understand this, you need to count High and Low in market movement H HH HL HL HL HH HH- Higher High HL- Higher Low
  • 12.
  • 13.
    Downtrend People believe trendis moving like a straight line.
  • 14.
    • Real trendlineis moving in zig-zag pattern. In high and low pattern. L LH LL LH LH LH LL LLHH- Higher High HL- Higher Low
  • 15.
    Confirmation • Break! High/low •In order for you to know the market are trending. • You need to count the high and low.
  • 16.
    • Look athigh and low of the previous candle. • If it uptrend, the previous high was break with the current candle. • If it downtrend, the previous low was break with the current candle. • This candle you need to Look At bigger time frame. • Daily and weekly
  • 17.
  • 18.
    Uptrending Market • Waitfor the candle to complete before deciding what is the market trend. • From the breakout of previous high candle, we know that price is going to find its higher high position. • Please remember Price are moving in high and low condition. • After price break previous high. It may find its higher low before continue climbing up.
  • 19.
    Break! HH HL Look at Dailyand weekly Candlestick HL HH HH HH
  • 20.
    HH Break! HL • SmallerTime Frame • Usually H4 and H1 HL HH HH
  • 21.
  • 22.
    Downtrending Market • Waitfor the candle to complete before deciding what is the market trend. • From the breakout of previous low candle, we know that price is going to find its lower low position. • Please remember Price are moving in high and low condition. • After price break previous low. It may find its lower high before continue going down.
  • 23.
    Break! LL LHLH LL Look at Dailyand weekly Candlestick LL LL
  • 24.
    • Smaller TimeFrame • Usually H4 and H1 LH Break! LL LH LL LL
  • 25.
    Sideways • Sideways happenedwhen there is not much price moving. • If we look at the higher time frame, candlestick formed as doji. • The market are indecisive. • Some of traders, they don’t trade at this market condition.
  • 26.
    Higher Time FrameLower Time Frame
  • 27.
    How to knowweakened Trending • Shadow • Volume • Stochastic
  • 28.
    Shadow • By lookingat the shadow. The longer the shadow. The higher the pressure from the opposite trader. shadow
  • 30.
    volume • Decreasing volumeof each candle Vol 1 Vol 2 Vol 3
  • 32.
    Stochastic • Stochastis isuse for trend confirmation. • This is to know what market condition is overbought/oversold. • You can just use the standard settings indicator of stochastic. • 5,3,3 • %K - 5 , %D - 5 , Slowing – 3 • Stochastic use to support your decision on looking at the market trending.
  • 34.
  • 36.
    Click here todownload • If you want to know more about stochastic and divergence, you can download this ebook.
  • 37.
  • 38.
    Best Entry Buy TargetProfits Buy Stop Loss HH HL HH
  • 39.
    Best Entry Sell TargetProfits Sell Stop Loss LL LL HL
  • 40.
    Forex Trending • ForMore Forex Trending to discover, can also download this ebook.
  • 41.
    Conclusion • Market ismoving in high and low condition. • To determine the market trending, always refer to higher time frame. • Entry at smaller time frame
  • 42.
    Forex Lesson 4 •Forex Strategy – 3 killer candlestick reversal signal – How to trade forex with candlestick reversal – Parabolic SAR and moving average strategy – Settings on indicator – Entry in the market
  • 43.