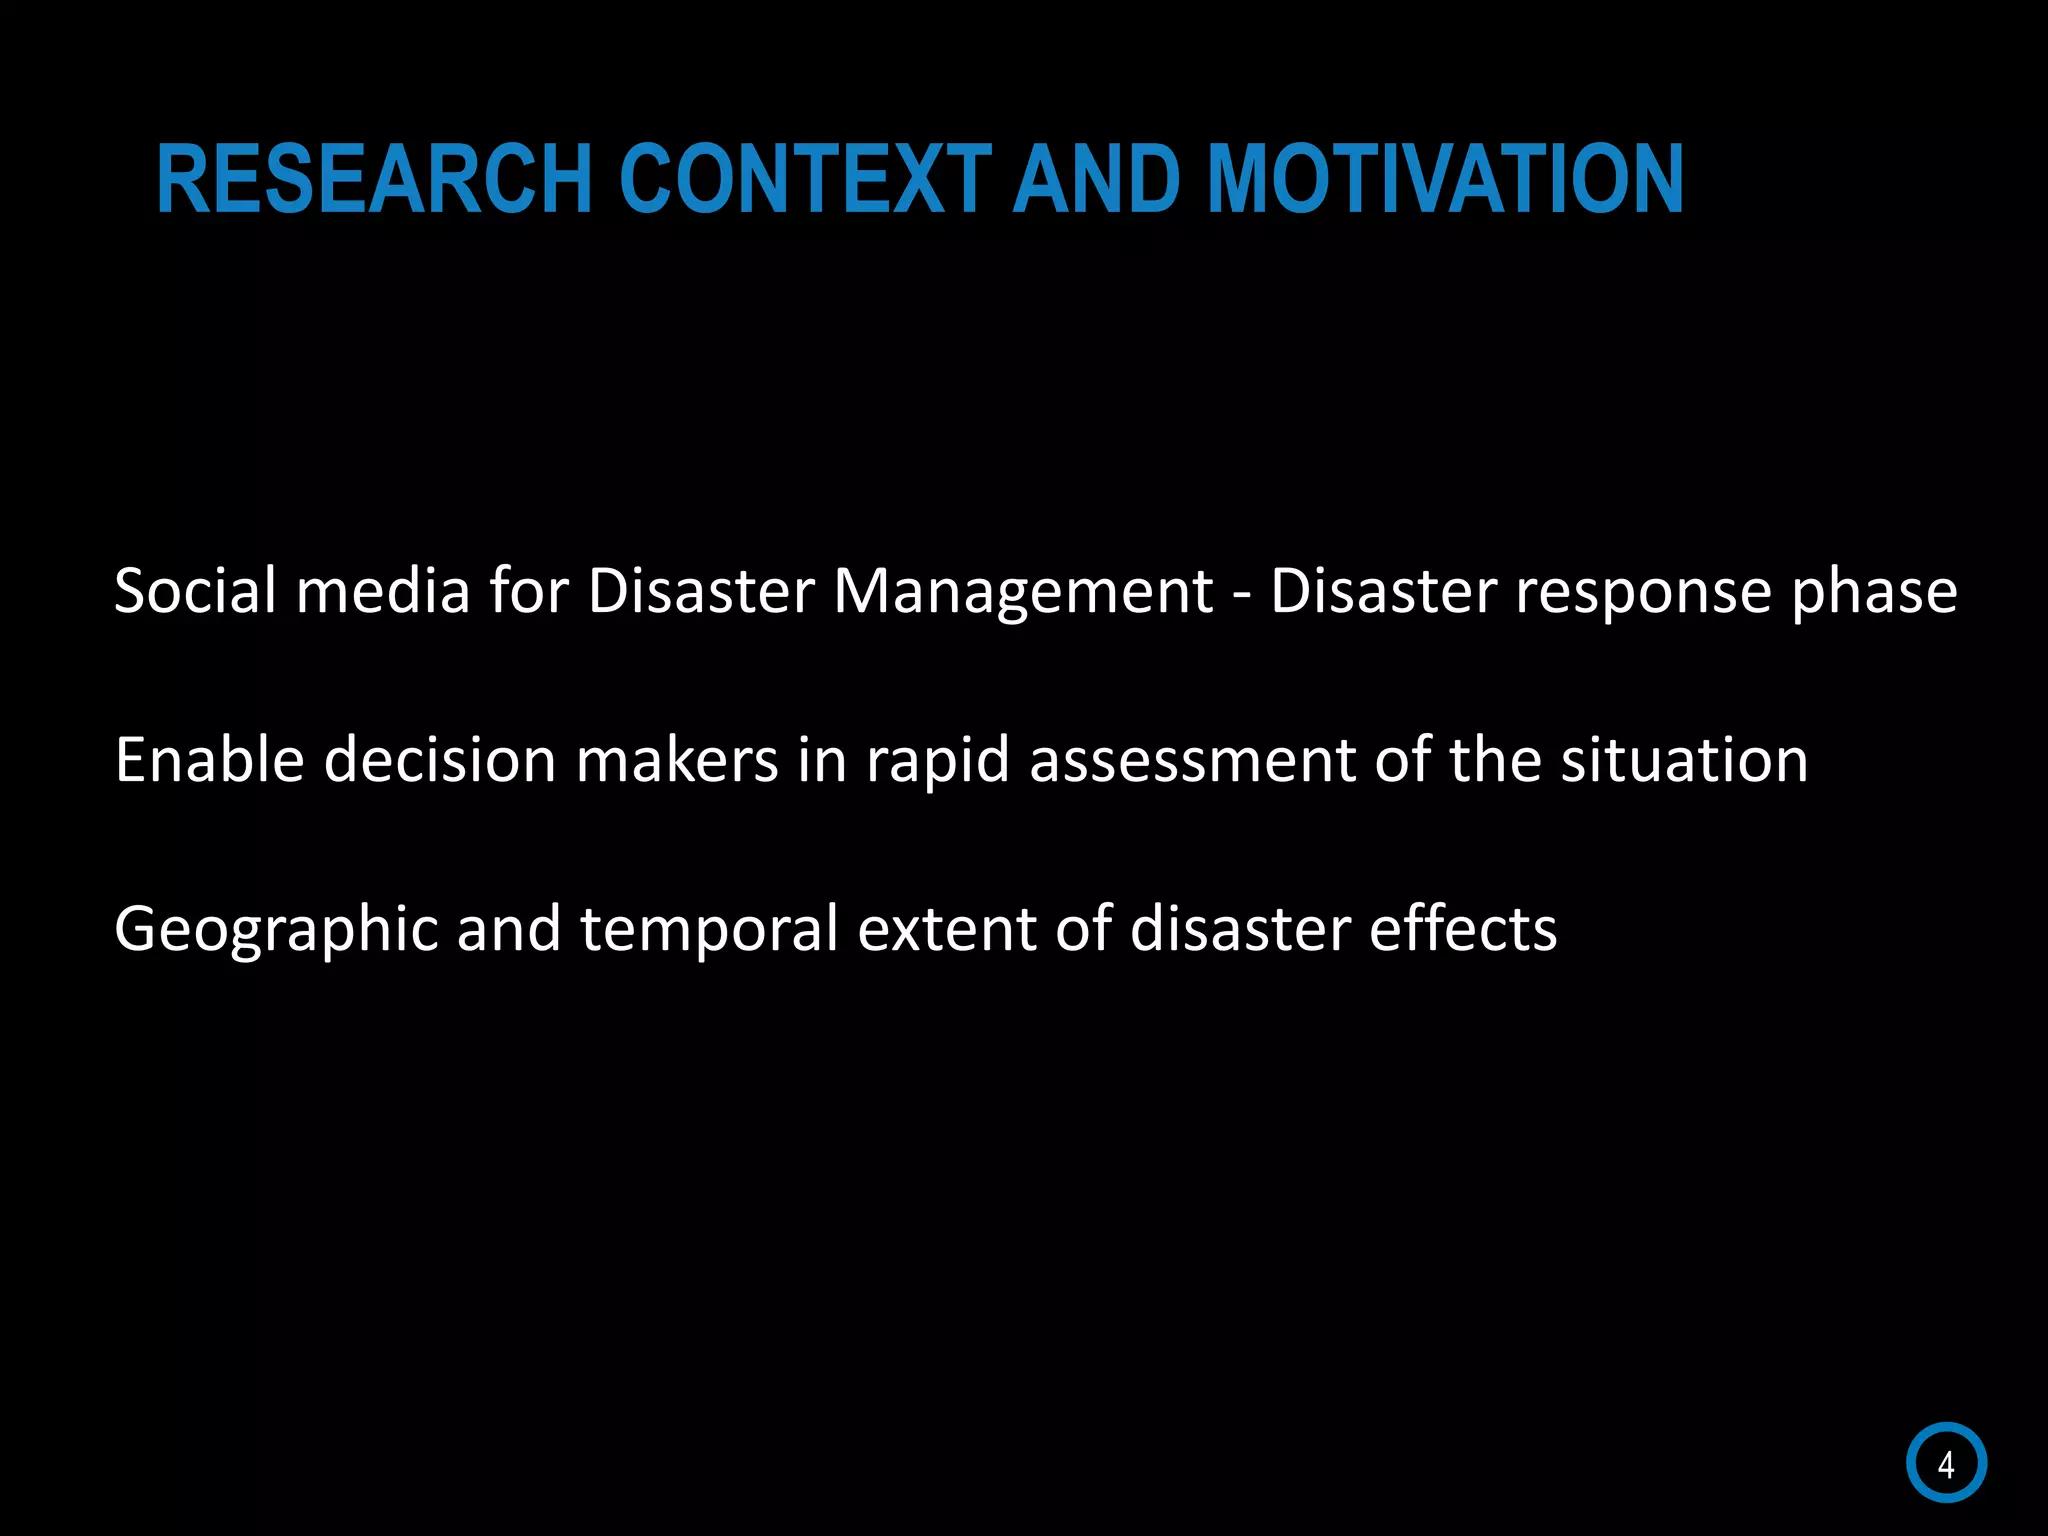
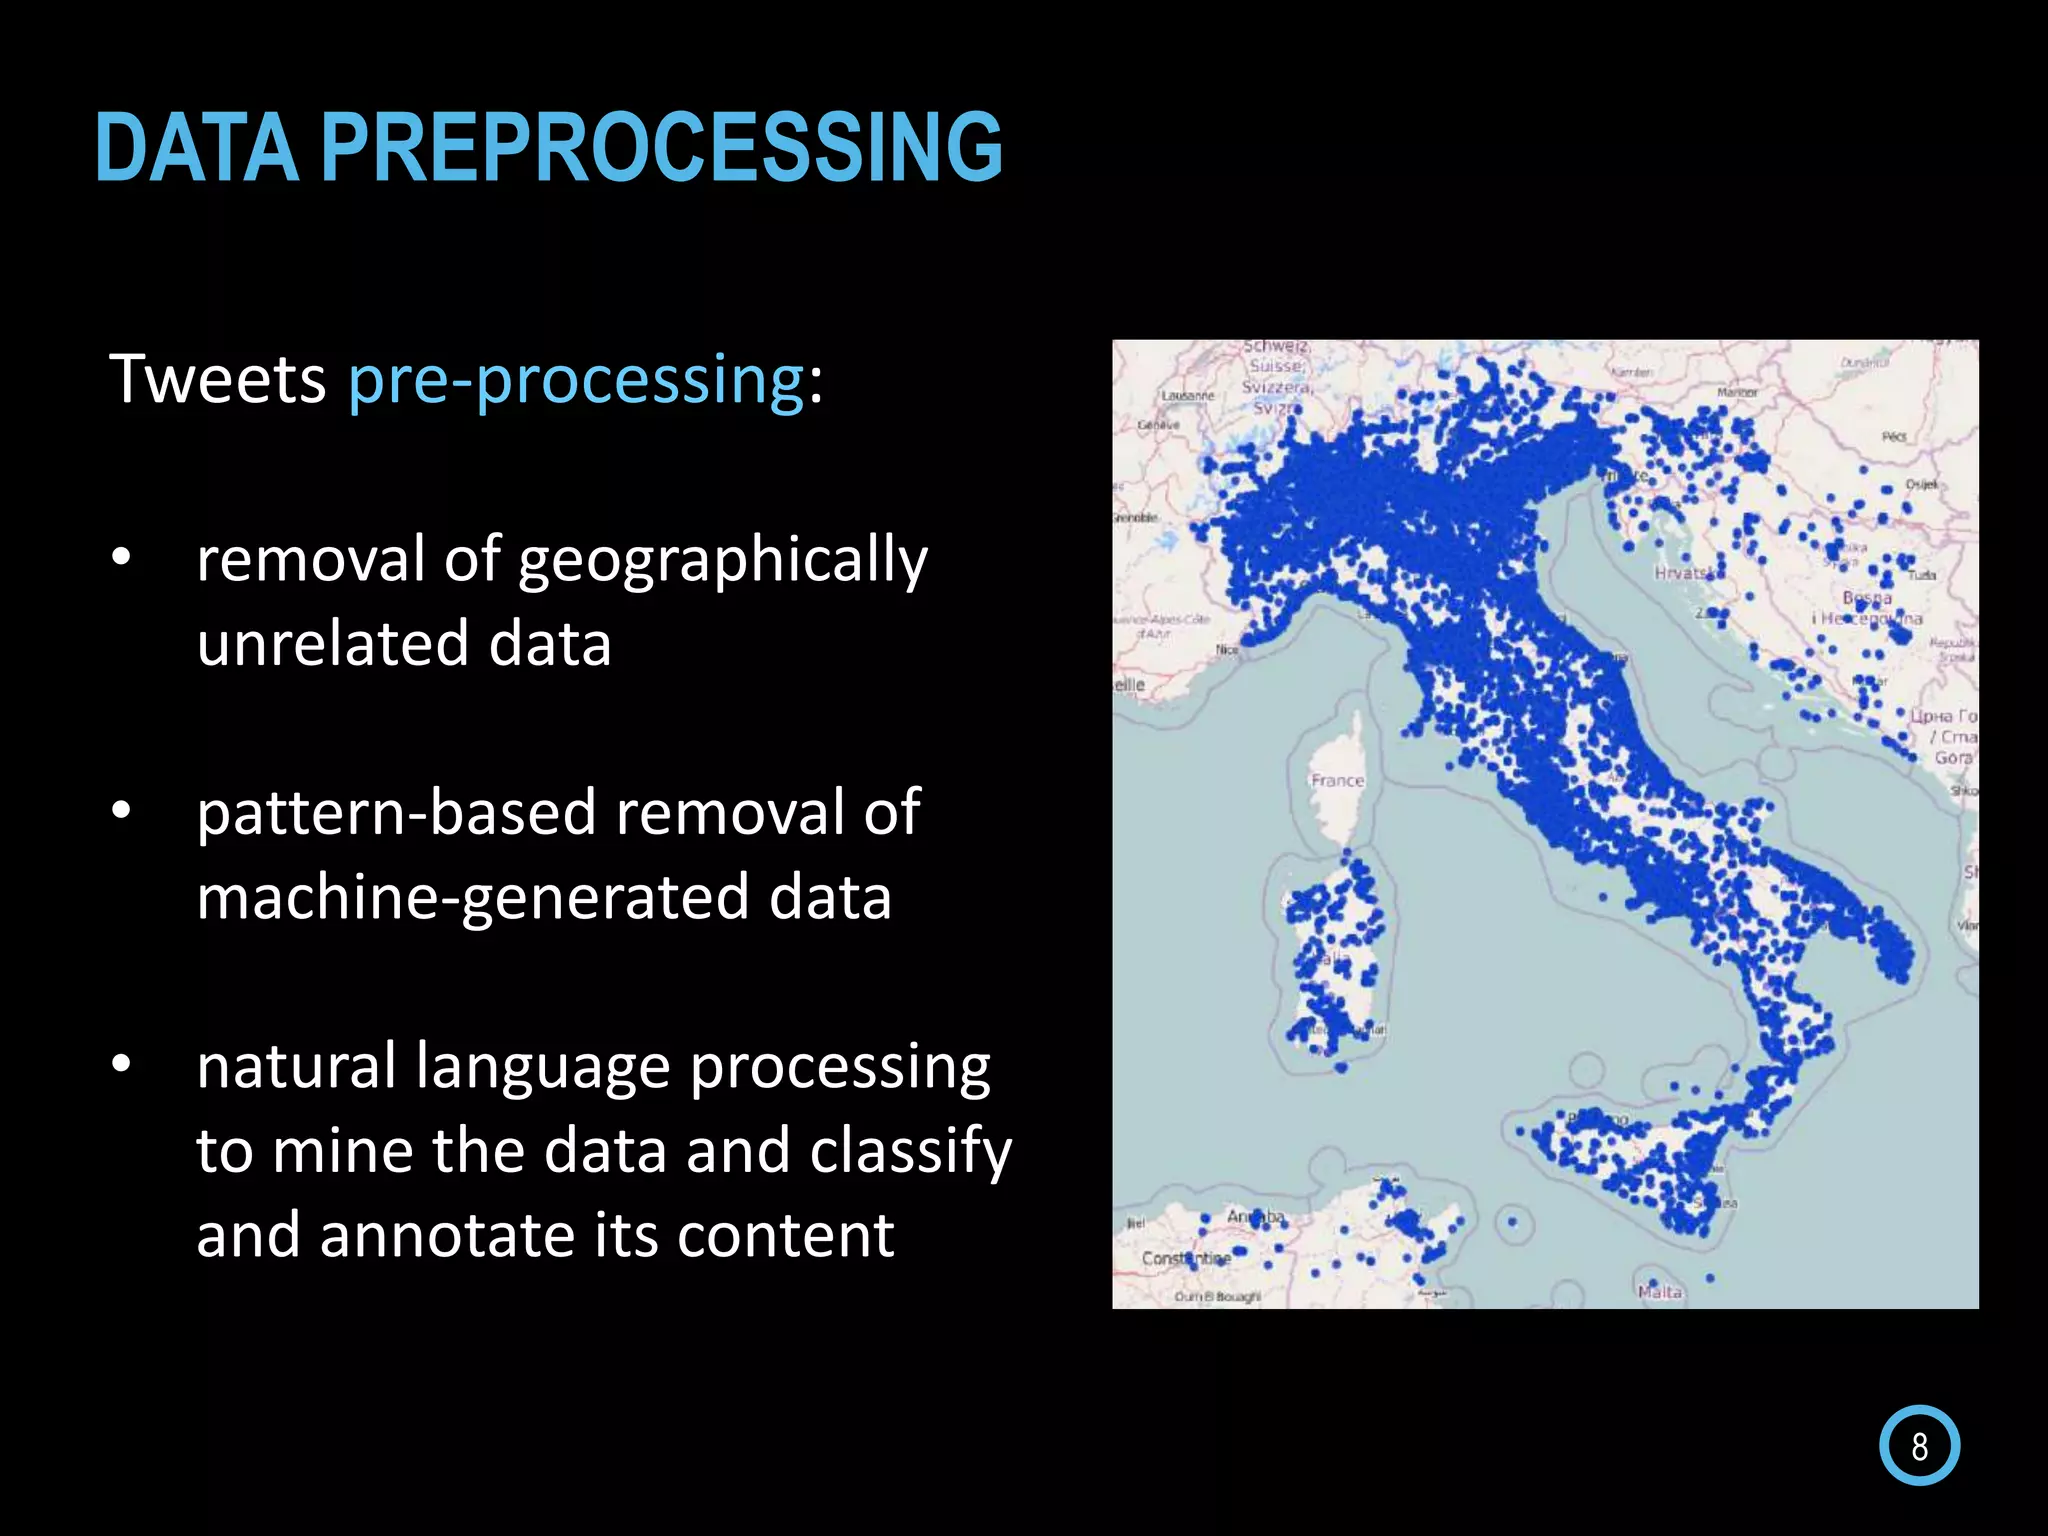
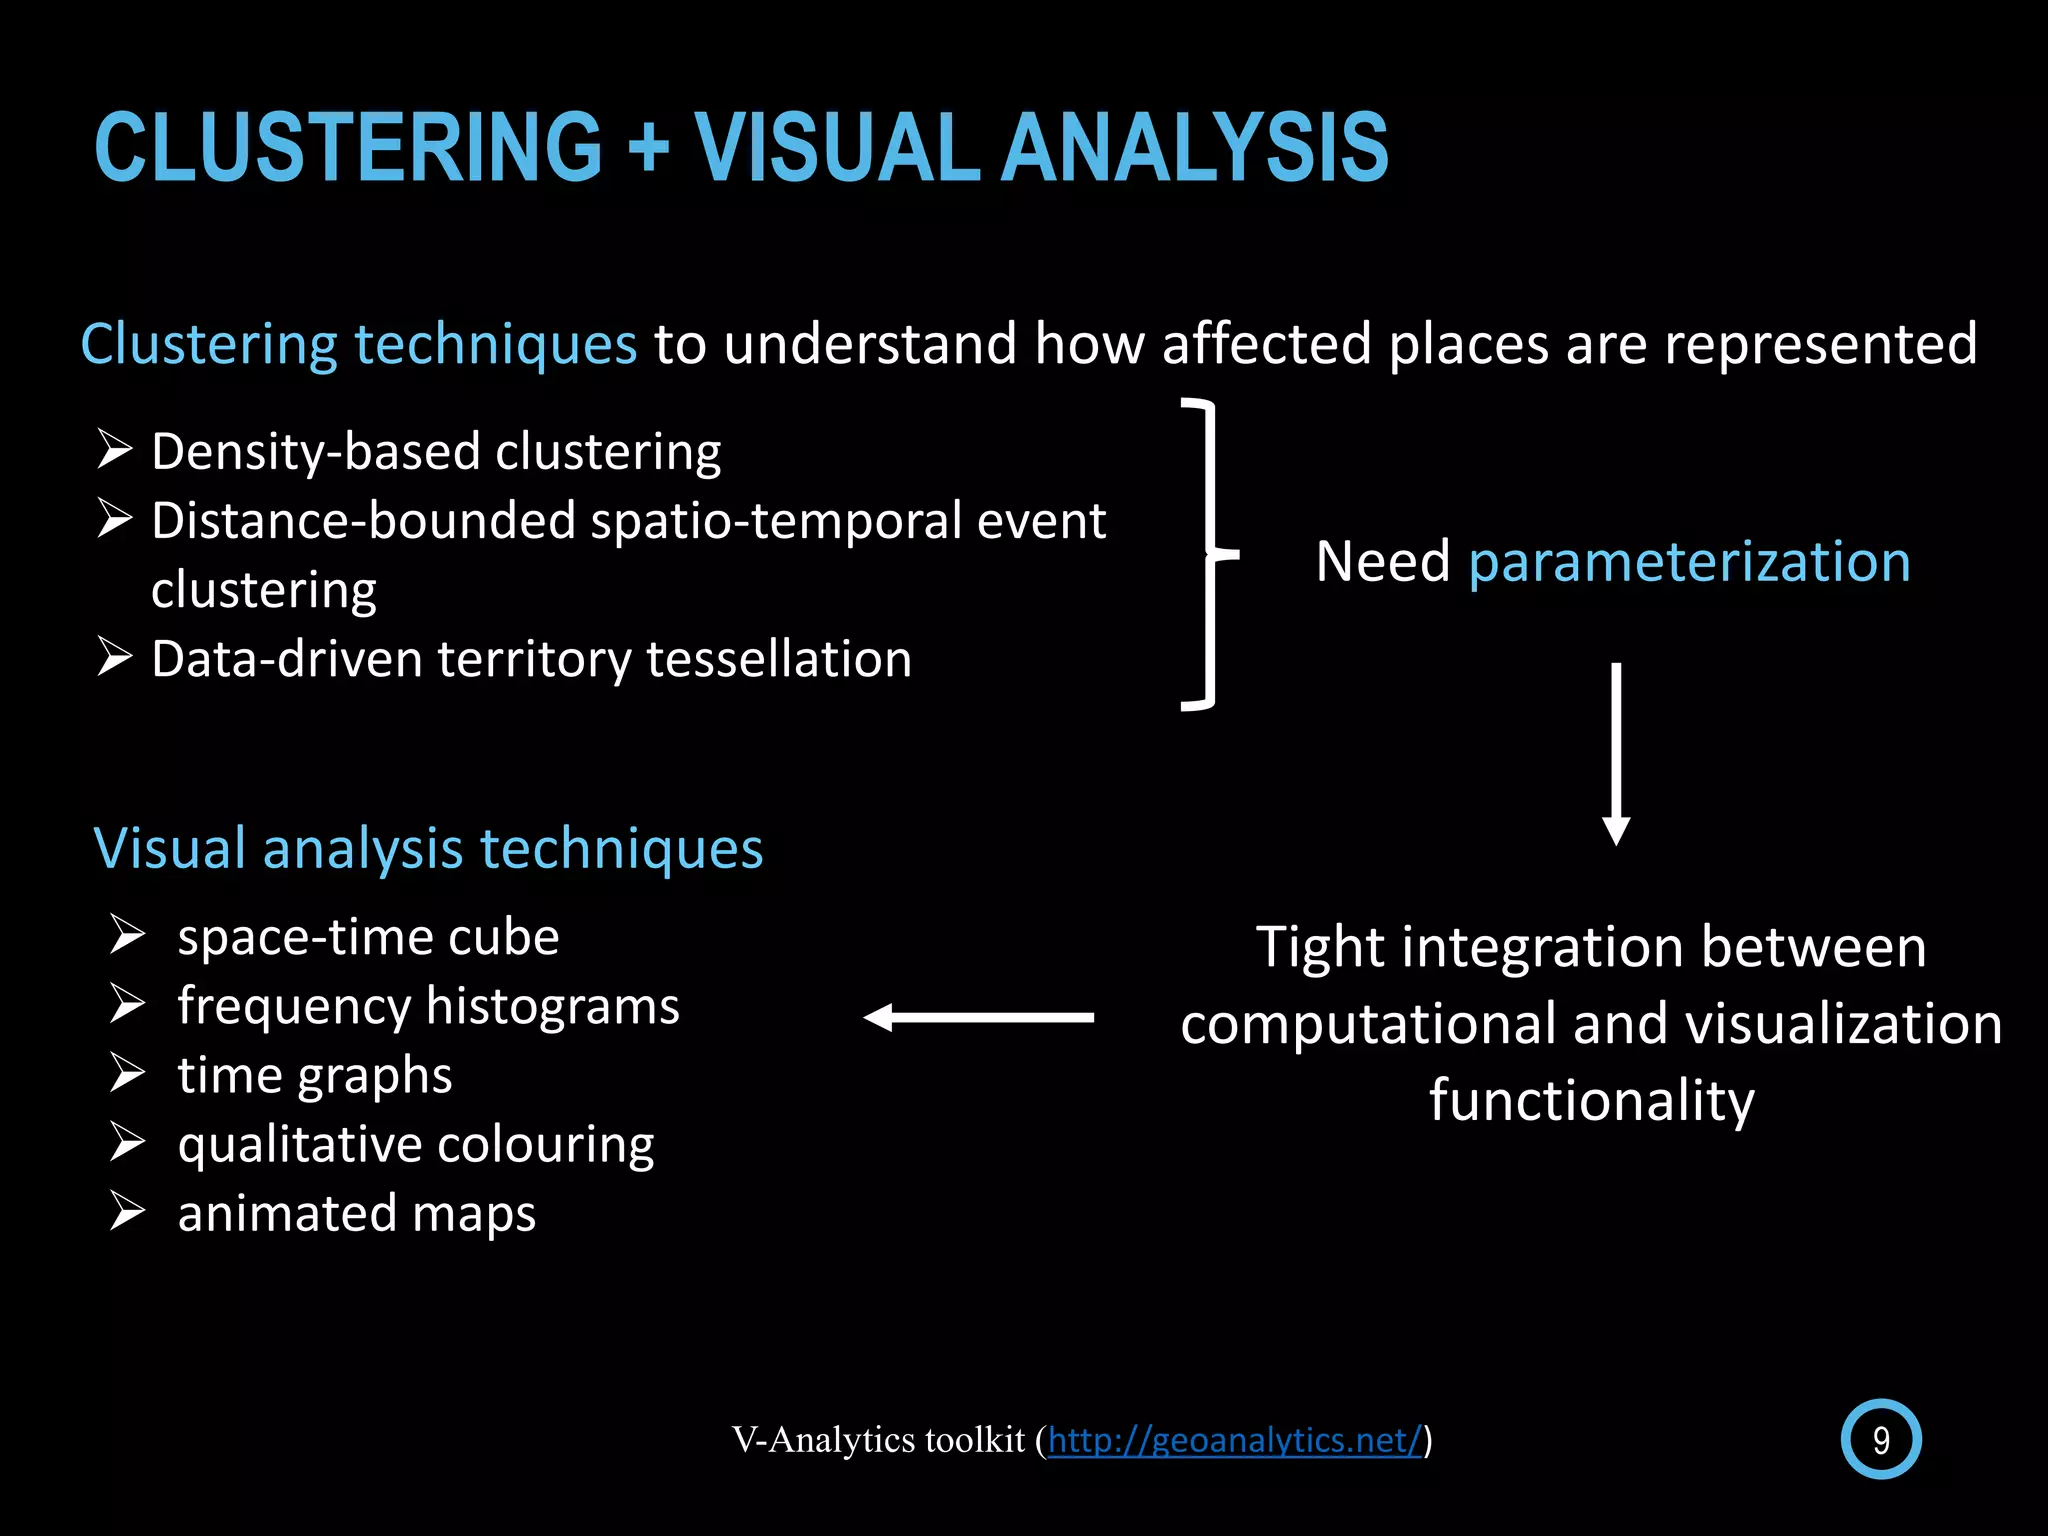
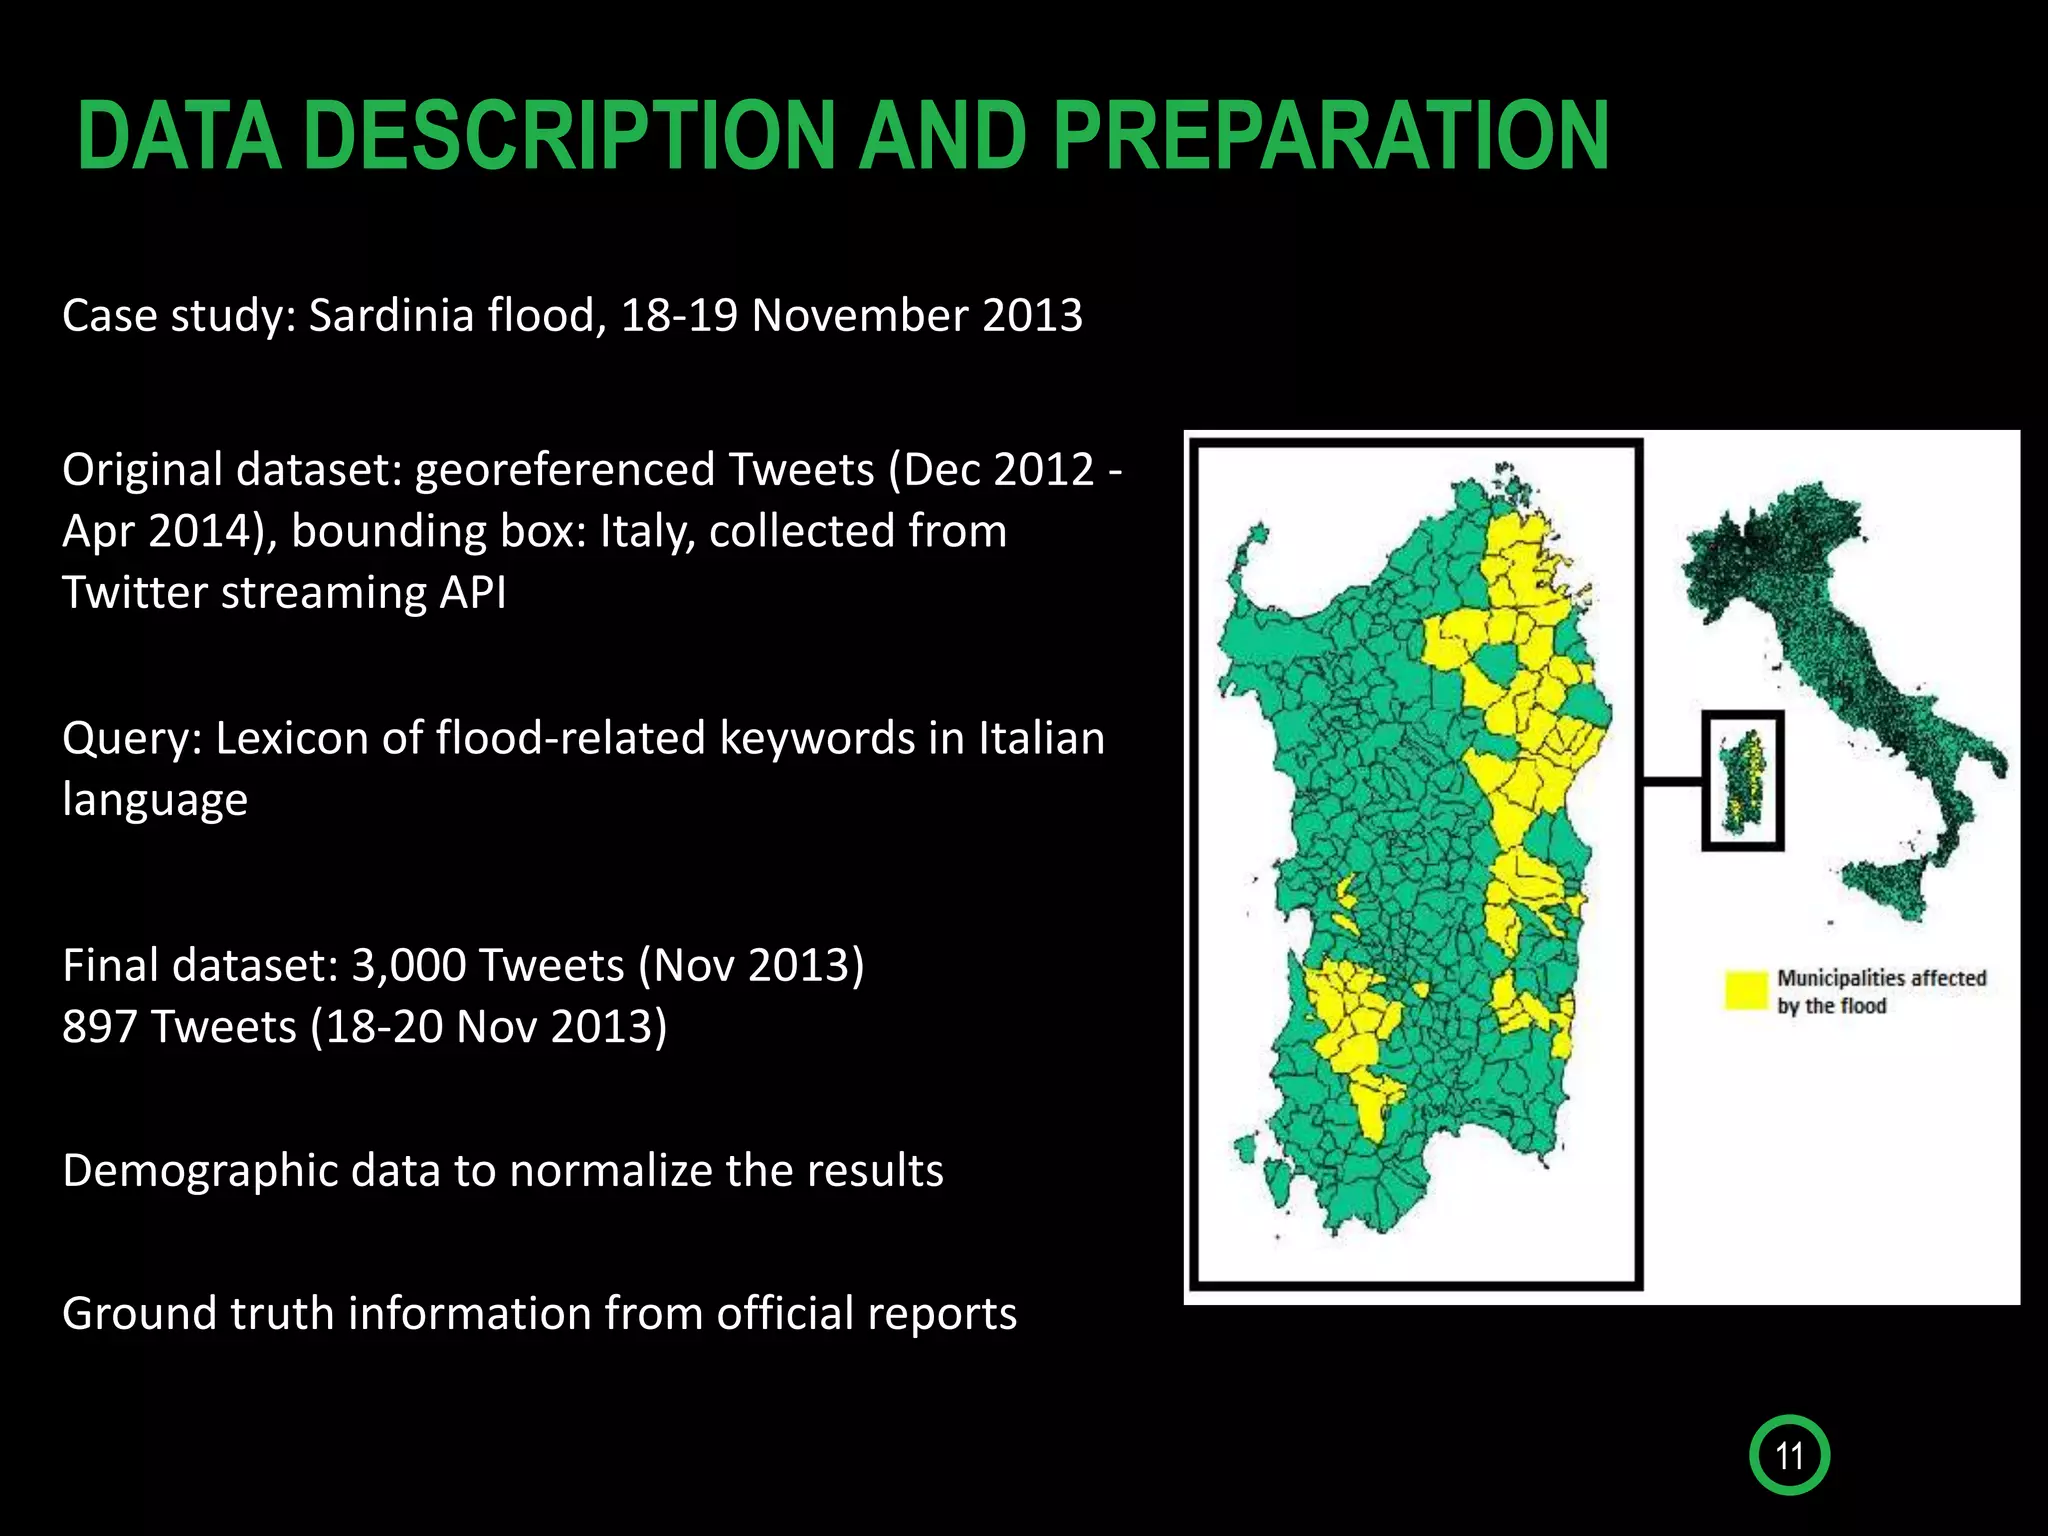
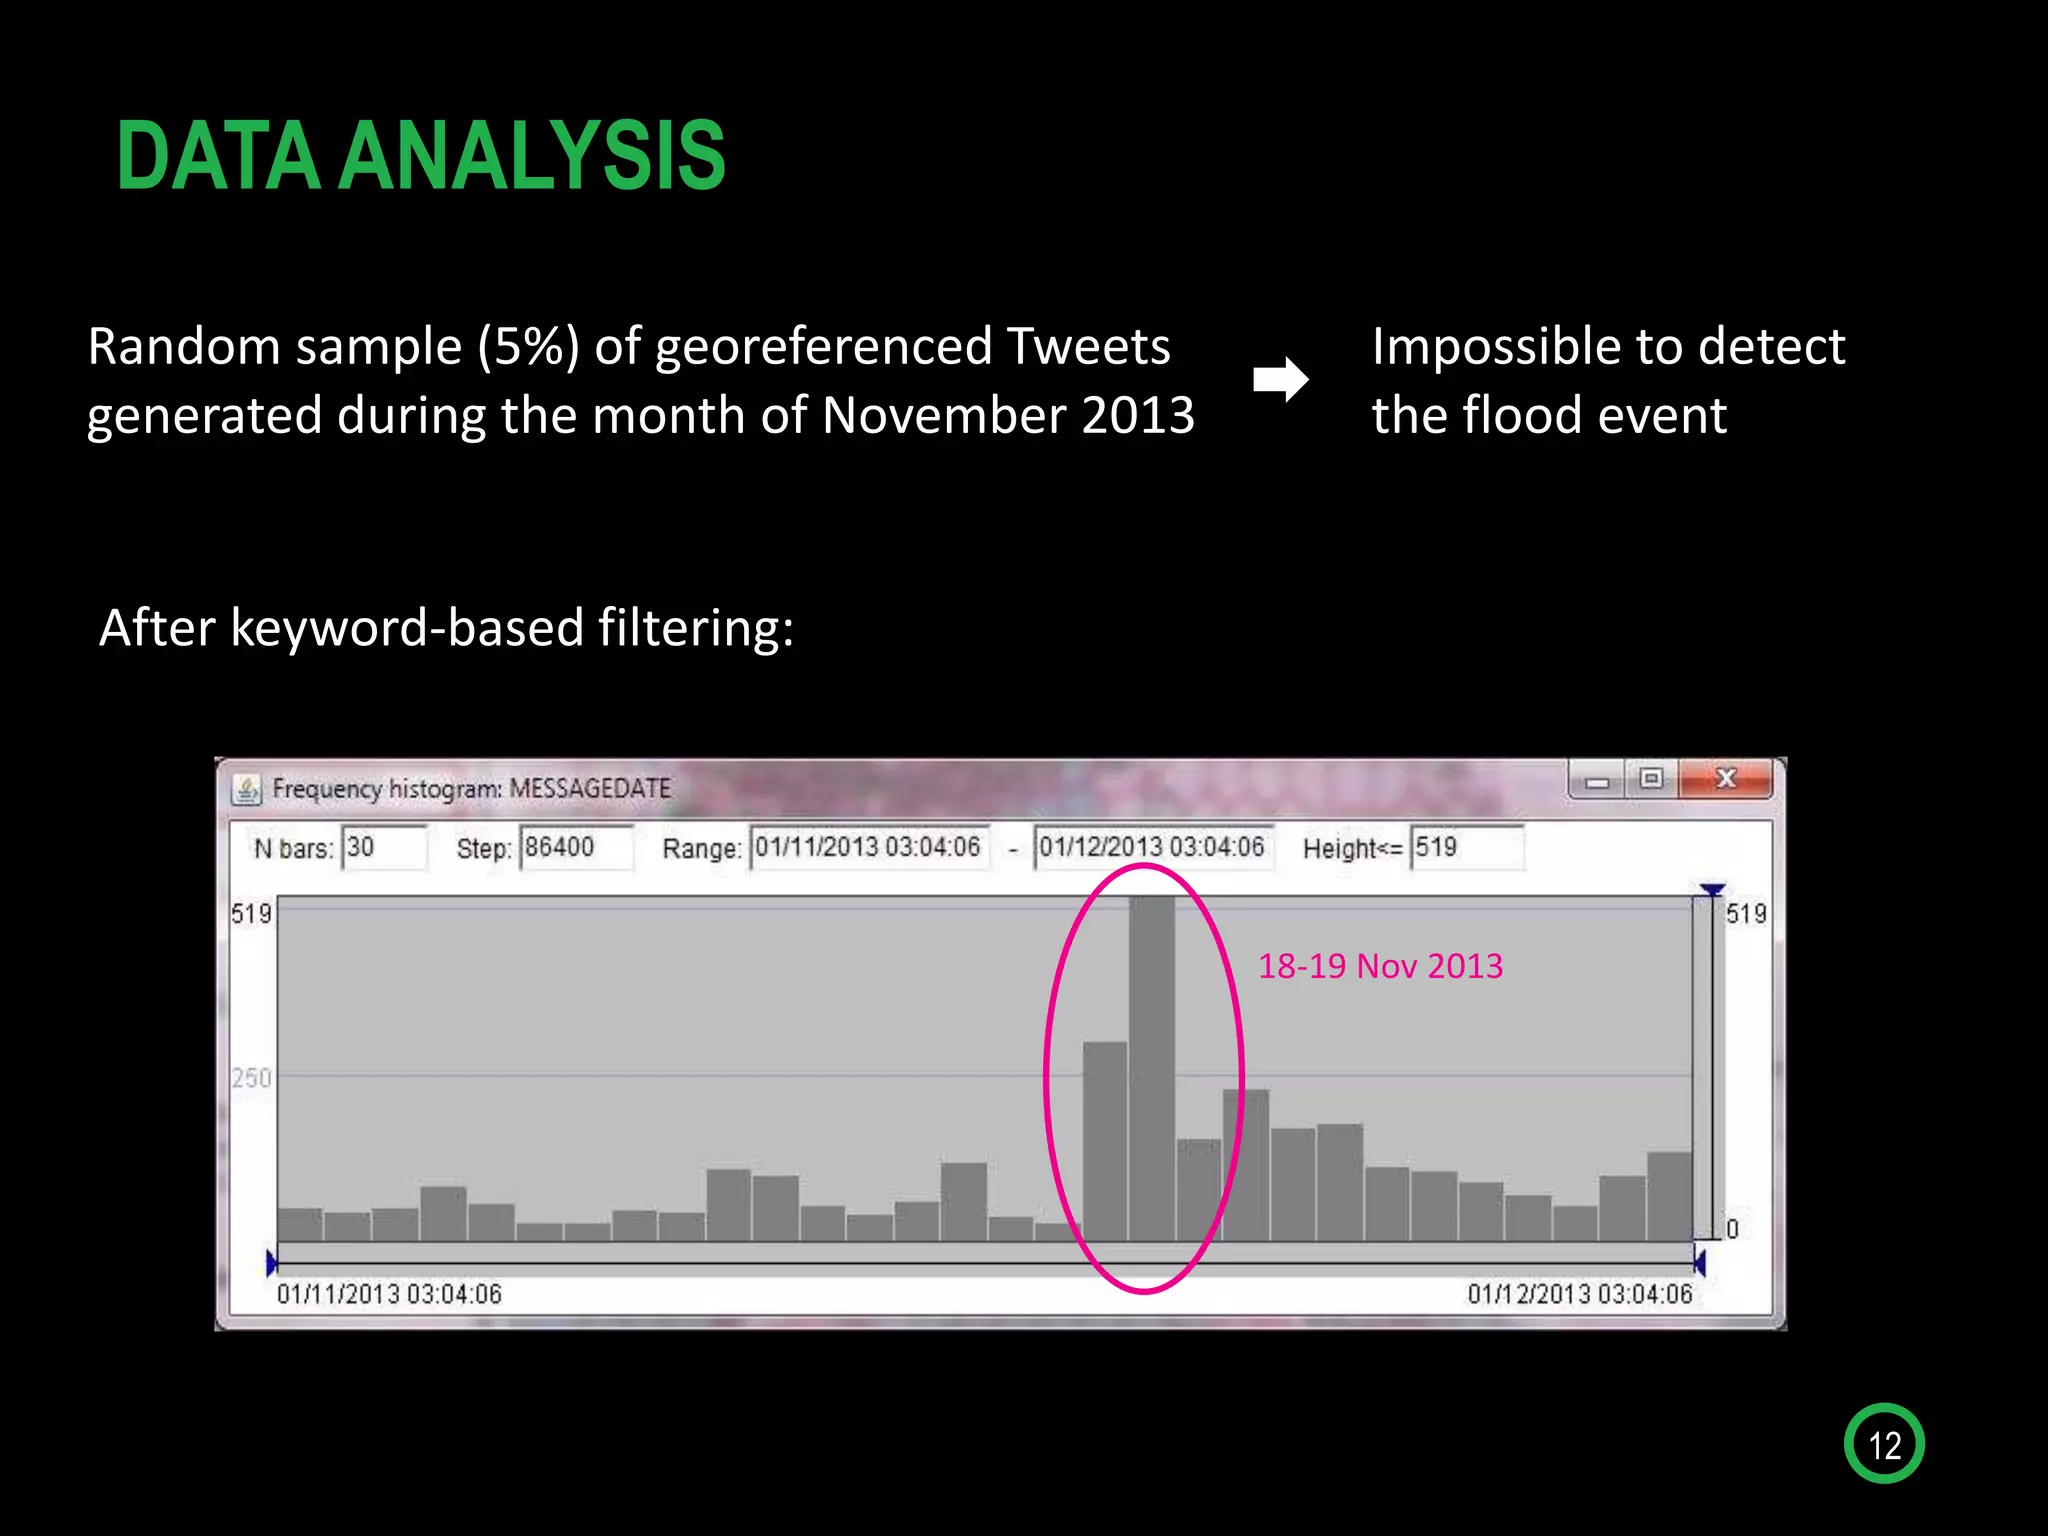
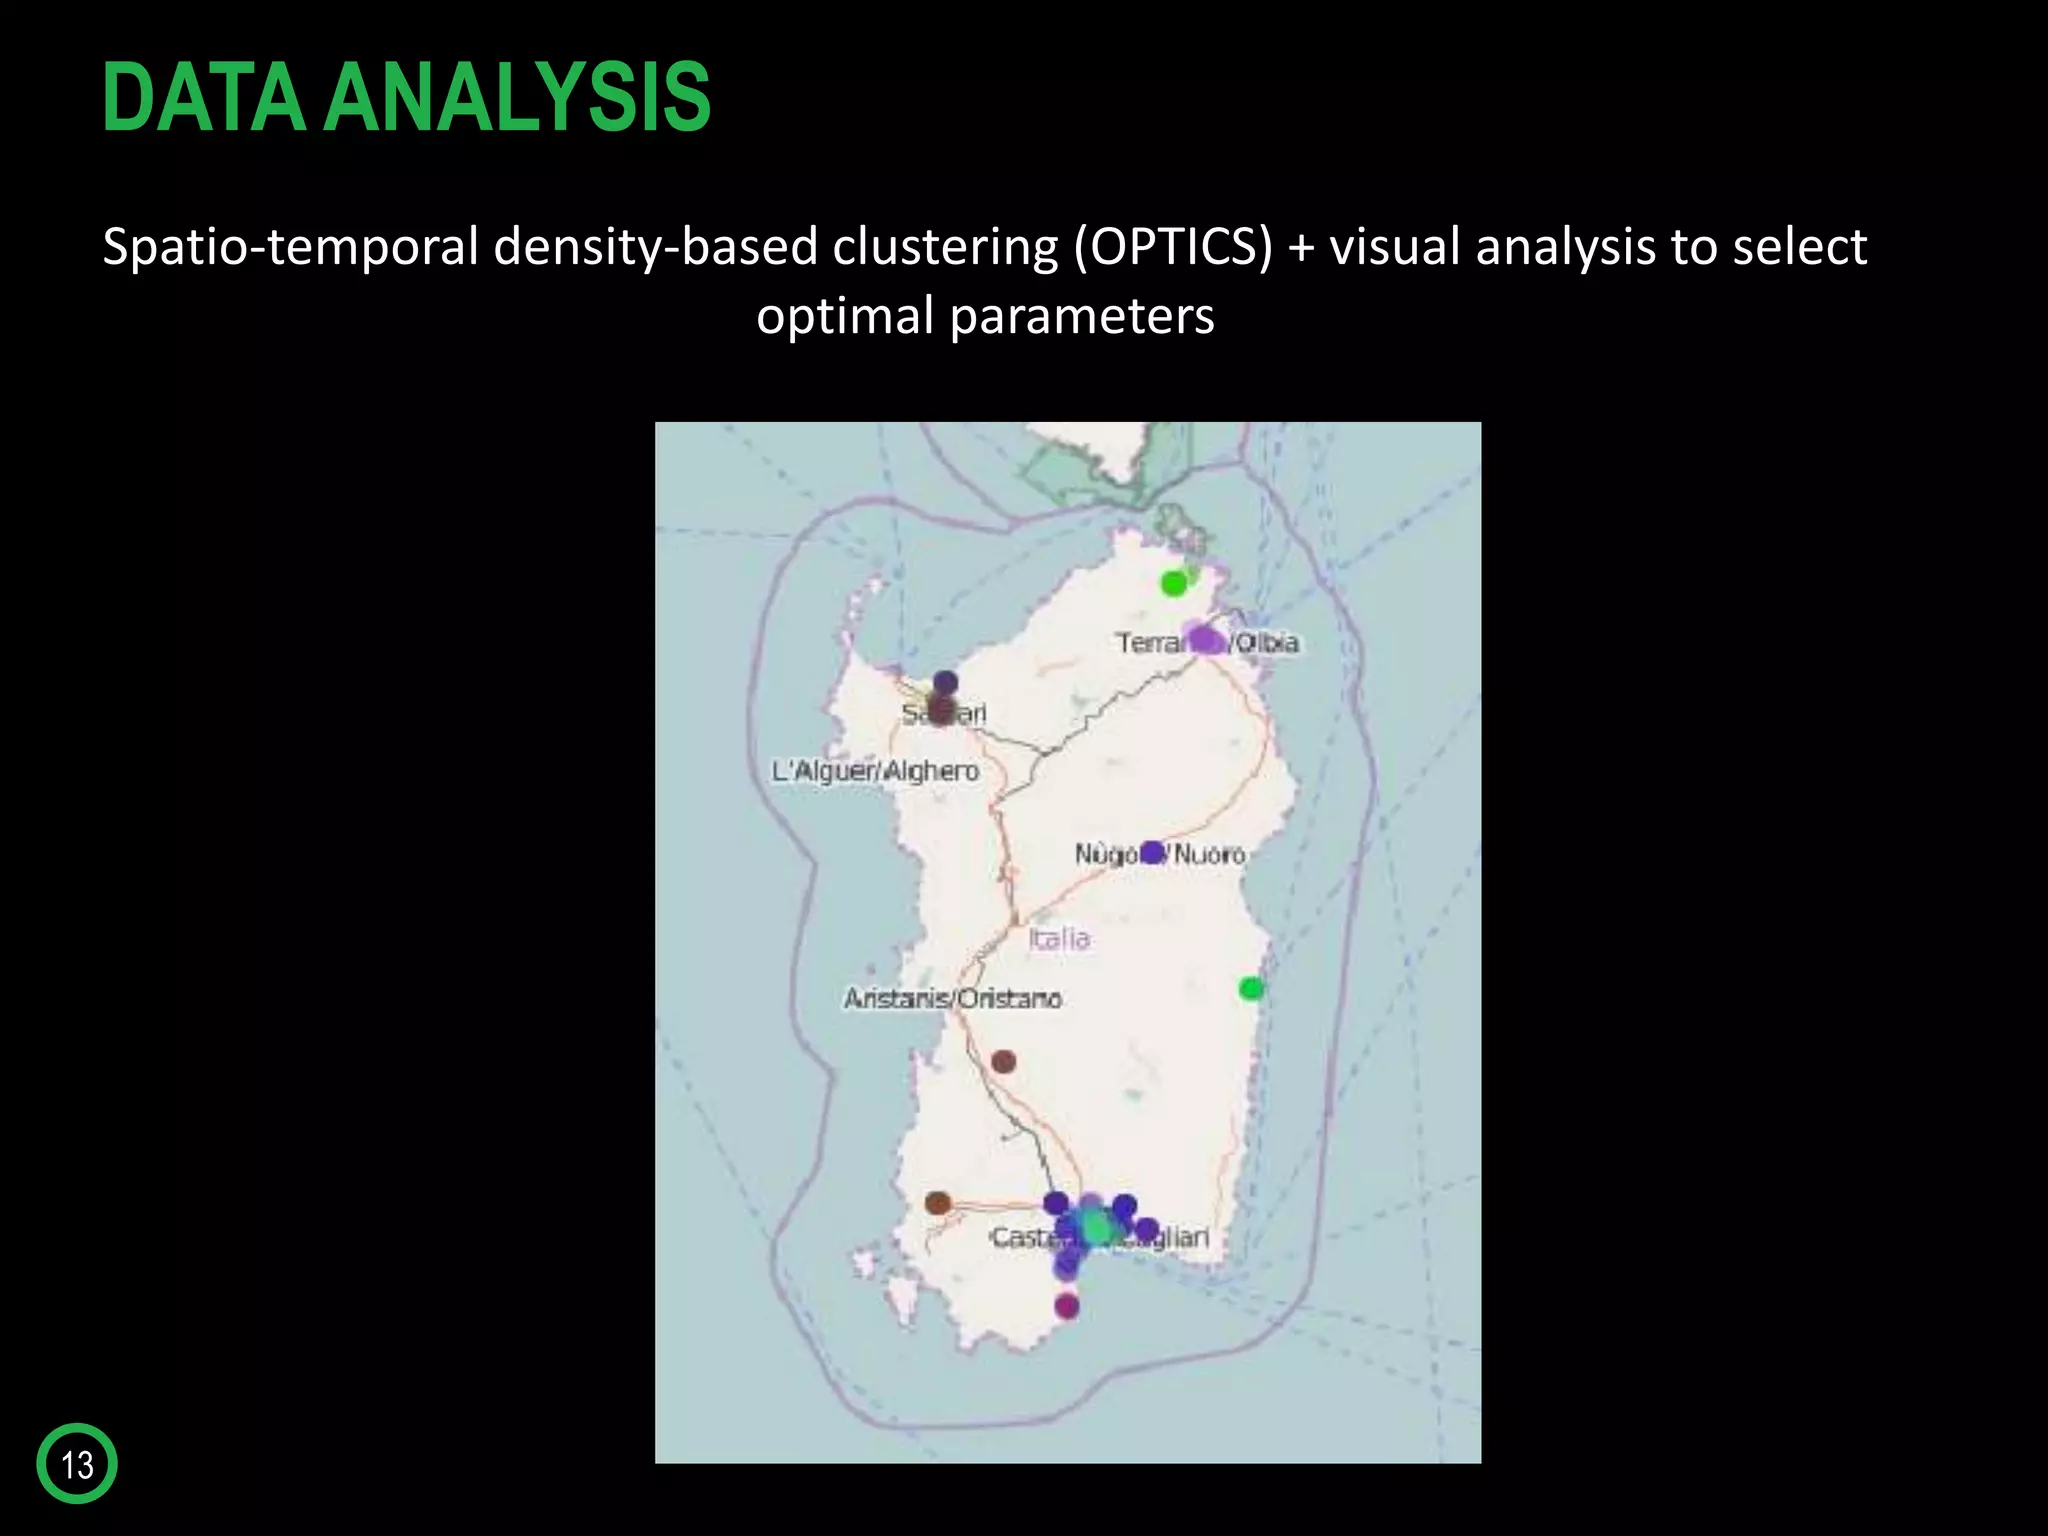
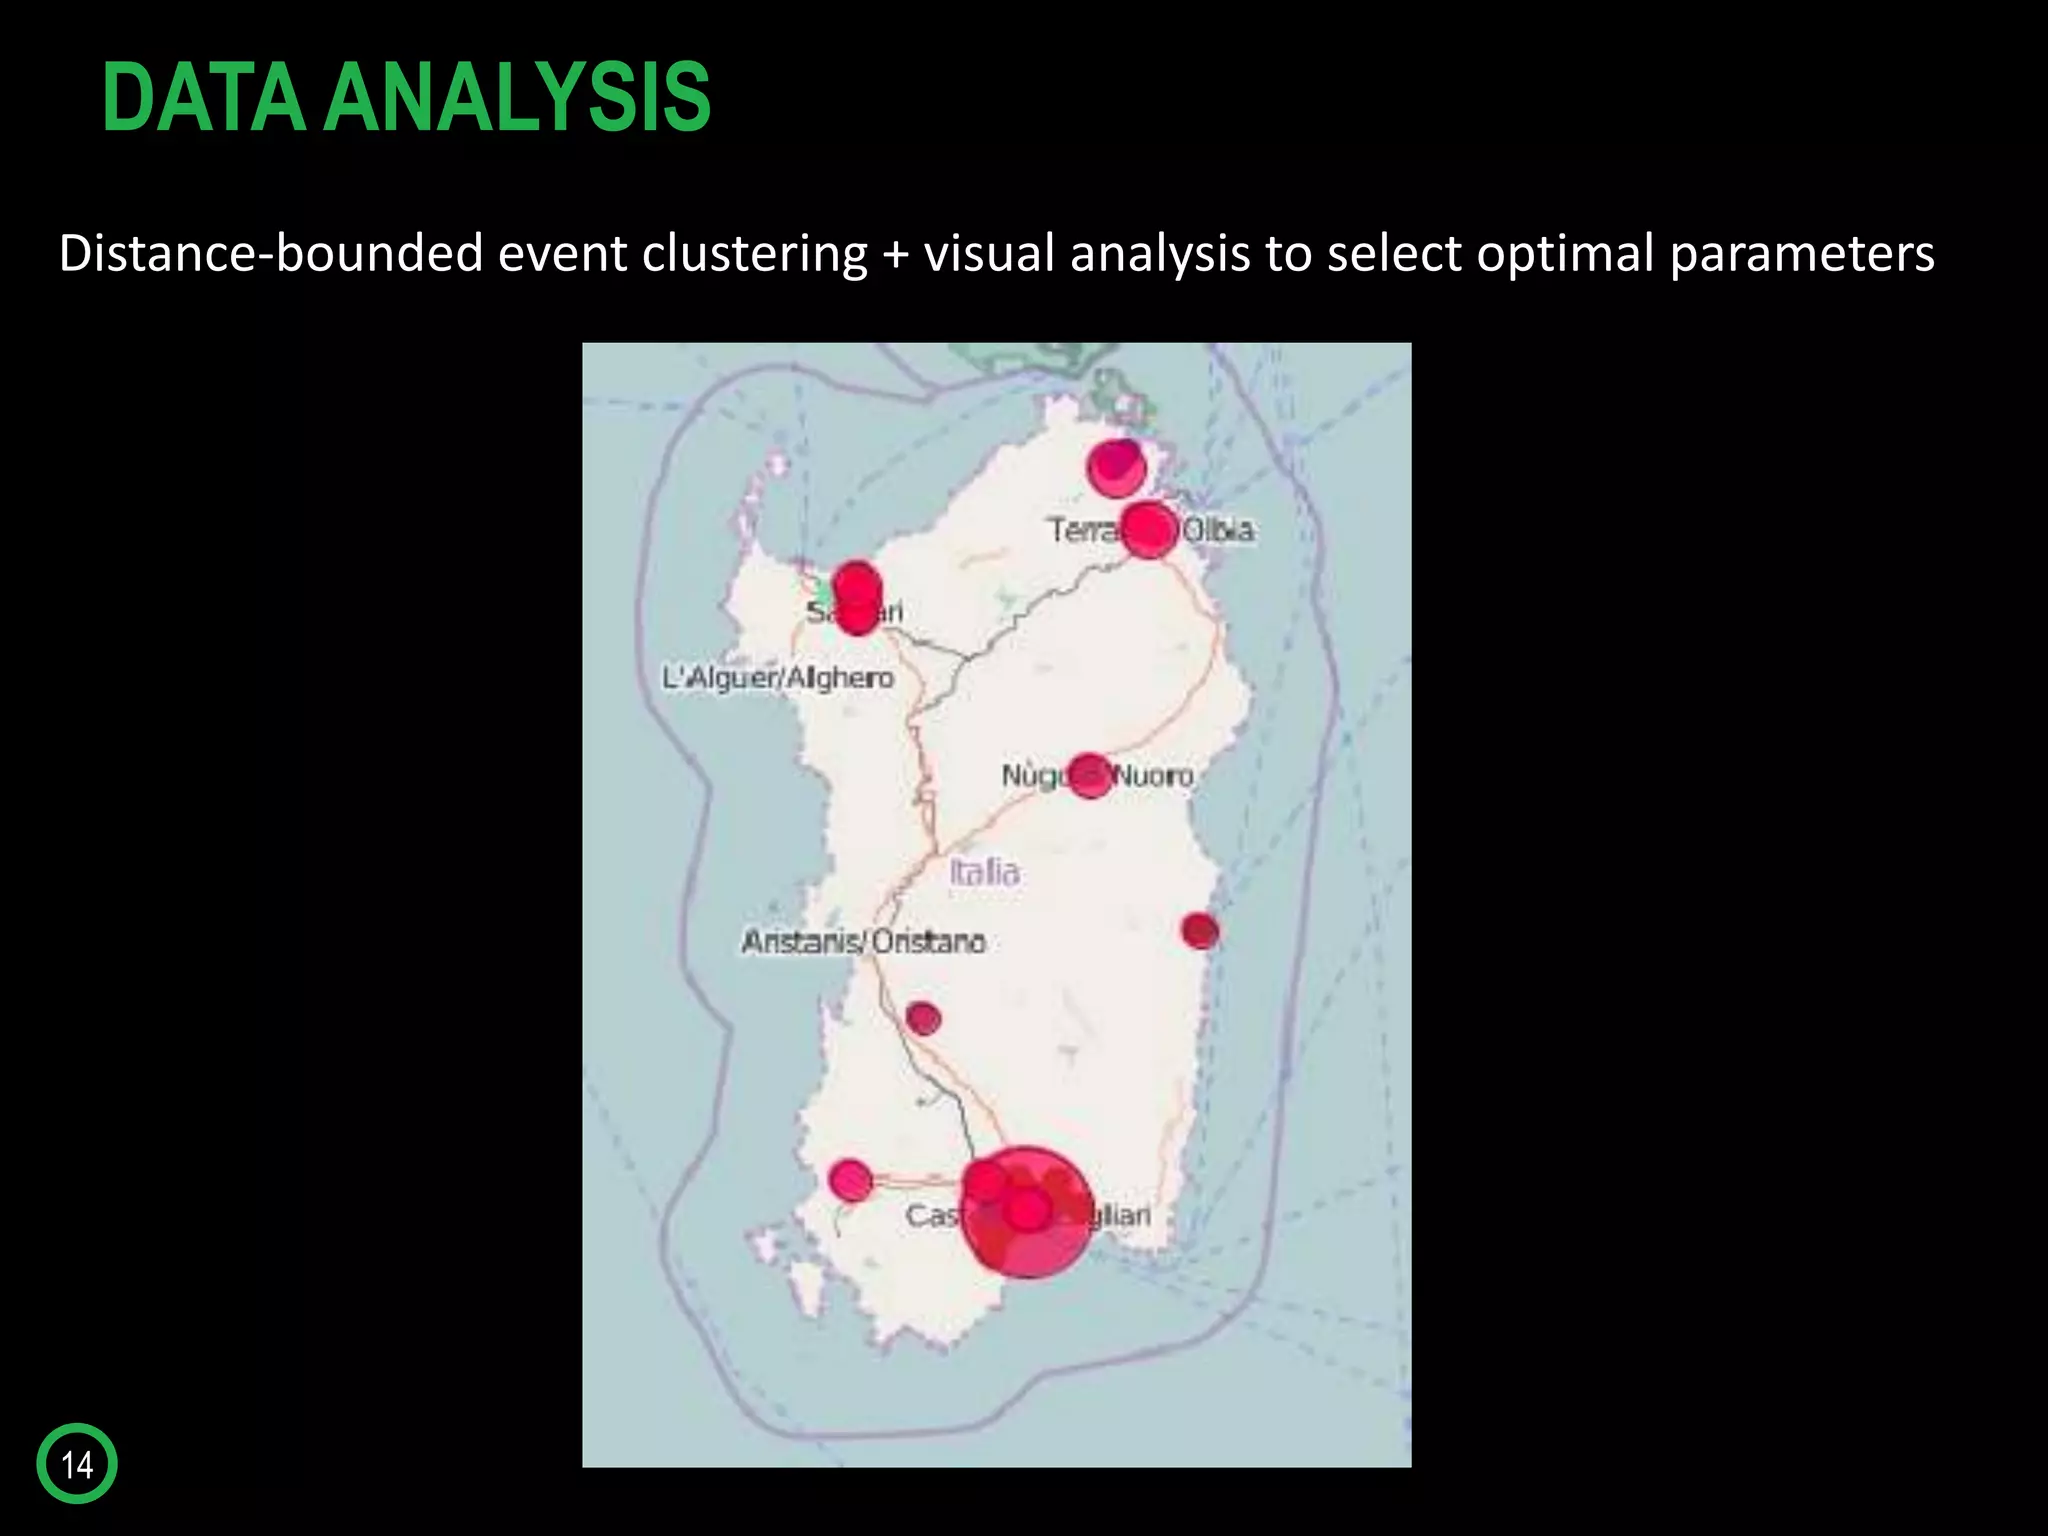
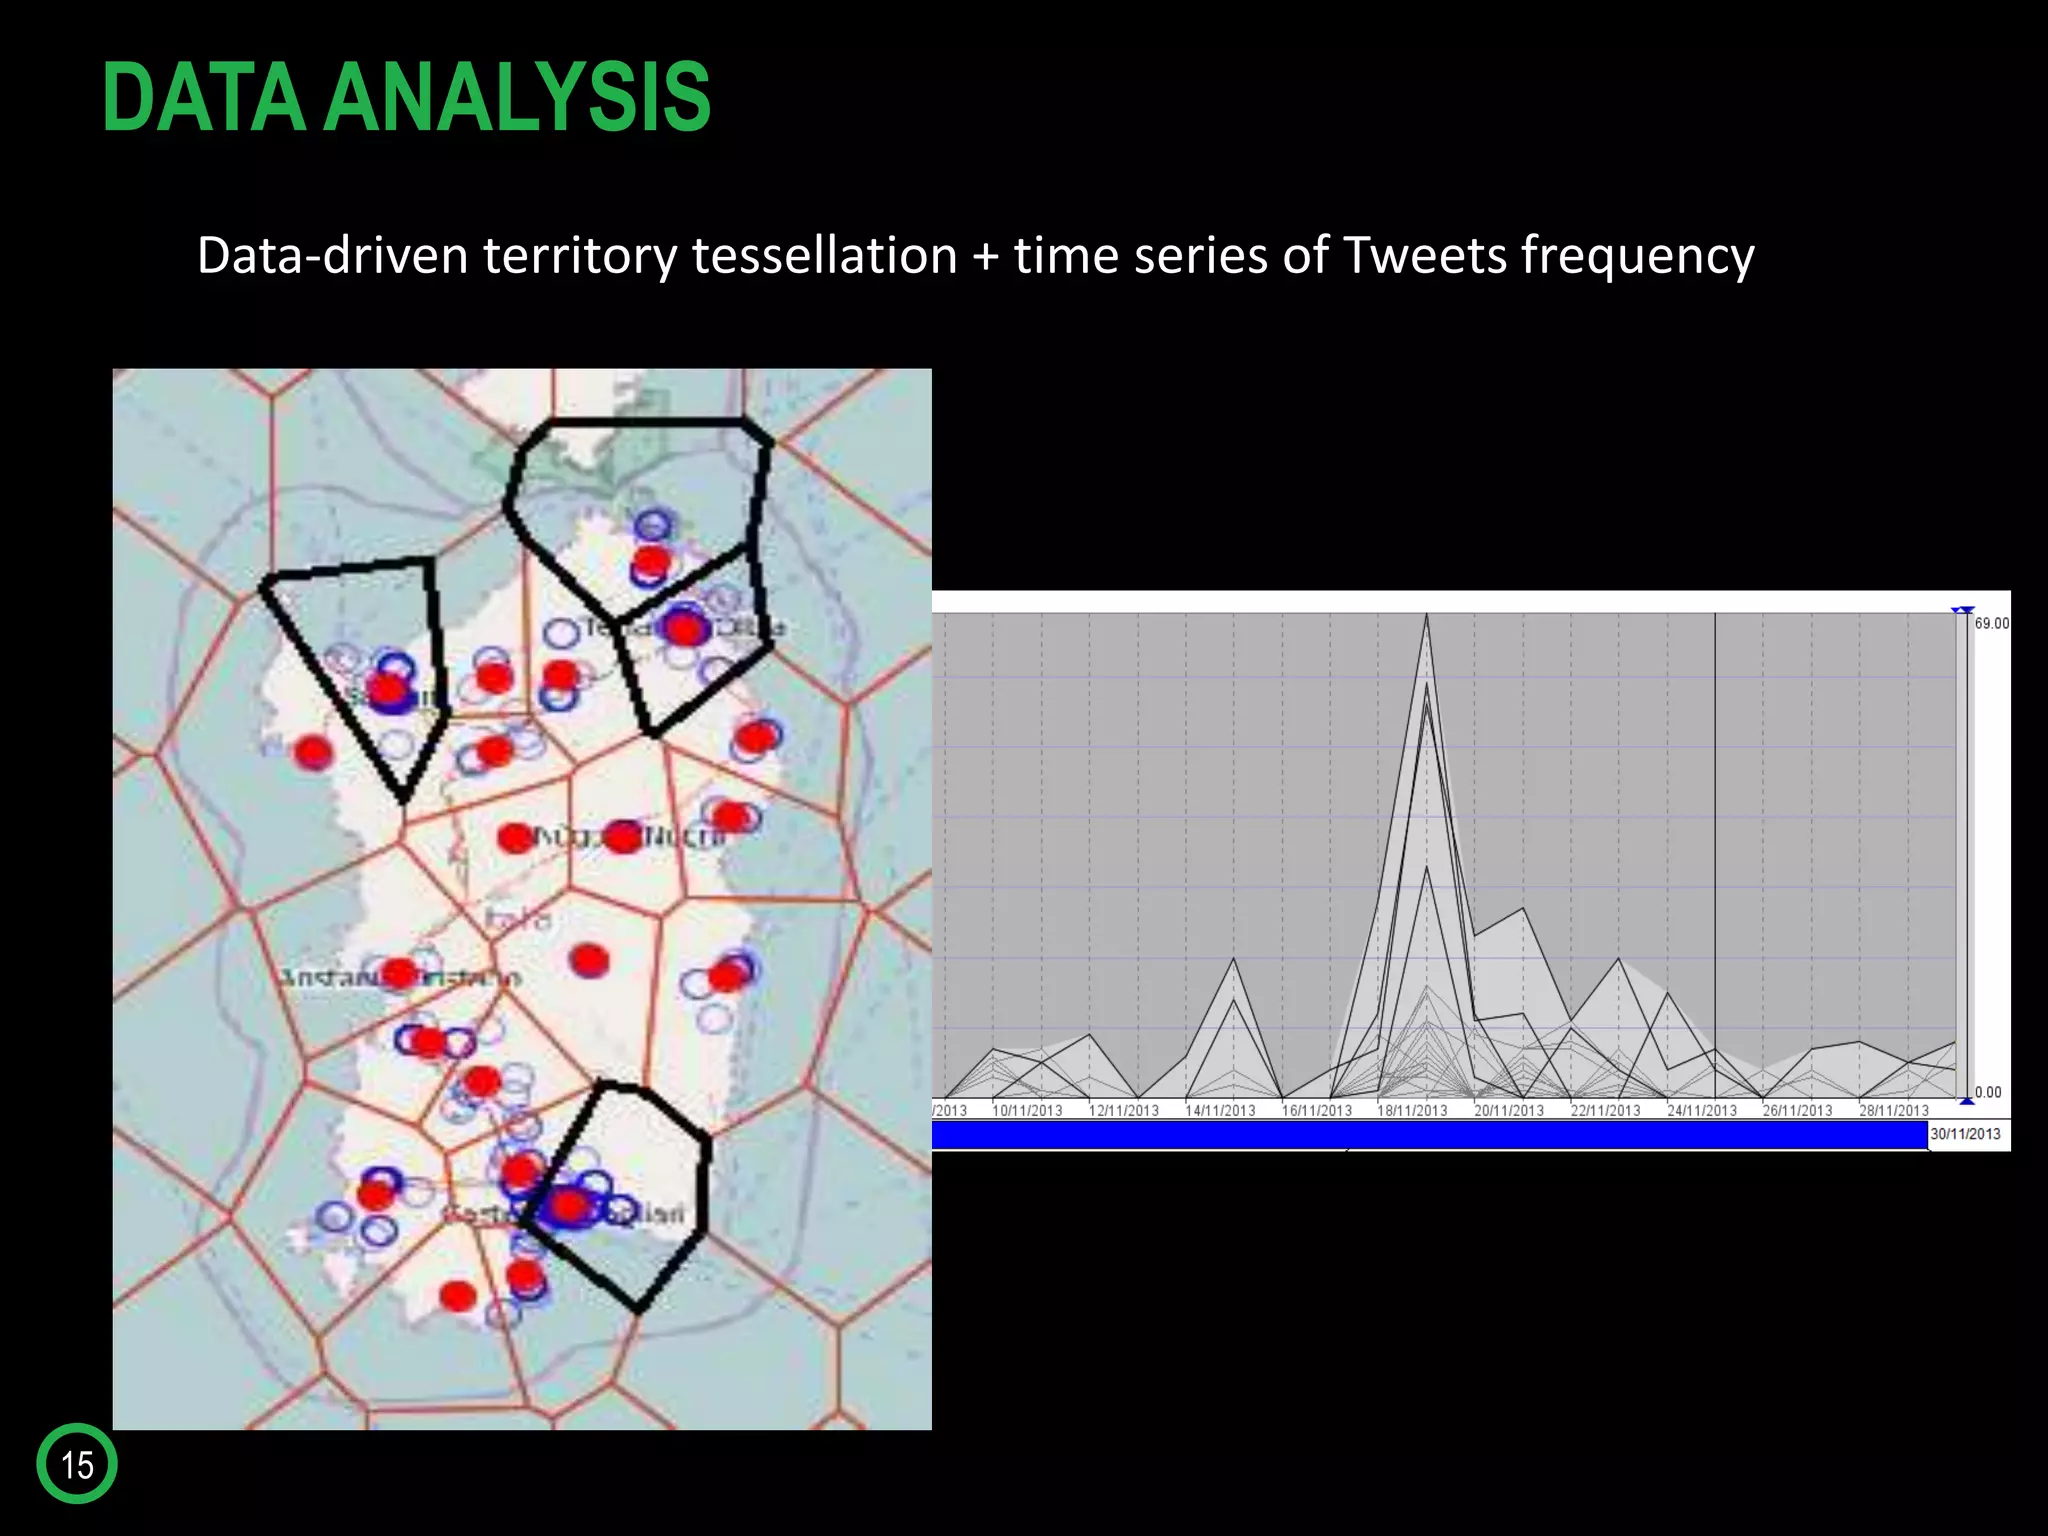
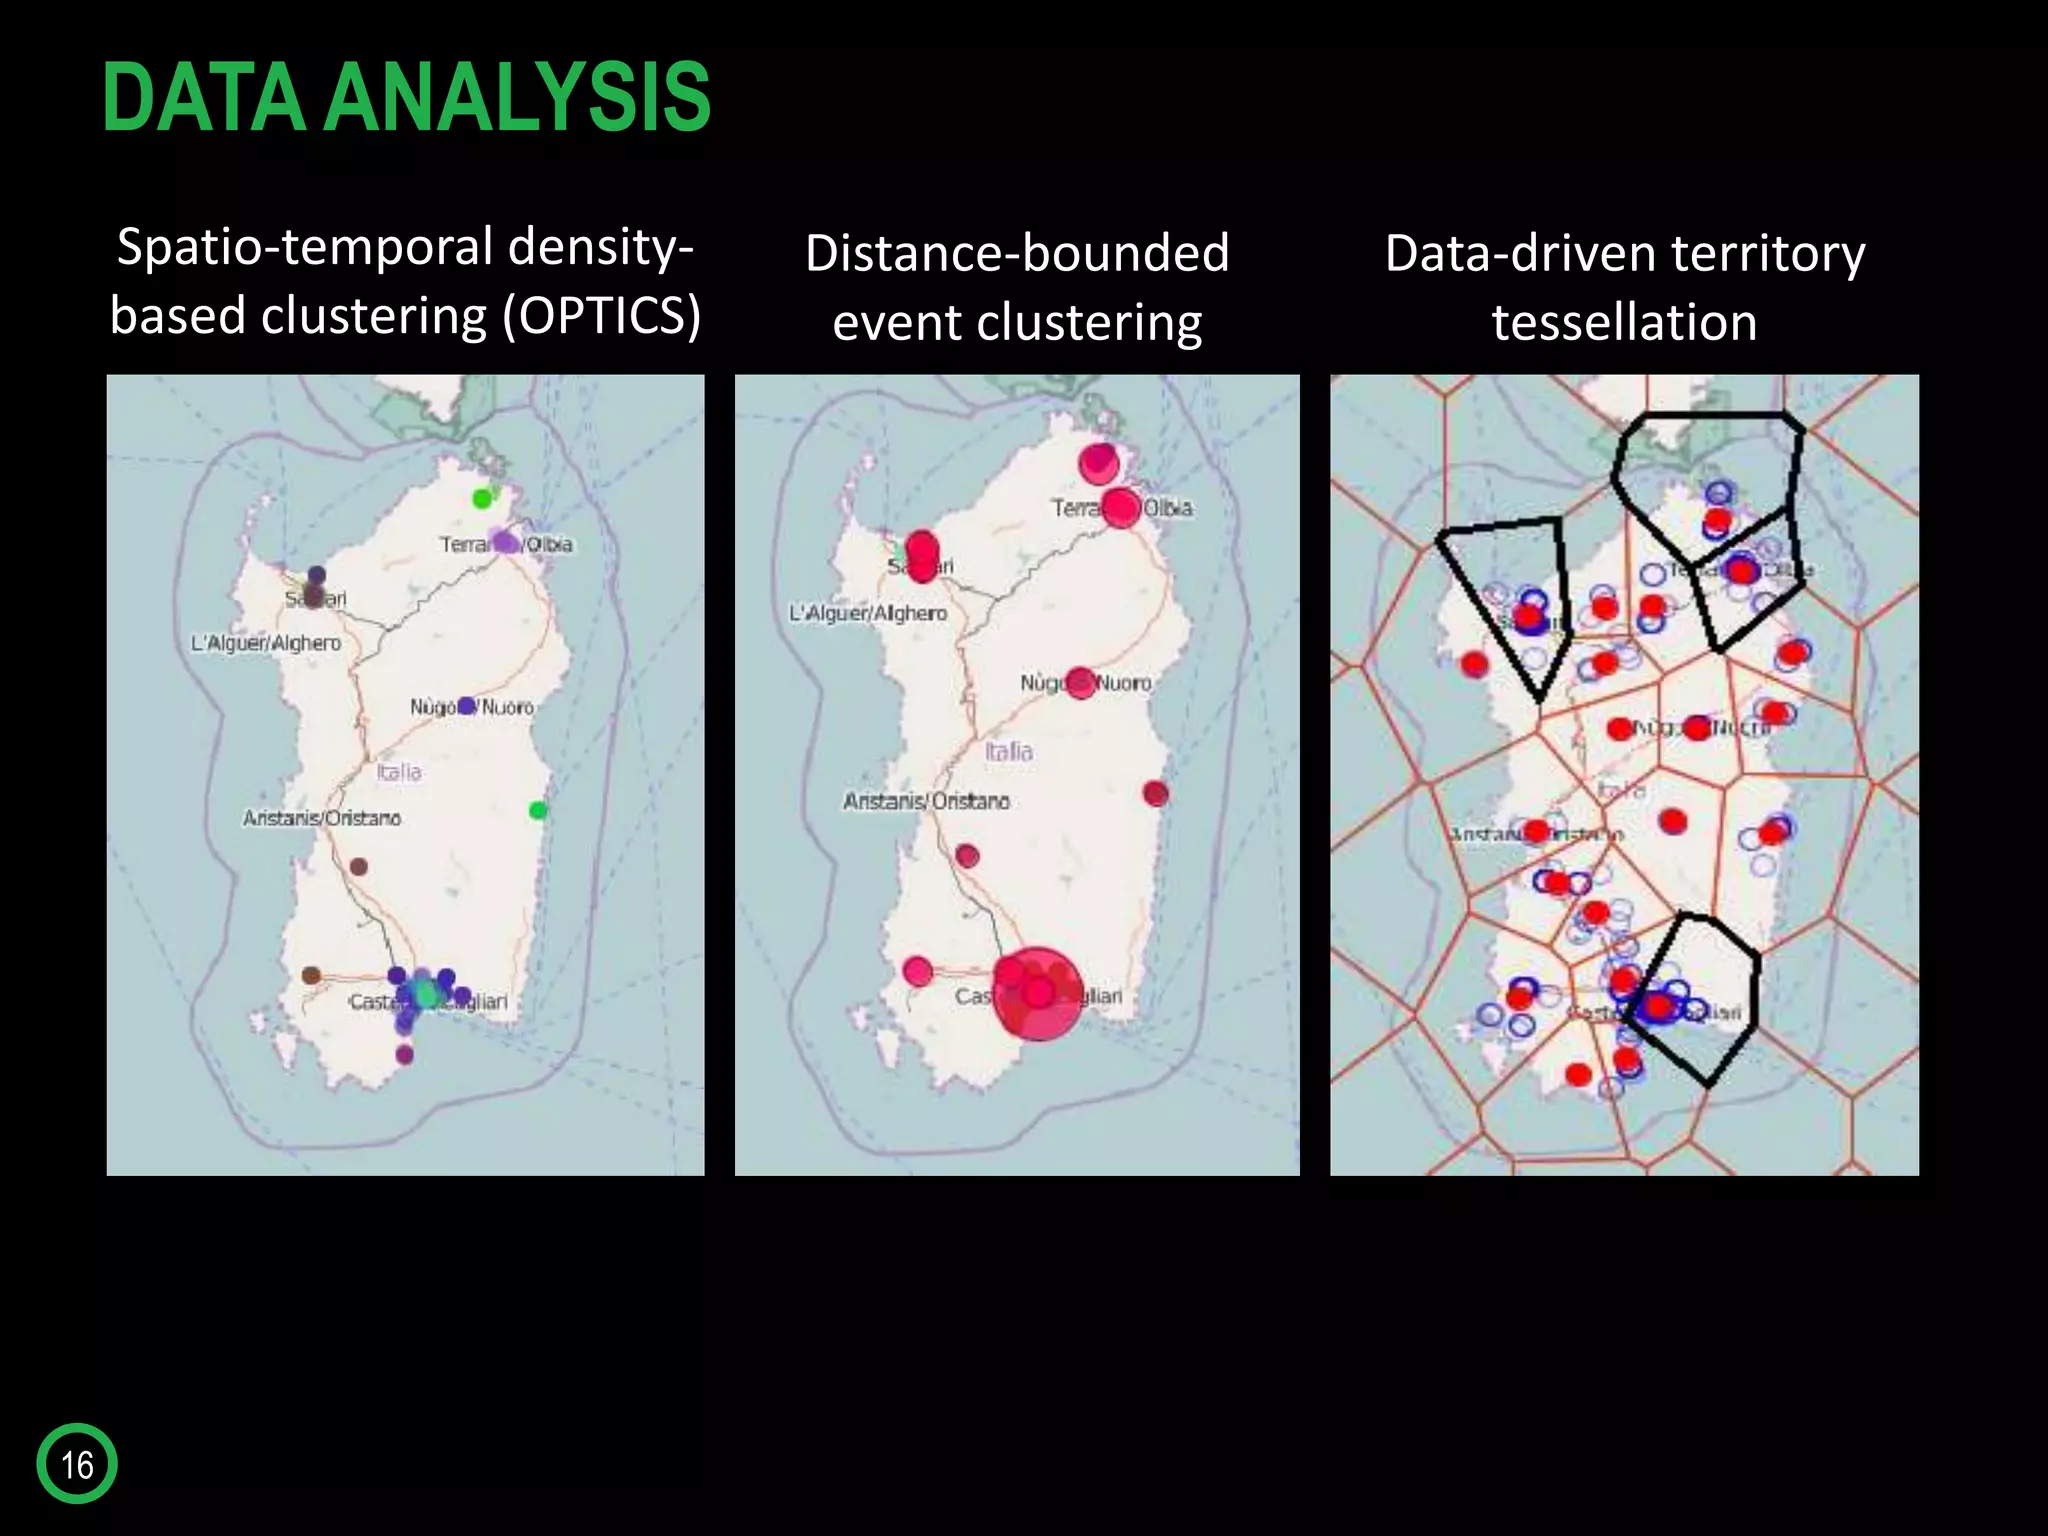
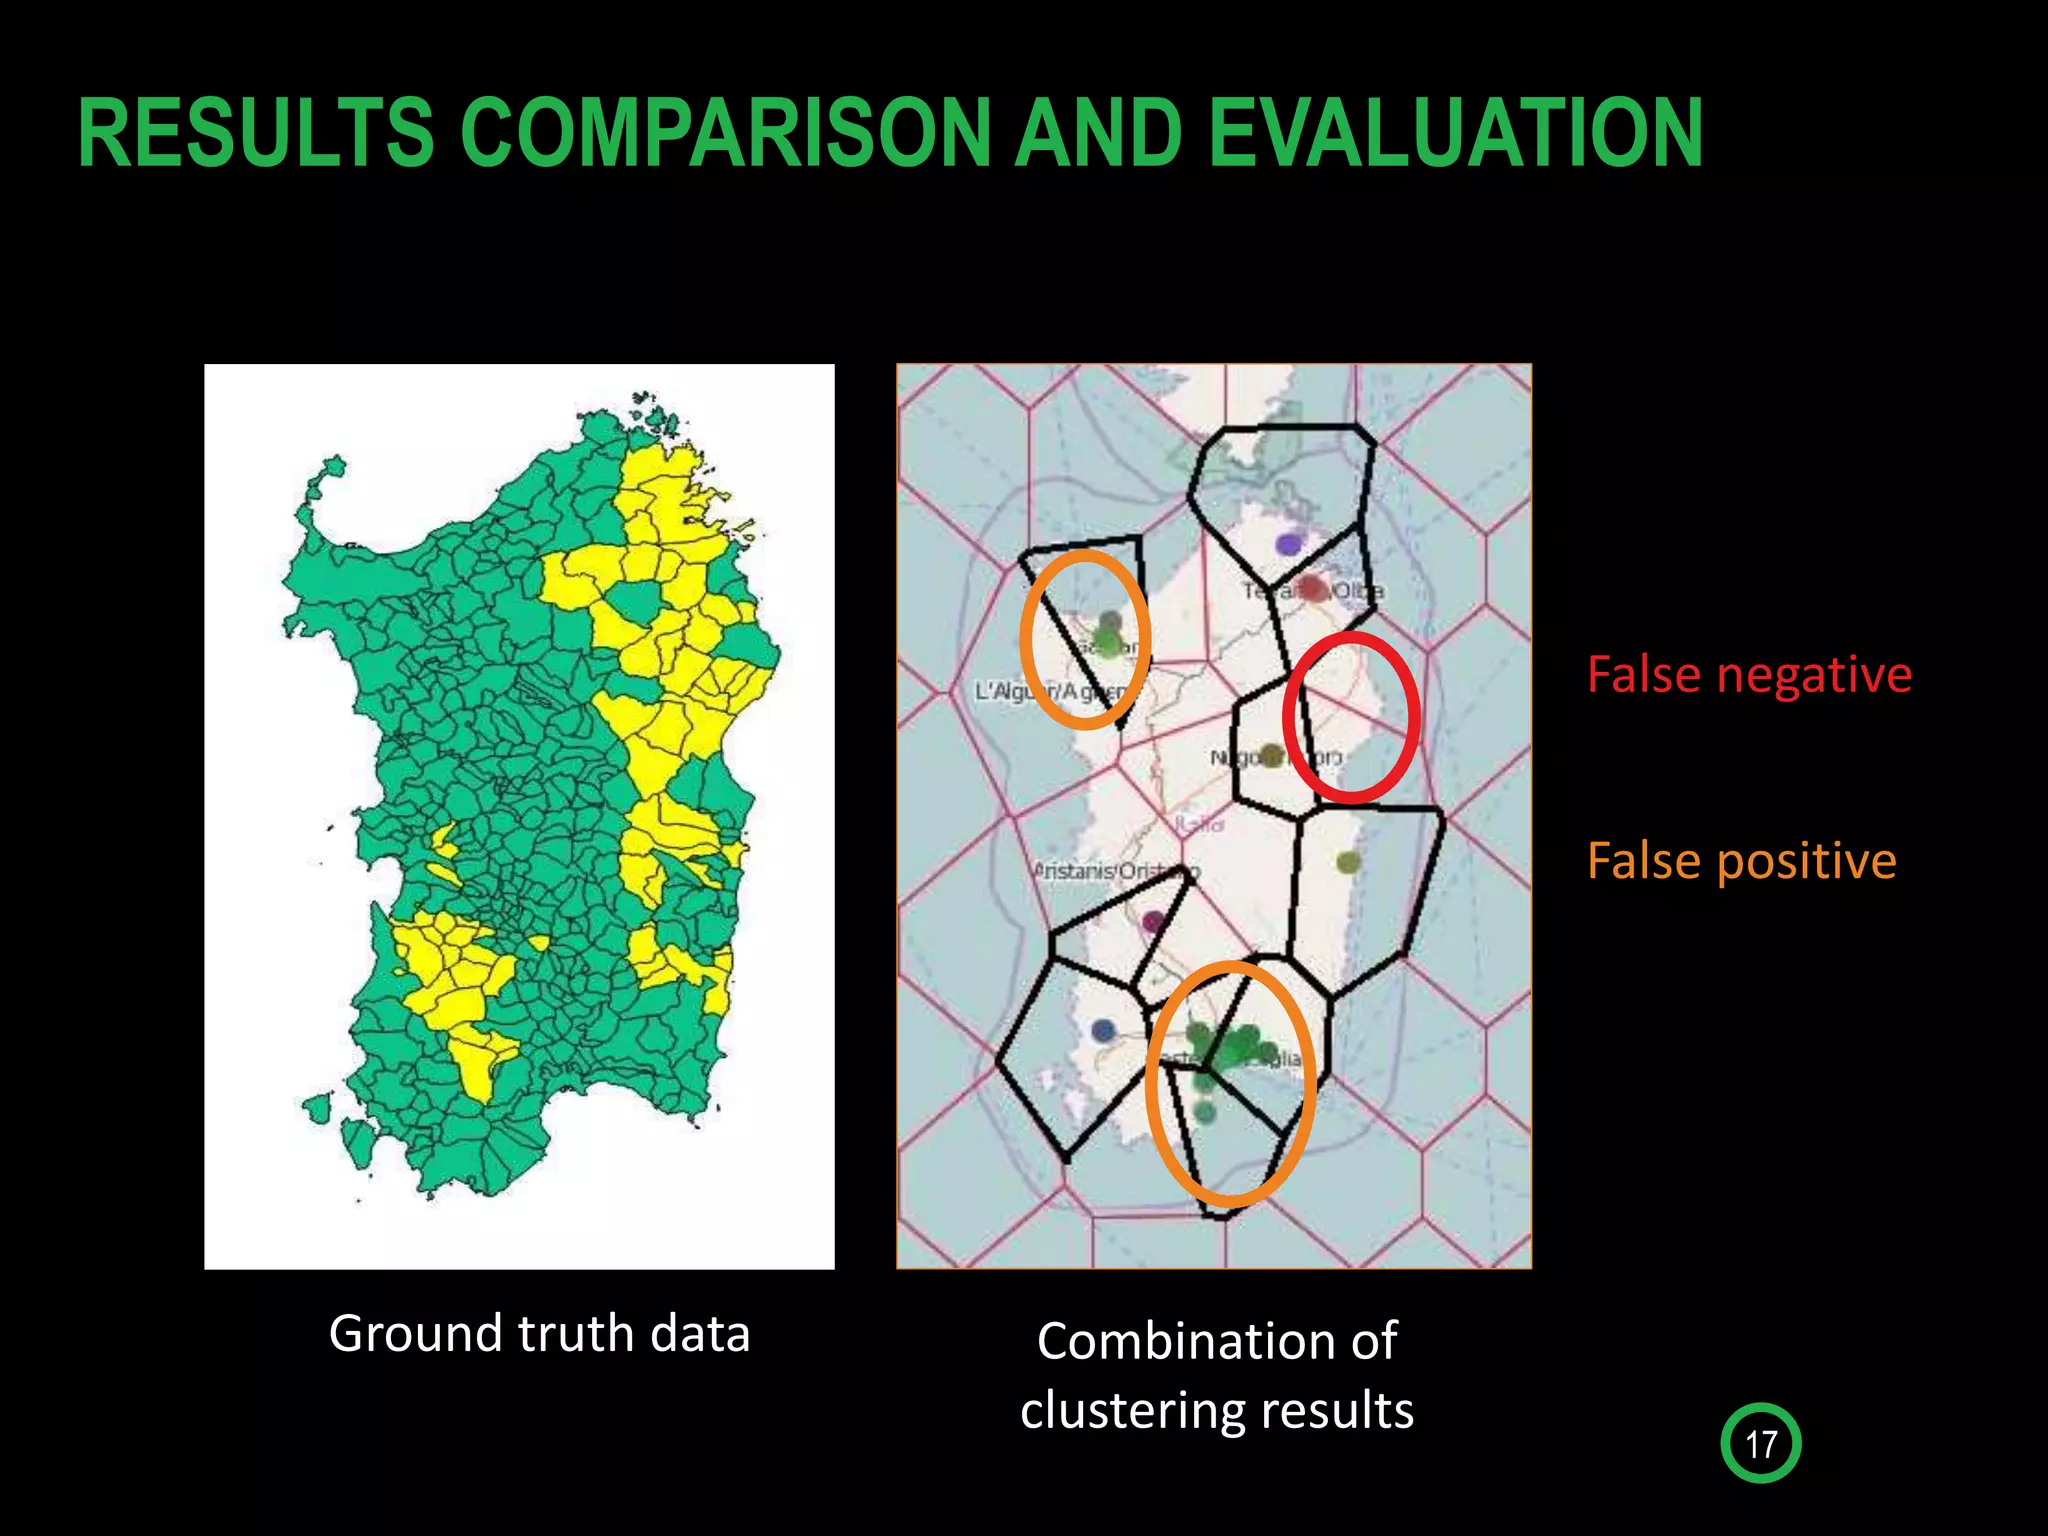
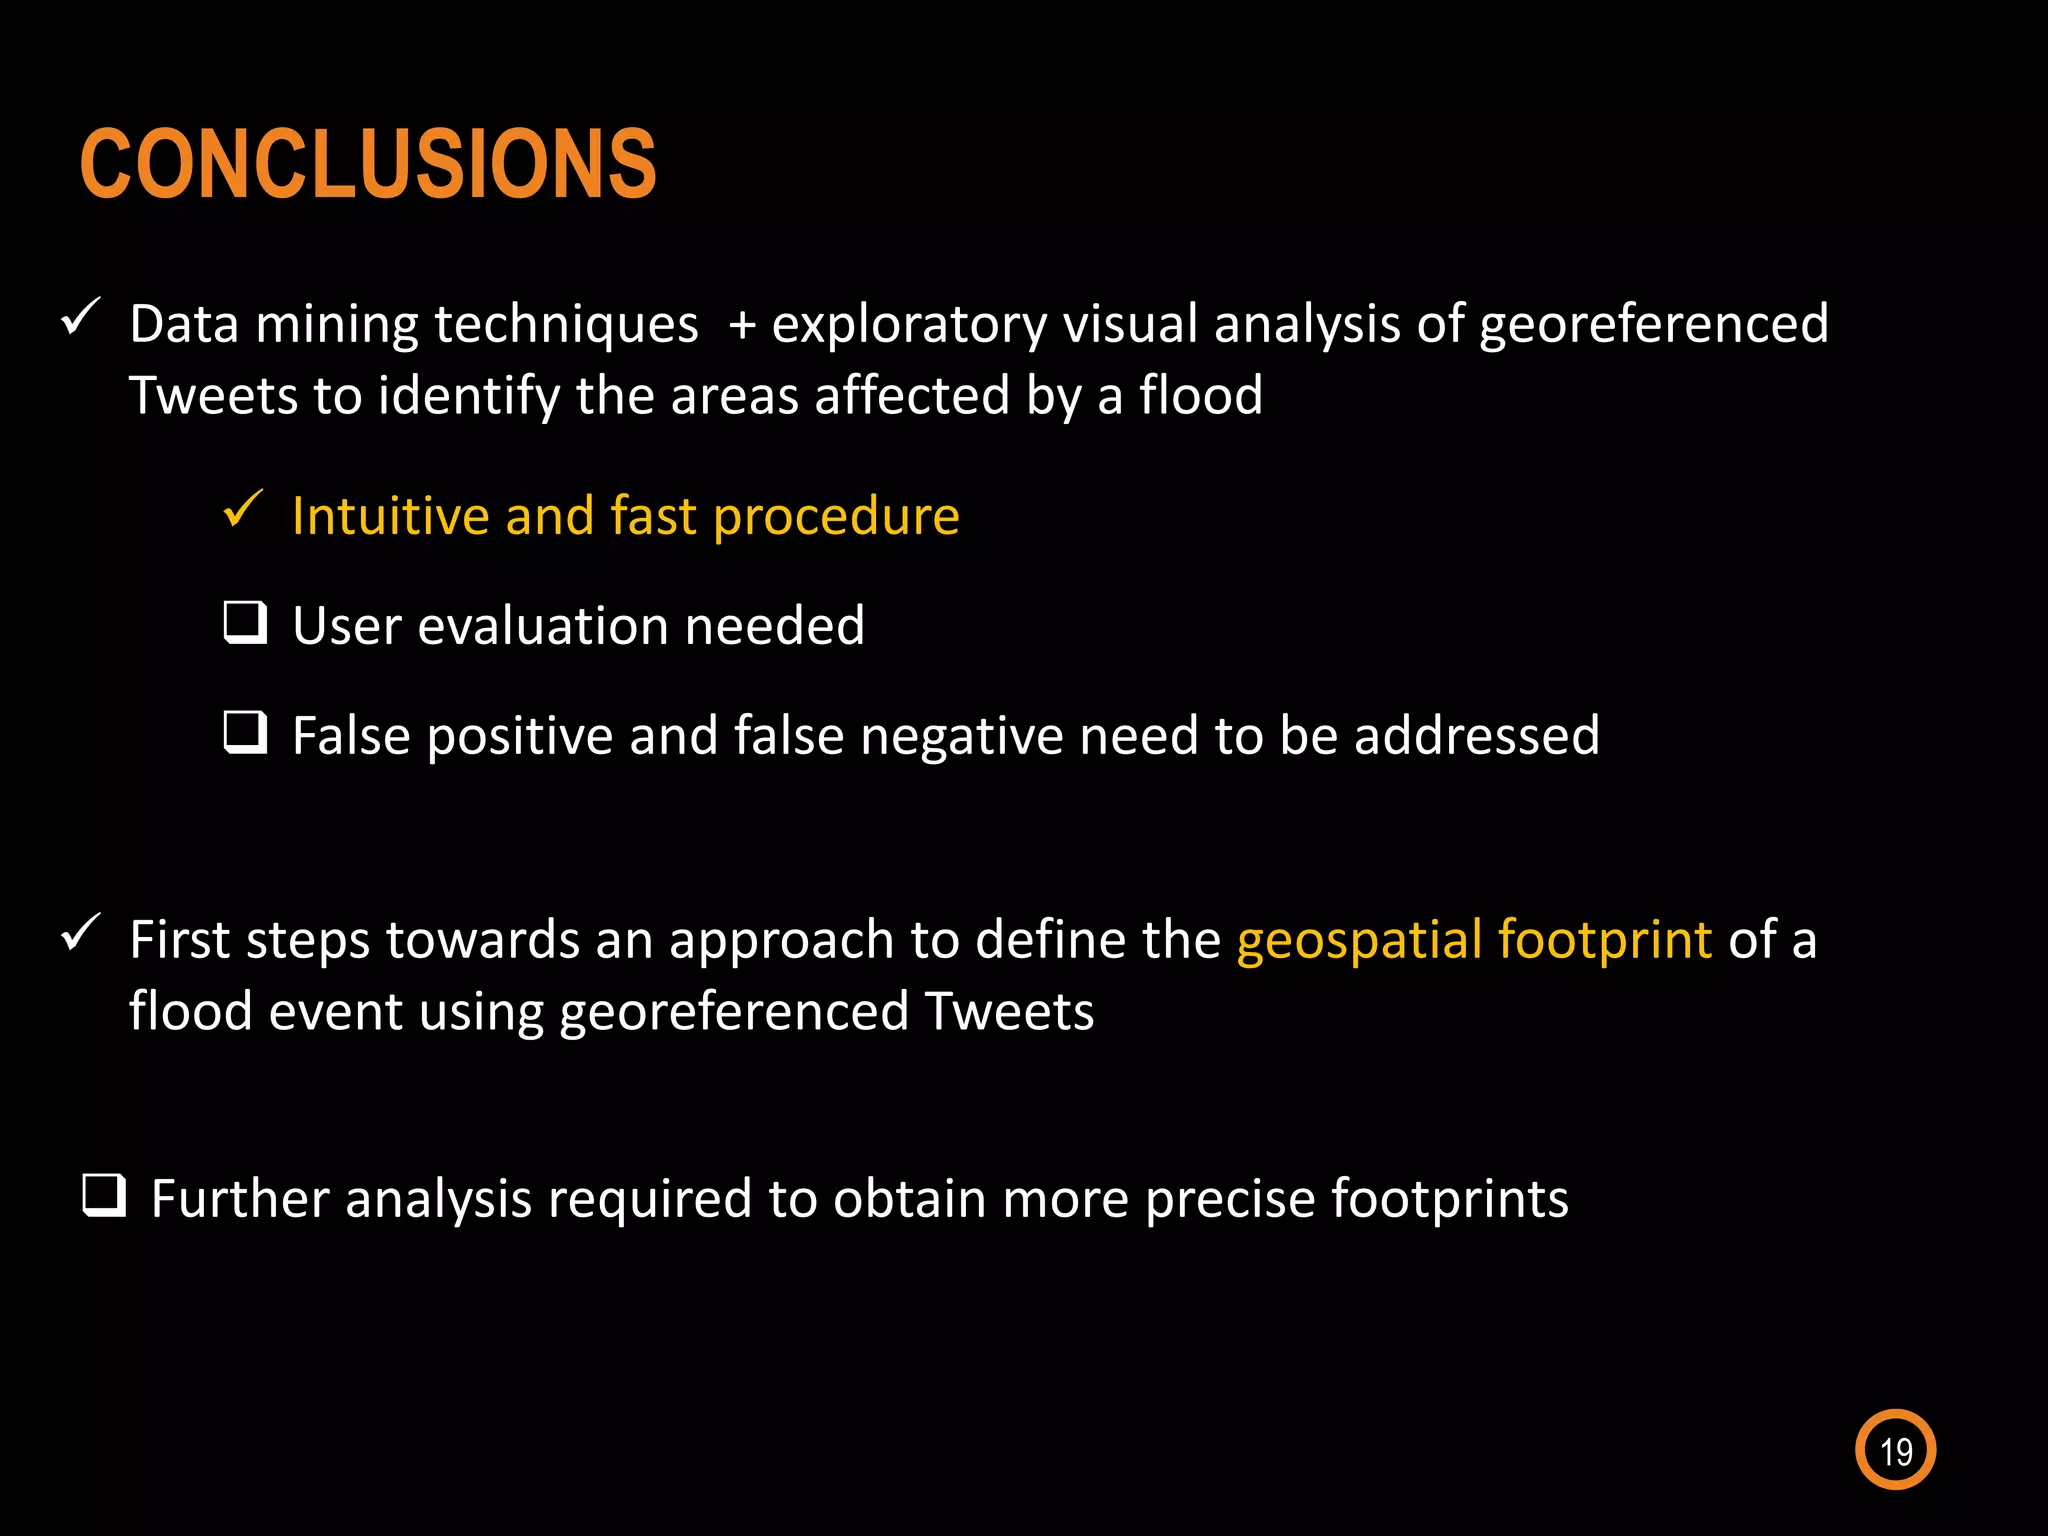
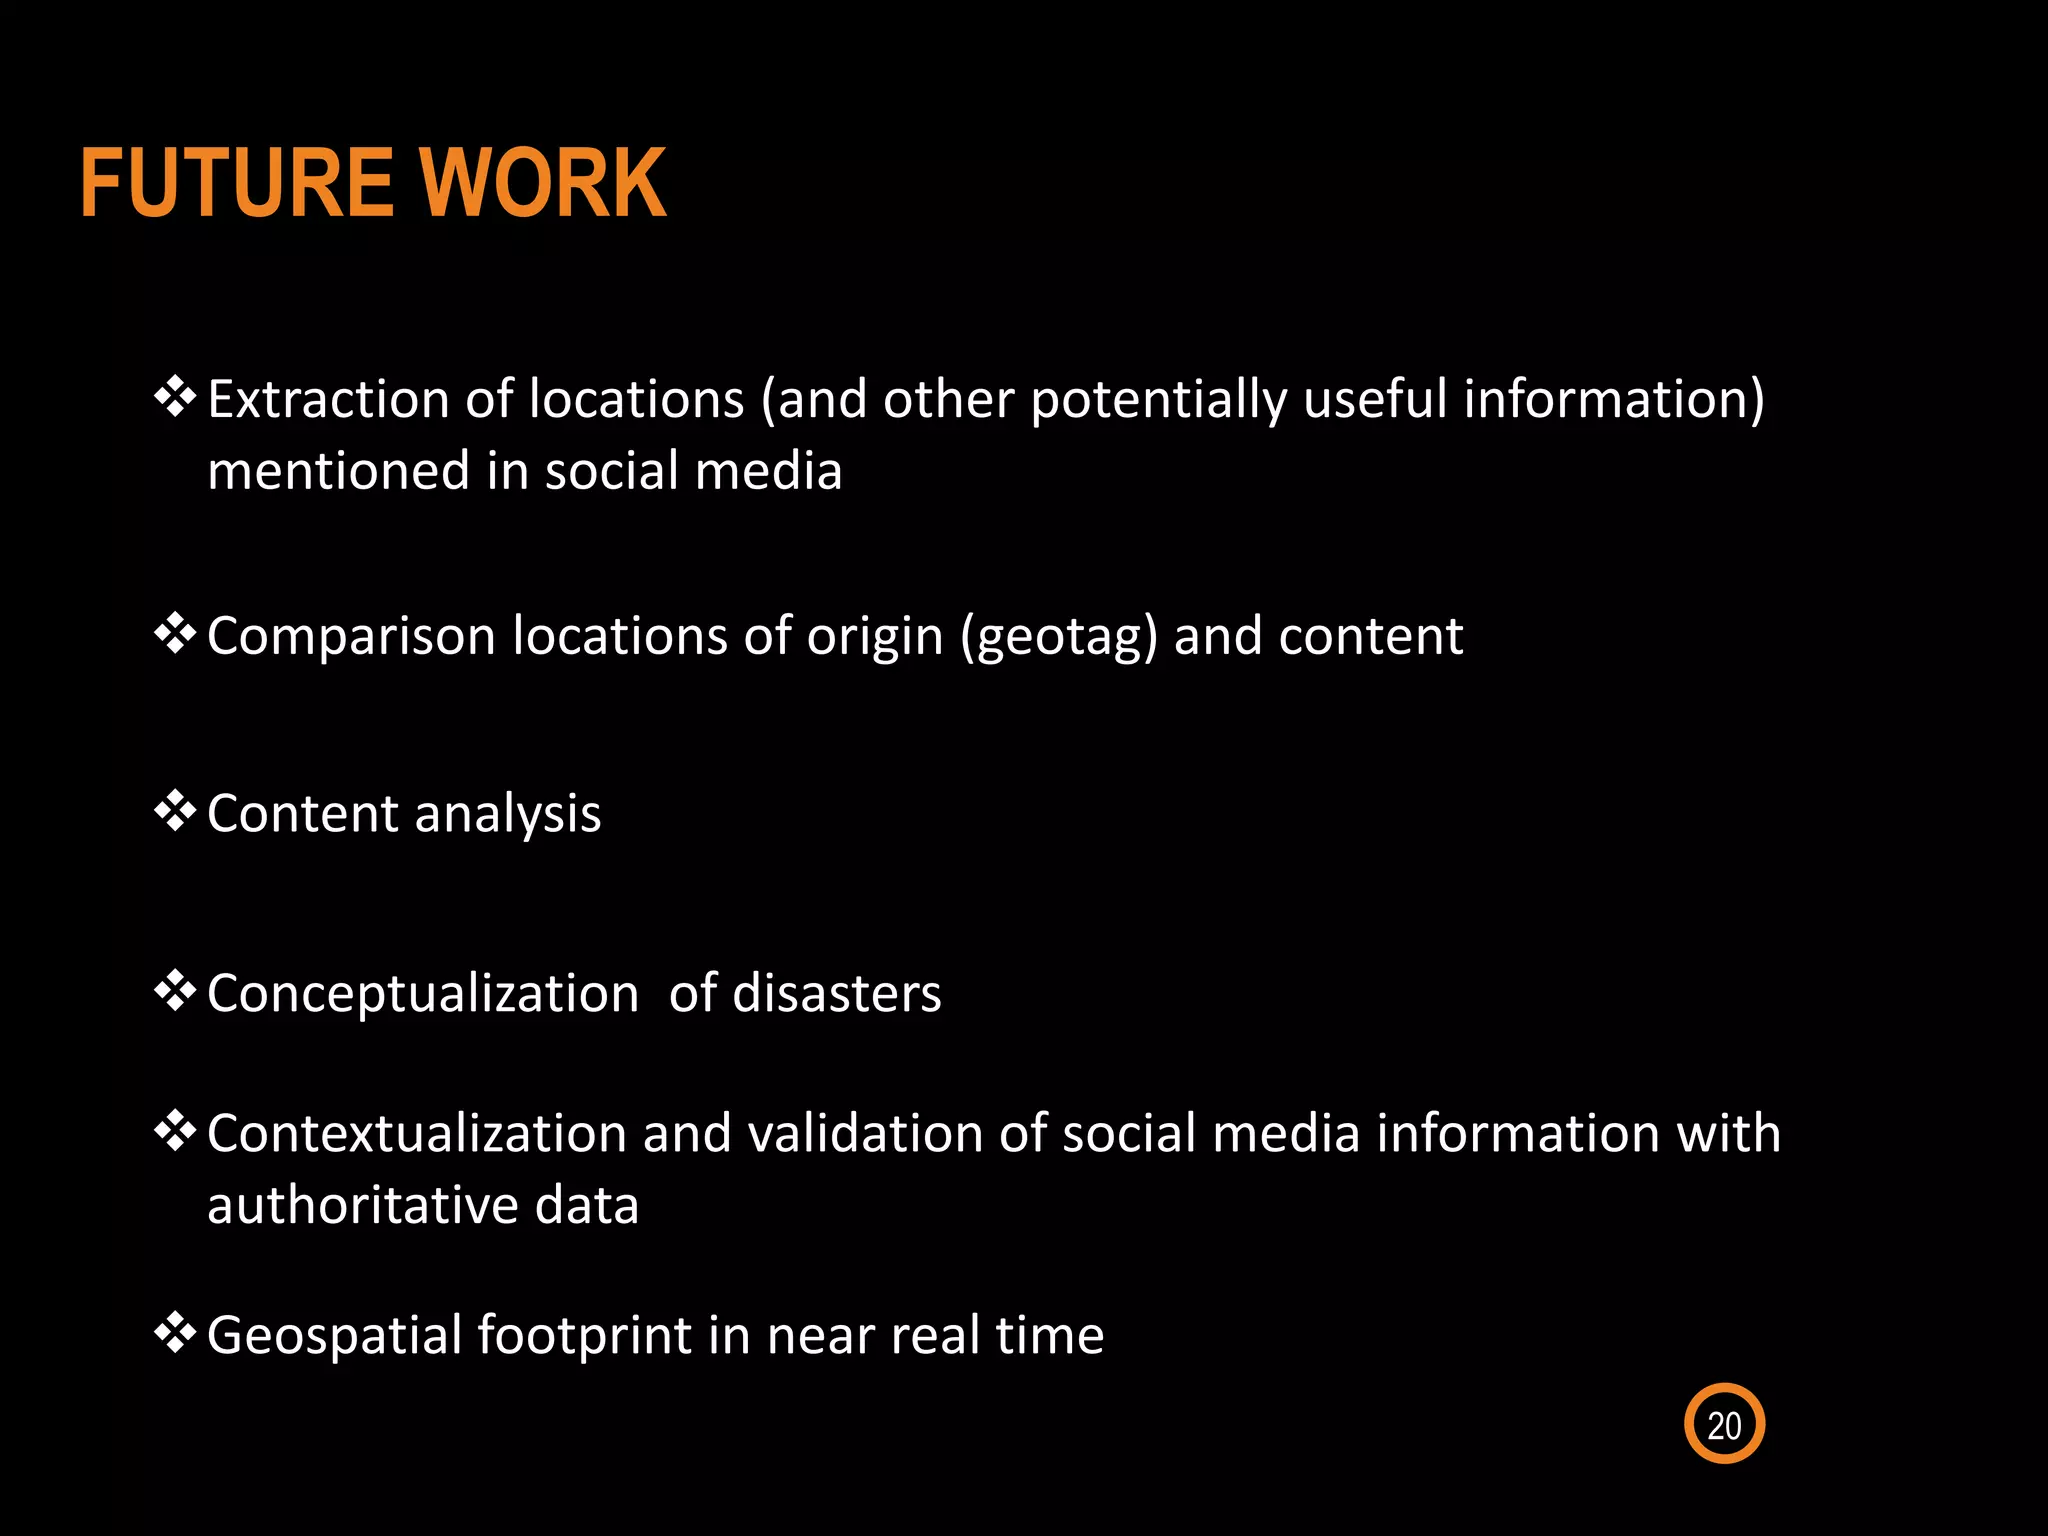
AGILE 2016 Conference, Helsinki - 15th June 2016
Identification of disaster-affected areas using
exploratory visual analysis of georeferenced Tweets:
application to a flood event
V. Cerutti1, G. Fuchs2, G. Andrienko2, N. Andrienko2, F.Ostermann1
1 ITC Faculty of Geo-Information Science and Earth Observation, University of Twente, The Netherlands
2 Fraunhofer IAIS, Sankt Augustin, Germany
IN THIS PRESENTATION:
INTRODUCTION METHODS CASE STUDY CONCLUSIONS AND
FUTURE WORK
AKNOWLEDGMENT
1. 2. 3. 4. 5.
1. INTRODUCTION
3
4
RESEARCH CONTEXT AND MOTIVATION
Social media for Disaster Management - Disaster response phase
Enable decision makers in rapid assessment of the situation
Geographic and temporal extent of disaster effects
5
RESEARCH OBJECTIVES
Conceptual management of crisis information
Geospatial footprint of disaster
Situational awareness and decision making
Combination of data mining and visual analysis
Detection of areas affected by a disaster
Twitter as data source
6
CASE STUDY OBJECTIVE
Help decision makers to assess the spatio-temporal footprint
of a disaster
2. METHODS
7
8
Tweets pre-processing:
• removal of geographically
unrelated data
• pattern-based removal of
machine-generated data
• natural language processing
to mine the data and classify
and annotate its content
DATA PREPROCESSING
CLUSTERING + VISUAL ANALYSIS
9
Clustering techniques to understand how affected places are represented
Tight integration between
computational and visualization
functionality
V-Analytics toolkit (http://geoanalytics.net/)
Need parameterization
 space-time cube
 frequency histograms
 time graphs
 qualitative colouring
 animated maps
 Density-based clustering
 Distance-bounded spatio-temporal event
clustering
 Data-driven territory tessellation
Visual analysis techniques
3. CASE STUDY
10
11
DATA DESCRIPTION AND PREPARATION
Case study: Sardinia flood, 18-19 November 2013
Original dataset: georeferenced Tweets (Dec 2012 -
Apr 2014), bounding box: Italy, collected from
Twitter streaming API
Query: Lexicon of flood-related keywords in Italian
language
Demographic data to normalize the results
Ground truth information from official reports
Final dataset: 3,000 Tweets (Nov 2013)
897 Tweets (18-20 Nov 2013)
12
DATA ANALYSIS
18-19 Nov 2013
Random sample (5%) of georeferenced Tweets
generated during the month of November 2013
Impossible to detect
the flood event
After keyword-based filtering:
13
Spatio-temporal density-based clustering (OPTICS) + visual analysis to select
optimal parameters
DATA ANALYSIS
14
Distance-bounded event clustering + visual analysis to select optimal parameters
DATA ANALYSIS
15
Data-driven territory tessellation + time series of Tweets frequency
DATA ANALYSIS
16
Spatio-temporal density-
based clustering (OPTICS)
Distance-bounded
event clustering
Data-driven territory
tessellation
DATA ANALYSIS
17
RESULTS COMPARISON AND EVALUATION
False negative
Ground truth data Combination of
clustering results
False positive
4. CONCLUSIONS AND
FUTURE WORK
18
19
CONCLUSIONS
 First steps towards an approach to define the geospatial footprint of a
flood event using georeferenced Tweets
 Data mining techniques + exploratory visual analysis of georeferenced
Tweets to identify the areas affected by a flood
 Intuitive and fast procedure
 User evaluation needed
 False positive and false negative need to be addressed
 Further analysis required to obtain more precise footprints
20
Extraction of locations (and other potentially useful information)
mentioned in social media
Comparison locations of origin (geotag) and content
Contextualization and validation of social media information with
authoritative data
FUTURE WORK
Conceptualization of disasters
Content analysis
Geospatial footprint in near real time
5. AKNOWLEDGEMENT
21
AKNOWLEDGEMENT
22
COST ACTION IC 1203
• STSM Grant
Fraunhofer Institute for Intelligent
Analysis and Information Systems
• Knowledge
• Software
• Dataset
THANKS FOR YOUR ATTENTION
QUESTIONS?
v.cerutti@utwente.nl

Identification of disaster-affected areas using exploratory visual analysis of georeferenced Tweets: application to a flood event

  • 1.
    AGILE 2016 Conference,Helsinki - 15th June 2016 Identification of disaster-affected areas using exploratory visual analysis of georeferenced Tweets: application to a flood event V. Cerutti1, G. Fuchs2, G. Andrienko2, N. Andrienko2, F.Ostermann1 1 ITC Faculty of Geo-Information Science and Earth Observation, University of Twente, The Netherlands 2 Fraunhofer IAIS, Sankt Augustin, Germany
  • 2.
    IN THIS PRESENTATION: INTRODUCTIONMETHODS CASE STUDY CONCLUSIONS AND FUTURE WORK AKNOWLEDGMENT 1. 2. 3. 4. 5.
  • 3.
  • 4.
    4 RESEARCH CONTEXT ANDMOTIVATION Social media for Disaster Management - Disaster response phase Enable decision makers in rapid assessment of the situation Geographic and temporal extent of disaster effects
  • 5.
    5 RESEARCH OBJECTIVES Conceptual managementof crisis information Geospatial footprint of disaster Situational awareness and decision making
  • 6.
    Combination of datamining and visual analysis Detection of areas affected by a disaster Twitter as data source 6 CASE STUDY OBJECTIVE Help decision makers to assess the spatio-temporal footprint of a disaster
  • 7.
  • 8.
    8 Tweets pre-processing: • removalof geographically unrelated data • pattern-based removal of machine-generated data • natural language processing to mine the data and classify and annotate its content DATA PREPROCESSING
  • 9.
    CLUSTERING + VISUALANALYSIS 9 Clustering techniques to understand how affected places are represented Tight integration between computational and visualization functionality V-Analytics toolkit (http://geoanalytics.net/) Need parameterization  space-time cube  frequency histograms  time graphs  qualitative colouring  animated maps  Density-based clustering  Distance-bounded spatio-temporal event clustering  Data-driven territory tessellation Visual analysis techniques
  • 10.
  • 11.
    11 DATA DESCRIPTION ANDPREPARATION Case study: Sardinia flood, 18-19 November 2013 Original dataset: georeferenced Tweets (Dec 2012 - Apr 2014), bounding box: Italy, collected from Twitter streaming API Query: Lexicon of flood-related keywords in Italian language Demographic data to normalize the results Ground truth information from official reports Final dataset: 3,000 Tweets (Nov 2013) 897 Tweets (18-20 Nov 2013)
  • 12.
    12 DATA ANALYSIS 18-19 Nov2013 Random sample (5%) of georeferenced Tweets generated during the month of November 2013 Impossible to detect the flood event After keyword-based filtering:
  • 13.
    13 Spatio-temporal density-based clustering(OPTICS) + visual analysis to select optimal parameters DATA ANALYSIS
  • 14.
    14 Distance-bounded event clustering+ visual analysis to select optimal parameters DATA ANALYSIS
  • 15.
    15 Data-driven territory tessellation+ time series of Tweets frequency DATA ANALYSIS
  • 16.
    16 Spatio-temporal density- based clustering(OPTICS) Distance-bounded event clustering Data-driven territory tessellation DATA ANALYSIS
  • 17.
    17 RESULTS COMPARISON ANDEVALUATION False negative Ground truth data Combination of clustering results False positive
  • 18.
  • 19.
    19 CONCLUSIONS  First stepstowards an approach to define the geospatial footprint of a flood event using georeferenced Tweets  Data mining techniques + exploratory visual analysis of georeferenced Tweets to identify the areas affected by a flood  Intuitive and fast procedure  User evaluation needed  False positive and false negative need to be addressed  Further analysis required to obtain more precise footprints
  • 20.
    20 Extraction of locations(and other potentially useful information) mentioned in social media Comparison locations of origin (geotag) and content Contextualization and validation of social media information with authoritative data FUTURE WORK Conceptualization of disasters Content analysis Geospatial footprint in near real time
  • 21.
  • 22.
    AKNOWLEDGEMENT 22 COST ACTION IC1203 • STSM Grant Fraunhofer Institute for Intelligent Analysis and Information Systems • Knowledge • Software • Dataset
  • 23.
    THANKS FOR YOURATTENTION QUESTIONS? v.cerutti@utwente.nl

Editor's Notes

  • #5 The context of the research is disaster management, with particular focus on disaster response phase, when up to date information are needed by decision makers for situational awareness and in order to do a Rapid assessment of affected areas and potential risks and take informed decision about prioritization and allocation of resources. The geographic and temporal extent of disaster effects rarely matches precisely the visible boundaries of damaged infrastructure, burned vegetation, or flooded areas. In-situ measurements from sensors and reports from the affected population can complement the remote sensing perspective, improve situational awareness, contribute to a common operational picture,
  • #6 This work represents the first steps towards an improved conceptual management of crisis information retrieved from social media together with authoritative data, in order to define the geospatial footprint and assess the temporal dynamics of a disaster in near real-time. The geospatial footprint is intended as a Geographical representation of the disaster event with its impacts and potential risks, it is a ean to communicate affected areas, vulnerable areas at risk and other disaster-related information to practitioners and it provides an  Intuitive and easy access to disaster-related information
  • #7 The guiding research question of this paper is how the combination of quantitative data mining methods and qualitative visual analysis methods can help to identify potentially affected areas in a real-world scenario. The methods are applied to a Twitter dataset in order to identify affected areas. During emergencies, practitioners need to obtain a clear picture of the situation and up-to-date information. Data mining can help to synthetize and summarize data retrieved from different social network platforms and visual analytics techniques can help to refine and understand the results of such analyses.
  • #9 filtering via point-in-polygon analysis to retain Tweets originating from Italy, and keyword-list filtering for topicality, which yield sufficient results. After pre-processing, the prepared data set contains relevant data with spatial coordinates and timestamps, i.e., a set of spatio-temporal points.
  • #10 we applied several complementary clustering techniques to understand how affected places are represented. I’ll describe them in the case study. Since all cluster algorithms need parameterization, it is important that the analyst is able to observe and reason about the impact of parameter value selection in space and time, and to adjust these iteratively until a good cluster (in the context of the given situation) has been found. This requires tight integration between computational and visualization functionality various visual analysis techniques have been applied to interpret the results: space-time cube, frequency histograms, time graphs, qualitative colouring, and animated maps. in our case, for all clustering operations, we used the V-Analytics toolkit.
  • #11 The case study we selected to test our methodology is a flood that took place in the Sardinia region (Italy) on 18 and 19 November 2013.
  • #12 We used a set of all the georeferenced Tweets that were posted between December 2012 and April 2014 within a bounding box containing Italy, collected from the Twitter streaming API. To extract potentially relevant flood-related Tweets, we applied a keywords-based filter to this dataset. We built a lexicon containing flood-related keywords in Italian language. The final dataset consist of 3000 tweets for Nov 2013, of which 900 generated during the day of the flood Demographic data was then used to normalize the results and filter out big clusters in large cities and to better compare the analysis results. For evaluation of our results, we relied on ground truth information from official reports.
  • #13 using a random sample containing 5% of all georeferenced Tweets dataset generated during the month of November 2013, it was not possible to detect the flood event visually, because no significant increase or decrease in the number of Tweets occurred in the temporal proximity of the flood. After applying the flood-related keyword-based filter, we could visually detect a rapid increase in the Tweets frequencies during the 18th and 19th of November 2013
  • #14 Density-based clustering detects densely populated regions in space-time with arbitrary shape; therefore, density-based clusters may indicate the spatial and temporal extent of a flood-related event. The number of clusters is not pre-determined and isolated points are optionally discarded as noise, therefore this method is suited for an initial overview and detection of (significant) event candidates. We used the OPTICS [8] implementation integrated in V-Analytics.
  • #15 Distance-bounded spatio-temporal event clustering is similar to the previous one in the fact that has a notion of point densities defined around any given point’s neighbourhood. Unlike density-based clustering, it can be applied to time-dynamic data sets (data streams) and thus can detect emerging spatio-temporal clusters and track their evolution in real-time.
  • #16 Data-driven territory tessellation divides a territory into convex polygons of approximately equal sizes on the basis of point distribution. The algorithm looks for spatial clusters of points that can be enclosed by circles with a user-chosen radius. The cluster centroids are then used to generate Voronoi polygons. Points can be aggregated in space by the tessellation and in time by user-selected time intervals (e.g. days or months). we aggregated the data in space using the data-driven territory tessellation - obtaining Voronoi polygons around groups of points using maximus group radius of 25 km – and in time using 1-day time interval. From the time series graph of tweets frequencies, it was possible to identify which areas (corresponding to the Voronoi polygons) were potentially affected. This method found less possibly affected areas compared with the previous two.
  • #17 Both Optics and distance bounded event clustering techniques resulted in identifying similar areas potentially affected by the flood. While the territory tessellation detect less and larger areas
  • #18 To better establish affected areas we combined the results of clustering methods with the spatial tessellation, and considered as affected those areas corresponding to Voronoi polygons in which clusters reside. The comparison between the results of the clustering methods and the ground truth data shows how our analysis performed well in the identification of affected areas, resulting in few false negative. False positives appear in areas nearby Cagliari (south of Sardinia) and Sassari (north-west of Sardinia), classified as affected while they were not. Analysts can explain or remove false positive by contextualizing the results. According to official reports (see Section 3.1), these cities played an active role in the emergency management during the flood, so this can explain the biases, and points at the benefits of future work for better contextualizing the data and the analysis.
  • #20 Better contextualization of data to reduce false positive and false negative Focus on local scale
  • #23 To conclude, this paper is the result of a scientific mission financed by cost Energic, so thanks are needed. In addition I want to thank Fraunhofer institute and in particular Gennady, Natalia andrienko ang Georg Fuchs for their support, and for providing the software and the dataset that has been used for the case study.