Download to read offline
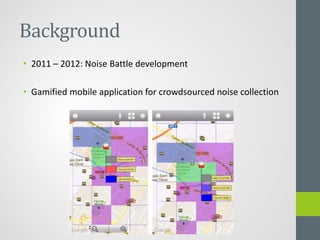
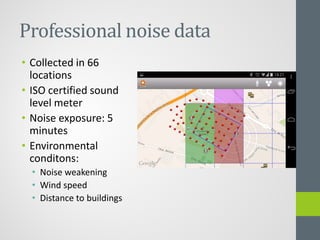
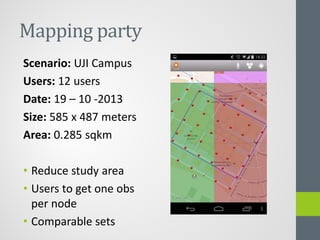
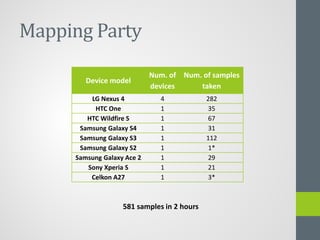
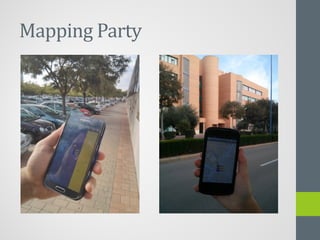
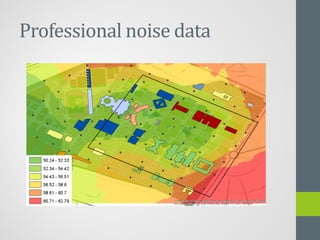
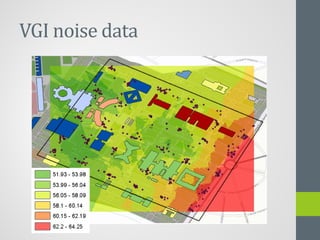
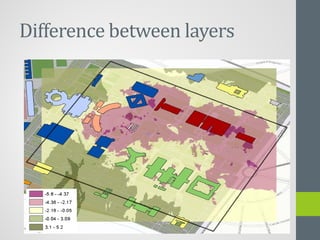
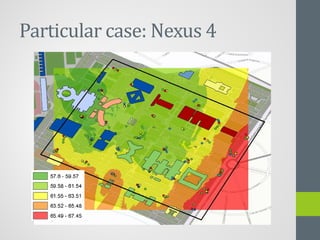
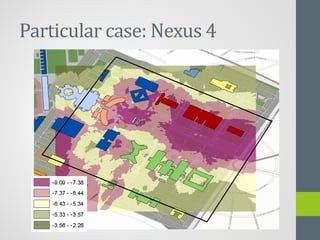
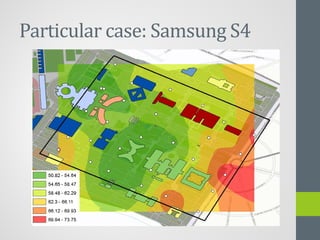
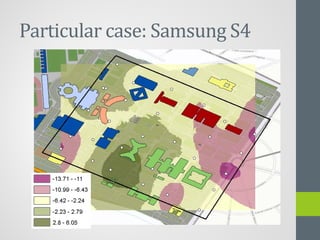
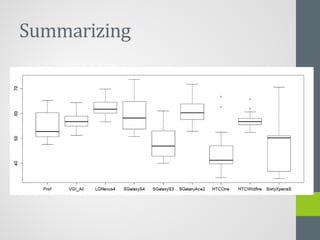


This study compared noise pollution data collected by volunteers using a mobile app to professional noise measurements. Volunteers used various smartphones to record noise levels at 66 locations on a university campus over 2 hours. Their data was compared to noise levels measured by certified sound meters at the same locations. While single devices showed errors of 3-5dB, averaging multiple citizen recordings produced data that accurately reflected noise patterns and was within accepted accuracy levels compared to the professional measurements. The study demonstrated that volunteer-collected geographic information (VGI) can be reliable for noise mapping and identifying potential pollution issues, though certified devices remain necessary for applications requiring high precision.


