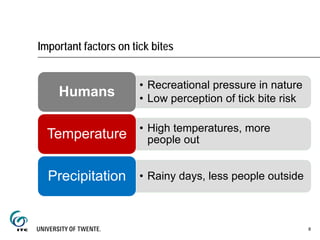
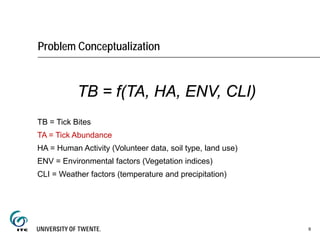
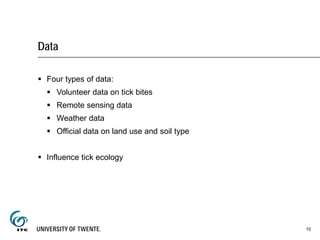
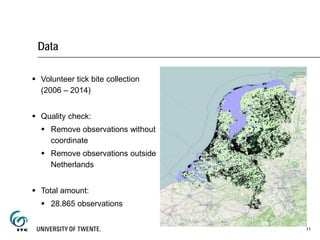
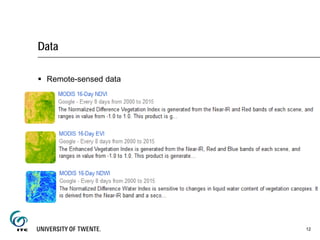
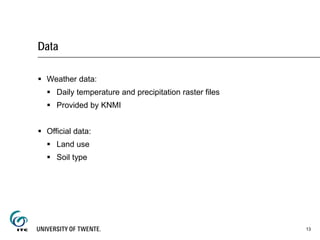
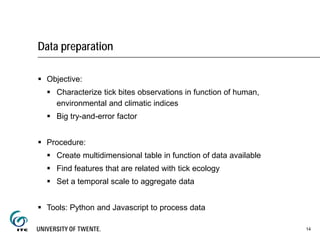
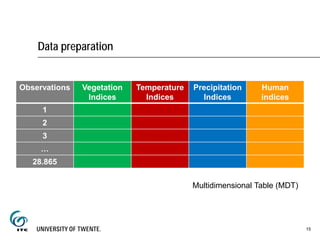
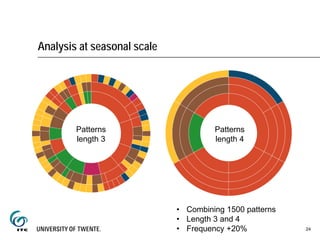
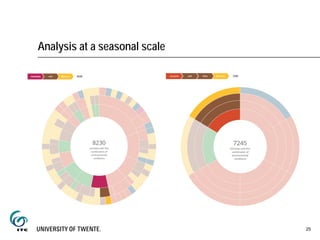
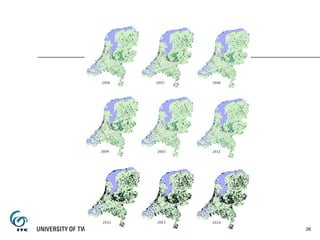
Slides used during the guest lecture in the KIT & ITC course on "Using Geographic Information Systems in disease control programs". Link: https://www.kit.nl/health/training/using-geographic-information-systems-disease-control-programs-gis/
VIP High Class Call Girls Jamshedpur Anushka 8250192130 Independent Escort Se...
Modelling tick bites dynamics using VGI (2015)
1. Modelling tick bites dynamics
using volunteer data
Irene Garcia-Martí
PhD Candidate
Dept. of Geo-Information Processing (GIP)
ITC – University of Twente
25th May 2015
7. Important factors on tick densities
• Start questing season
• Survival through winterTemperature
• Increases tick survival
• Prevent tick dessicationPrecipitation
• Keeps soil moisture high
• Prevent tick dessicationVegetation
• Sustains tick populationWildlife
7
8. Important factors on tick bites
• Recreational pressure in nature
• Low perception of tick bite risk
Humans
• High temperatures, more
people outTemperature
• Rainy days, less people outsidePrecipitation
8
9. Problem Conceptualization
TB = f(TA, HA, ENV, CLI)
TB = Tick Bites
TA = Tick Abundance
HA = Human Activity (Volunteer data, soil type, land use)
ENV = Environmental factors (Vegetation indices)
CLI = Weather factors (temperature and precipitation)
9
10. Data
Four types of data:
Volunteer data on tick bites
Remote sensing data
Weather data
Official data on land use and soil type
Influence tick ecology
10
11. Data
Volunteer tick bite collection
(2006 – 2014)
Quality check:
Remove observations without
coordinate
Remove observations outside
Netherlands
Total amount:
28.865 observations
11
13. Data
Weather data:
Daily temperature and precipitation raster files
Provided by KNMI
Official data:
Land use
Soil type
13
14. Data preparation
Objective:
Characterize tick bites observations in function of human,
environmental and climatic indices
Big try-and-error factor
Procedure:
Create multidimensional table in function of data available
Find features that are related with tick ecology
Set a temporal scale to aggregate data
Tools: Python and Javascript to process data
14
16. Data preparation
Why are we doing this?
Find conditions where humans are more exposed to tick bites that are
frequent in data
Find clusters of these conditions and study spatial patterns
Direct prevention campaigns
16
17. Analysis overview
Analysis:
MDT: Input for modeling with data mining algorithms
Three experiments:
1st: Clustering and classification techniques
2nd: Frequent pattern mining (today!)
3rd: Decision Trees (on-going)
Visualization with maps and ringmaps
17
18. What is frequent pattern mining?
FPM is:
Technique to find statistically relevant patterns in data
Try to find the longest combination of elements with a frequency above
a threshold
Multiple algorithms:
Apriori
Eclat
FP-Growth
Toy example with supermarket list
18
20. How does Apriori work?
Key idea: A pattern is frequent if
its subsets are also frequent
User sets a threshold to consider
a pattern frequent
Pattern generation is bottom-up
Computationally expensive:
One level per different item
Multiple passes on data
20
22. Back to the analysis
No more supermarket items
Reality:
Apriori:
Will scan combinations of 39 different items
Will receive 28.865 rows as an input
Data on temperature, precipitation, vegetation and human indices
Thousands of patterns may be generated
Depending on the threshold
Challenge for visualization
Patterns combined using ringmaps
22
27. Conclusions
Identified combinations of indices where tick bites occurred:
Adding human-related variables seem to produce meaningful results
Still no spatial pattern:
Humans are a biasing factor.
It suggests there are ticks and humans everywhere
Further work:
Converge to a suitable temporal scale for tick dynamics and humans
Spatial aggregation of observations (forest, neighborhood, grid cell)
More human-related indices, less nature-related indices
27
28. Discussion
Do any of you knew Lyme disease before?
Do any of you have experience in modeling species?
What else would you include in the analysis?
28