This document discusses using geo-historical modeling to simulate past disasters and catastrophes in order to better understand and manage risks. It notes that while digital information on recent events is abundant, information on past events is limited due to lack of digitization. Geo-historical modeling aims to address this by extrapolating available information to simulate digital models of past events and explore "what if" scenarios. This allows learning lessons from history to improve modern disaster risk management.
Presentation to Digital Humanities class at Pratt Institute on the history of computing in the field of archaeology and current digital humanities projects.
Risk sharing society, in such a way the disaster risk reduction is sutained. it is using a tool based on radar weather detection, which can be found also, in a professional orientation for a career. The difference is in the mindest and number of variables. The tool is called MAPS (Mobility Action Project Safety) in order to mimic Sendai Framework disaster Risk Reduction. It is a vectorial representation. Basic case, like the nuclear threat or finding yourself alone on in a storm at sea on a boat, are univariable or zero. Most complex case with more variables refer to flood, and other flood related hazards. In principle, the risk reduction strategy is to reduce the gap between MAPS and the geographical map that is representing loca features of your natural or built environment. If a person or an individualized organization members are able to anile the gap between MAPS and map, the risk exit to a threat is secure. If not, there is a need to rework the strategy, by revisiting an reviewing MAPS through lens of your organization local human and geography investigations of Strength, Weaknesses, Threats and opportunity. This tool is a personal design, which was inspired by my organization experience. It has been proven to work, effectively because it was based on a discipline of the Organisation preparedness before the predicted risk arrival time, and implementing the plan when a risk has occurred to remove the threats and reduce losses to people, lives, assets and properties.
VIRTUAL SCENE CONSTRUCTION OF LARGE-SCALE CULTURAL HERITAGE : A FRAMEWORK INI...csandit
Virtual reality technology has been applied to the protection of cultural heritage for about 20 years. However, methods or systems of cultural heritage reported in previous studies are still unable to represent large-scale cultural heritage sites such as the Beijing-Hangzhou Grand Canal, the Struve Geodetic Arc and the boundaries of the Roman Empire. We aimed at
constructing a large-scale cultural-heritage 3-D model with the focus on better management and organization of the scene. Starting from the case study of the Beijing-Hangzhou Grand
Canal, we first explore various remote sensing data suitable for large-scale cultural heritage modeling, and then adopt a 3-D geographic global information system for large-scale 3-D
scene organization and management.
VIRTUAL SCENE CONSTRUCTION OF LARGE-SCALE CULTURAL HERITAGE : A FRAMEWORK INI...cscpconf
Virtual reality technology has been applied to the protection of cultural heritage for about 20 years. However, methods or systems of cultural heritage reported in previous studies are still unable to represent large-scale cultural heritage sites such as the Beijing-Hangzhou Grand Canal, the Struve Geodetic Arc and the boundaries of the Roman Empire. We aimed at constructing a large-scale cultural-heritage 3-D model with the focus on better management and organization of the scene. Starting from the case study of the Beijing-Hangzhou Grand Canal, we first explore various remote sensing data suitable for large-scale cultural heritage modeling, and then adopt a 3-D geographic global information system for large-scale 3-D scene organization and management. The entire 3-D virtual scene reconstruction process can be divided into four steps. The first one is the remote-sensing data preparation, where TM, SPOT5 and other remote sensing data were selected according to the characteristics of the cultural heritage of the Grand Canal and further subjected to data filtering and geometric correction. In the second step, the 3-D terrain modeling was carried out based on 3-D earth model segmentation and tile hierarchy system, where we fused and split remote sensing image and sampling spatial information for 3-D terrain model. The third step involves the modeling of local heritage with sophisticated modeling techniques sufficient to build a heritage 3-D model and to integrate terrain model with local scene through aerial orthophotos. Finally, in the fourth step the virtual scene integration is performed in a 3-D spherical system, where we designed a tree nodes system to assembly and manage multi-level and multi-type models of the Grand Canal. After these four steps are completed, the large-scale cultural heritage scene in 3-D spherical information system can be achieved. Here, we address main challenges in virtual scene reconstruction of large-scale cultural heritage. This study can be valuable for regional and national cultural heritage protection as well as for Chinese government as a reference to infrastructural research, and finally for stimulation of other large-scale cultural heritage research around the world both in 3-D modeling and virtual scene organization.
Personas como sensores; personas como actores.pcd.unia
Conferencia de Fabien Girardin en el ciclo "La Ciudad Híbrida. VIsualización Urbana y Mapeo Colaborativo" dirigido por José Luis de Vicente para el Espacio-Red de Prácticas y Culturas Digitales de la Universidad Internacional de Andalucía.
Las tecnologías ubicuas que nos ofrecen diariamente una nueva flexibilidad que facilita nuestra vida personal proporcionan al mismo tiempo los medios para localizarnos. Esta presentación examinará cómo las interacciones registradas con infraestructuras “soft” contemporáneas revelan elementos de nuestra movilidad e indicadores para evaluar el entorno híbrido urbano. Consideraré la aspereza y las grietas de esta emergente capa de información. Sin embargo, en vez de analizar una perspectiva utilitarista que modela la ciudad como un sistema y busca mejorar su eficiencia, me centraré en el lado humano de los datos y cómo su subjetividad y contingencia alteran nuestra relación con el espacio.
The enhancement of Underwater Cultural Heritage Assets using Augmented Realit...University of Piraeus
Τhe development in the fields of Underwater Cultural Heritage (UCH) management and Maritime Archaeology, yields an interdisciplinary and creative academic framework, such as the Information and Communication Technologies (ICT) sector that has been proved to build intelligent systems and applications. However, the ways to fully make use of these technologies are still being explored, as their potential have not been exploited yet. Underwater archaeological sites, semi (/or fully) submerged settlements, ancient ports and shipwrecks, unlike land sites, are not accessible to public due to their special (sub) marine environment and depth. In this paper, an innovative research idea of using Augmented Reality (AR) for maintaining the memory and the information of underwater archaeological sites, is presented. Although the “artificial” visual documentation cannot replace the authentic values of the underwater tangible heritage, the AR technology can contribute to the protection of the intangible properties and the conquered knowledge of the past of a place. This research work will focus, among other case studies, on the (semi) submerged fortifications and their contiguous contents of the acropolis of Halai in east Lokris, Greece. Hence, along with the climate change that may lead more antiquities covered by water during the following years, the advances in the communication field and the up-coming 5G and cloud technologies will make the idea fully applicable, contributing to the enhancement of the coastal and the underwater archaeological remains.
Scira Menoni: Vulnerabilità e resilienza urbana e territoriale: come l’urbanistica e la pianificazione territoriale possono contribuire a politiche di prevenzione.- Urban vulnerability and resilience: how planning may contribute to mitigation policies. Lesson 1: unfortunately negative examples.
What can be done to mitigate risks? Risk assessment / Risk mitigation measures: structural and non structural, long and
short term / Implementation tools: laws, regulations, directives, economic tools –insurance, incentives, taxes- voluntary….
Ulrich Beck reminds us of the fact the in risks imply a tightly coupled combination of “facts” and “values” that make any risk related decision neither purely technical nor purely political.
The complexity of risk conditions requires a suitable approach for a world of infrastructures and settlements built as a sole system.
Landslide early warning systems: a perspective from the internet of things IJECEIAES
Populations located in the vicinity of slopes and soils derived from volcanic ash are constantly at risk due to the possibility of landslides. Such is the case of the city of Manizales, Colombia, which, due to its geomorphological characteristics, has experienced a significant number of landslides that have caused human and economic losses. The Internet of things (IoT) has allowed important technological advances for monitoring, thanks to the low cost and wide coverage of IoT-based systems. Slope monitoring and the development of landslide early warning systems (EWS) have been positively impacted by IoT developments, which shows a relationship. The objective of this article is to review, from the scientific production, the relationship between IoT and EWS. For this purpose, a fragmenting-deriving-combining methodology is applied to focus on a research trends analysis of the subject, from macroareas such as IoT and EWS to micro areas such as EWS by IoT-based landslides. Finally, the analysis concluded that the conceptual models of IoT and EWS for landslides have some correspondence in some of their layers.
Information Art is a diverse range of human activities in creating visual, auditory or performing artifacts (artworks), expressing the author's imaginative, conceptual ideas, or technical skill, intended to be appreciated for their beauty or emotional power. Other activities related to the production of works of art include the criticism of art, the study of the history of art, and the aesthetic dissemination[clarification needed] of art.
We are now in the “Century of the City” where urbanization defines our social,economic,and environmental characteristics.
In this era of the Anthropocene, when we are altering the functioning of the global environment, the term “Astycene” accurately describes this “new urban era” where “anthropos” is an “astos,” a dweller of an urban area. The term has been derived from two Greek words:αστυ, i.e., asty= city, town and καιν, i.e., cene= new.
Hence, my topic of presentation is: “Mapping the Astycene”
Economic development in New Mexico can be achieved if we integrate the scientific and cultural tools, traditions and resources of the Rio Grande valley.
keynote at Irish HCI, Limerick, 2nd Nov 2018
http://alandix.com/academic/talks/IHCI-deep-digitality-2018/
We constantly hear about disruptive technology, but how radical is the change due to digital technology?
In the hills and mountains of the South Wales coal valleys, rivers radiate out and then south toward the sea. This seems reasonable until you learn that the geology beneath is a syncline a basin-shaped structure of rock strata. The current rivers form a superimposed drainage pattern, the routes the rivers ran before the geology changed. As the ground rose and sank below, the rivers maintained their old courses, a relic of a one hundred million year past.
In reality digital technology is often like this, largely reinforcing the existing structures of power and organisation in government, commerce and health. The digital geology is changing beneath our feet and yet digital technology cuts the same paths.
Can we reimagine industry and civic society if digital technology had come first, before the industrial revolution and maybe even before the rise of the mercantile class?
Art is Open Source at Visualize: materials and links
Some links and resources explored at the Visualize talk and workshop in Lecce, Italy, June 2014
more info here:
http://www.artisopensource.net/network/artisopensource/2014/04/17/micro-histories-of-cities-and-ubiquitous-commons-at-visualize-in-lecce/
Pablo Suarez - Become a Disaster Manager: Red Cross VR Explorations for Flood...SeriousGamesAssoc
Pablo Suarez, Red Cross/Red Crescent Climate Change Center
This presentation was given at the 2017 Serious Play Conference, hosted by the George Mason University - Virginia Serious Play Institute.
Can you help save lives and money by taking action before a disaster hits? A new virtual reality (VR) game created by the Red Cross/Red Crescent Climate Centre puts users in the shoes of decision makers, letting them decide whether or not to ring an alarm bell, stamp papers for aid delivery, and load supplies into a relief truck – all from a virtual hill overlooking the green valley and the surging waters of the dam.
Ubiquitous Commons workshop at transmediale 2015, Capture AllSalvatore Iaconesi
Here are the slides from the workshop, with a framing of the concept of Ubiquitous Commons, a series of examples and links, and an update about how the development of the toolkits (legal, technological, philosophical, aesthetic) are going, together with some source code and prototypes.
More info can also be gathered here:
human-ecosystems.com/home/ubiquitous-commons-the-slides-from-the-workshop-at-transmediale-festival-in-berlin
Earliest Galaxies in the JADES Origins Field: Luminosity Function and Cosmic ...Sérgio Sacani
We characterize the earliest galaxy population in the JADES Origins Field (JOF), the deepest
imaging field observed with JWST. We make use of the ancillary Hubble optical images (5 filters
spanning 0.4−0.9µm) and novel JWST images with 14 filters spanning 0.8−5µm, including 7 mediumband filters, and reaching total exposure times of up to 46 hours per filter. We combine all our data
at > 2.3µm to construct an ultradeep image, reaching as deep as ≈ 31.4 AB mag in the stack and
30.3-31.0 AB mag (5σ, r = 0.1” circular aperture) in individual filters. We measure photometric
redshifts and use robust selection criteria to identify a sample of eight galaxy candidates at redshifts
z = 11.5 − 15. These objects show compact half-light radii of R1/2 ∼ 50 − 200pc, stellar masses of
M⋆ ∼ 107−108M⊙, and star-formation rates of SFR ∼ 0.1−1 M⊙ yr−1
. Our search finds no candidates
at 15 < z < 20, placing upper limits at these redshifts. We develop a forward modeling approach to
infer the properties of the evolving luminosity function without binning in redshift or luminosity that
marginalizes over the photometric redshift uncertainty of our candidate galaxies and incorporates the
impact of non-detections. We find a z = 12 luminosity function in good agreement with prior results,
and that the luminosity function normalization and UV luminosity density decline by a factor of ∼ 2.5
from z = 12 to z = 14. We discuss the possible implications of our results in the context of theoretical
models for evolution of the dark matter halo mass function.
More Related Content
Similar to A presentation of the ARCHIVES Project to the ISCRAM-MED Conference
Scira Menoni: Vulnerabilità e resilienza urbana e territoriale: come l’urbanistica e la pianificazione territoriale possono contribuire a politiche di prevenzione.- Urban vulnerability and resilience: how planning may contribute to mitigation policies. Lesson 1: unfortunately negative examples.
What can be done to mitigate risks? Risk assessment / Risk mitigation measures: structural and non structural, long and
short term / Implementation tools: laws, regulations, directives, economic tools –insurance, incentives, taxes- voluntary….
Ulrich Beck reminds us of the fact the in risks imply a tightly coupled combination of “facts” and “values” that make any risk related decision neither purely technical nor purely political.
The complexity of risk conditions requires a suitable approach for a world of infrastructures and settlements built as a sole system.
Landslide early warning systems: a perspective from the internet of things IJECEIAES
Populations located in the vicinity of slopes and soils derived from volcanic ash are constantly at risk due to the possibility of landslides. Such is the case of the city of Manizales, Colombia, which, due to its geomorphological characteristics, has experienced a significant number of landslides that have caused human and economic losses. The Internet of things (IoT) has allowed important technological advances for monitoring, thanks to the low cost and wide coverage of IoT-based systems. Slope monitoring and the development of landslide early warning systems (EWS) have been positively impacted by IoT developments, which shows a relationship. The objective of this article is to review, from the scientific production, the relationship between IoT and EWS. For this purpose, a fragmenting-deriving-combining methodology is applied to focus on a research trends analysis of the subject, from macroareas such as IoT and EWS to micro areas such as EWS by IoT-based landslides. Finally, the analysis concluded that the conceptual models of IoT and EWS for landslides have some correspondence in some of their layers.
Information Art is a diverse range of human activities in creating visual, auditory or performing artifacts (artworks), expressing the author's imaginative, conceptual ideas, or technical skill, intended to be appreciated for their beauty or emotional power. Other activities related to the production of works of art include the criticism of art, the study of the history of art, and the aesthetic dissemination[clarification needed] of art.
We are now in the “Century of the City” where urbanization defines our social,economic,and environmental characteristics.
In this era of the Anthropocene, when we are altering the functioning of the global environment, the term “Astycene” accurately describes this “new urban era” where “anthropos” is an “astos,” a dweller of an urban area. The term has been derived from two Greek words:αστυ, i.e., asty= city, town and καιν, i.e., cene= new.
Hence, my topic of presentation is: “Mapping the Astycene”
Economic development in New Mexico can be achieved if we integrate the scientific and cultural tools, traditions and resources of the Rio Grande valley.
keynote at Irish HCI, Limerick, 2nd Nov 2018
http://alandix.com/academic/talks/IHCI-deep-digitality-2018/
We constantly hear about disruptive technology, but how radical is the change due to digital technology?
In the hills and mountains of the South Wales coal valleys, rivers radiate out and then south toward the sea. This seems reasonable until you learn that the geology beneath is a syncline a basin-shaped structure of rock strata. The current rivers form a superimposed drainage pattern, the routes the rivers ran before the geology changed. As the ground rose and sank below, the rivers maintained their old courses, a relic of a one hundred million year past.
In reality digital technology is often like this, largely reinforcing the existing structures of power and organisation in government, commerce and health. The digital geology is changing beneath our feet and yet digital technology cuts the same paths.
Can we reimagine industry and civic society if digital technology had come first, before the industrial revolution and maybe even before the rise of the mercantile class?
Art is Open Source at Visualize: materials and links
Some links and resources explored at the Visualize talk and workshop in Lecce, Italy, June 2014
more info here:
http://www.artisopensource.net/network/artisopensource/2014/04/17/micro-histories-of-cities-and-ubiquitous-commons-at-visualize-in-lecce/
Pablo Suarez - Become a Disaster Manager: Red Cross VR Explorations for Flood...SeriousGamesAssoc
Pablo Suarez, Red Cross/Red Crescent Climate Change Center
This presentation was given at the 2017 Serious Play Conference, hosted by the George Mason University - Virginia Serious Play Institute.
Can you help save lives and money by taking action before a disaster hits? A new virtual reality (VR) game created by the Red Cross/Red Crescent Climate Centre puts users in the shoes of decision makers, letting them decide whether or not to ring an alarm bell, stamp papers for aid delivery, and load supplies into a relief truck – all from a virtual hill overlooking the green valley and the surging waters of the dam.
Ubiquitous Commons workshop at transmediale 2015, Capture AllSalvatore Iaconesi
Here are the slides from the workshop, with a framing of the concept of Ubiquitous Commons, a series of examples and links, and an update about how the development of the toolkits (legal, technological, philosophical, aesthetic) are going, together with some source code and prototypes.
More info can also be gathered here:
human-ecosystems.com/home/ubiquitous-commons-the-slides-from-the-workshop-at-transmediale-festival-in-berlin
Similar to A presentation of the ARCHIVES Project to the ISCRAM-MED Conference (20)
Earliest Galaxies in the JADES Origins Field: Luminosity Function and Cosmic ...Sérgio Sacani
We characterize the earliest galaxy population in the JADES Origins Field (JOF), the deepest
imaging field observed with JWST. We make use of the ancillary Hubble optical images (5 filters
spanning 0.4−0.9µm) and novel JWST images with 14 filters spanning 0.8−5µm, including 7 mediumband filters, and reaching total exposure times of up to 46 hours per filter. We combine all our data
at > 2.3µm to construct an ultradeep image, reaching as deep as ≈ 31.4 AB mag in the stack and
30.3-31.0 AB mag (5σ, r = 0.1” circular aperture) in individual filters. We measure photometric
redshifts and use robust selection criteria to identify a sample of eight galaxy candidates at redshifts
z = 11.5 − 15. These objects show compact half-light radii of R1/2 ∼ 50 − 200pc, stellar masses of
M⋆ ∼ 107−108M⊙, and star-formation rates of SFR ∼ 0.1−1 M⊙ yr−1
. Our search finds no candidates
at 15 < z < 20, placing upper limits at these redshifts. We develop a forward modeling approach to
infer the properties of the evolving luminosity function without binning in redshift or luminosity that
marginalizes over the photometric redshift uncertainty of our candidate galaxies and incorporates the
impact of non-detections. We find a z = 12 luminosity function in good agreement with prior results,
and that the luminosity function normalization and UV luminosity density decline by a factor of ∼ 2.5
from z = 12 to z = 14. We discuss the possible implications of our results in the context of theoretical
models for evolution of the dark matter halo mass function.
Introduction:
RNA interference (RNAi) or Post-Transcriptional Gene Silencing (PTGS) is an important biological process for modulating eukaryotic gene expression.
It is highly conserved process of posttranscriptional gene silencing by which double stranded RNA (dsRNA) causes sequence-specific degradation of mRNA sequences.
dsRNA-induced gene silencing (RNAi) is reported in a wide range of eukaryotes ranging from worms, insects, mammals and plants.
This process mediates resistance to both endogenous parasitic and exogenous pathogenic nucleic acids, and regulates the expression of protein-coding genes.
What are small ncRNAs?
micro RNA (miRNA)
short interfering RNA (siRNA)
Properties of small non-coding RNA:
Involved in silencing mRNA transcripts.
Called “small” because they are usually only about 21-24 nucleotides long.
Synthesized by first cutting up longer precursor sequences (like the 61nt one that Lee discovered).
Silence an mRNA by base pairing with some sequence on the mRNA.
Discovery of siRNA?
The first small RNA:
In 1993 Rosalind Lee (Victor Ambros lab) was studying a non- coding gene in C. elegans, lin-4, that was involved in silencing of another gene, lin-14, at the appropriate time in the
development of the worm C. elegans.
Two small transcripts of lin-4 (22nt and 61nt) were found to be complementary to a sequence in the 3' UTR of lin-14.
Because lin-4 encoded no protein, she deduced that it must be these transcripts that are causing the silencing by RNA-RNA interactions.
Types of RNAi ( non coding RNA)
MiRNA
Length (23-25 nt)
Trans acting
Binds with target MRNA in mismatch
Translation inhibition
Si RNA
Length 21 nt.
Cis acting
Bind with target Mrna in perfect complementary sequence
Piwi-RNA
Length ; 25 to 36 nt.
Expressed in Germ Cells
Regulates trnasposomes activity
MECHANISM OF RNAI:
First the double-stranded RNA teams up with a protein complex named Dicer, which cuts the long RNA into short pieces.
Then another protein complex called RISC (RNA-induced silencing complex) discards one of the two RNA strands.
The RISC-docked, single-stranded RNA then pairs with the homologous mRNA and destroys it.
THE RISC COMPLEX:
RISC is large(>500kD) RNA multi- protein Binding complex which triggers MRNA degradation in response to MRNA
Unwinding of double stranded Si RNA by ATP independent Helicase
Active component of RISC is Ago proteins( ENDONUCLEASE) which cleave target MRNA.
DICER: endonuclease (RNase Family III)
Argonaute: Central Component of the RNA-Induced Silencing Complex (RISC)
One strand of the dsRNA produced by Dicer is retained in the RISC complex in association with Argonaute
ARGONAUTE PROTEIN :
1.PAZ(PIWI/Argonaute/ Zwille)- Recognition of target MRNA
2.PIWI (p-element induced wimpy Testis)- breaks Phosphodiester bond of mRNA.)RNAse H activity.
MiRNA:
The Double-stranded RNAs are naturally produced in eukaryotic cells during development, and they have a key role in regulating gene expression .
Cancer cell metabolism: special Reference to Lactate PathwayAADYARAJPANDEY1
Normal Cell Metabolism:
Cellular respiration describes the series of steps that cells use to break down sugar and other chemicals to get the energy we need to function.
Energy is stored in the bonds of glucose and when glucose is broken down, much of that energy is released.
Cell utilize energy in the form of ATP.
The first step of respiration is called glycolysis. In a series of steps, glycolysis breaks glucose into two smaller molecules - a chemical called pyruvate. A small amount of ATP is formed during this process.
Most healthy cells continue the breakdown in a second process, called the Kreb's cycle. The Kreb's cycle allows cells to “burn” the pyruvates made in glycolysis to get more ATP.
The last step in the breakdown of glucose is called oxidative phosphorylation (Ox-Phos).
It takes place in specialized cell structures called mitochondria. This process produces a large amount of ATP. Importantly, cells need oxygen to complete oxidative phosphorylation.
If a cell completes only glycolysis, only 2 molecules of ATP are made per glucose. However, if the cell completes the entire respiration process (glycolysis - Kreb's - oxidative phosphorylation), about 36 molecules of ATP are created, giving it much more energy to use.
IN CANCER CELL:
Unlike healthy cells that "burn" the entire molecule of sugar to capture a large amount of energy as ATP, cancer cells are wasteful.
Cancer cells only partially break down sugar molecules. They overuse the first step of respiration, glycolysis. They frequently do not complete the second step, oxidative phosphorylation.
This results in only 2 molecules of ATP per each glucose molecule instead of the 36 or so ATPs healthy cells gain. As a result, cancer cells need to use a lot more sugar molecules to get enough energy to survive.
introduction to WARBERG PHENOMENA:
WARBURG EFFECT Usually, cancer cells are highly glycolytic (glucose addiction) and take up more glucose than do normal cells from outside.
Otto Heinrich Warburg (; 8 October 1883 – 1 August 1970) In 1931 was awarded the Nobel Prize in Physiology for his "discovery of the nature and mode of action of the respiratory enzyme.
WARNBURG EFFECT : cancer cells under aerobic (well-oxygenated) conditions to metabolize glucose to lactate (aerobic glycolysis) is known as the Warburg effect. Warburg made the observation that tumor slices consume glucose and secrete lactate at a higher rate than normal tissues.
What is greenhouse gasses and how many gasses are there to affect the Earth.moosaasad1975
What are greenhouse gasses how they affect the earth and its environment what is the future of the environment and earth how the weather and the climate effects.
Seminar of U.V. Spectroscopy by SAMIR PANDASAMIR PANDA
Spectroscopy is a branch of science dealing the study of interaction of electromagnetic radiation with matter.
Ultraviolet-visible spectroscopy refers to absorption spectroscopy or reflect spectroscopy in the UV-VIS spectral region.
Ultraviolet-visible spectroscopy is an analytical method that can measure the amount of light received by the analyte.
This presentation explores a brief idea about the structural and functional attributes of nucleotides, the structure and function of genetic materials along with the impact of UV rays and pH upon them.
This pdf is about the Schizophrenia.
For more details visit on YouTube; @SELF-EXPLANATORY;
https://www.youtube.com/channel/UCAiarMZDNhe1A3Rnpr_WkzA/videos
Thanks...!
Multi-source connectivity as the driver of solar wind variability in the heli...Sérgio Sacani
The ambient solar wind that flls the heliosphere originates from multiple
sources in the solar corona and is highly structured. It is often described
as high-speed, relatively homogeneous, plasma streams from coronal
holes and slow-speed, highly variable, streams whose source regions are
under debate. A key goal of ESA/NASA’s Solar Orbiter mission is to identify
solar wind sources and understand what drives the complexity seen in the
heliosphere. By combining magnetic feld modelling and spectroscopic
techniques with high-resolution observations and measurements, we show
that the solar wind variability detected in situ by Solar Orbiter in March
2022 is driven by spatio-temporal changes in the magnetic connectivity to
multiple sources in the solar atmosphere. The magnetic feld footpoints
connected to the spacecraft moved from the boundaries of a coronal hole
to one active region (12961) and then across to another region (12957). This
is refected in the in situ measurements, which show the transition from fast
to highly Alfvénic then to slow solar wind that is disrupted by the arrival of
a coronal mass ejection. Our results describe solar wind variability at 0.5 au
but are applicable to near-Earth observatories.
Multi-source connectivity as the driver of solar wind variability in the heli...
A presentation of the ARCHIVES Project to the ISCRAM-MED Conference
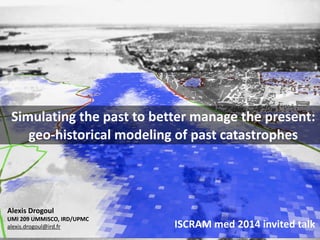
1. Archives
Geo-
historical
modeling of
1
Alexis
Drogoul
UMI
209
UMMISCO,
IRD/UPMC
alexis.drogoul@ird.fr
Simulating
the
past
to
better
manage
the
present:
geo-‐historical
modeling
of
past
catastrophes
ISCRAM
med
2014
invited
talk
2. Vietnam
is
a
country
structured
by
water:
the
Red
River
delta
in
the
North
and
the
Mekong
River
delta
in
the
South
2
!"#$%& !'()*'+(,-'+.%")'(*)%/-*%#'0,*-'1)'(+.%$+'+2)1)'(
345,'6,'27%-/%(8)%*+9,6%+77)771)'(
!"#$%&$'()*$+",$- ./0/1"*(2/$32/)4$25$2/)$,)*6)$4)"$7)8)7$6(4)
4. Flooding
in
Hanoi
is
menPoned
since
1000
years
(in
the
imperial
chronicles),
then
in
the
French
colonial
archives
from
1890
to
1954,
and
since
then
in
official
reports.
On
average,
1
major
flood
every
3
years.
4
2008 2014
2013
Recent
ones
are
mainly
caused
by
heavy
rain
episodes.
5. The
policy
against
flooding
has
been
constant
over
Pme:
building
dykes
systems
(~4000
km)
5
1927
2013
1905
6. «
Hanoi
ciPzen
and
city
planners
regularly
forget
they
live
near
a
river…
»
6
Flood
zone RiverDyke
West
Hanoi
7. The
analysis
and
transmission
of
past
disasters
is
an
integral
part
of
disaster
management
7
Prevention!
•Land use planning !
•Learning from events!
•Technical measures
The
experience
of
past
disasters
allows
local
knowledge
to
be
used
to
develop
community
responses
that
both
help
to
raise
awareness
of
risks
and
also
help
prepare
for
improved
future
disaster
response
and
reconstruc<on
Inspired by Integral Risk Management Cycle, FOCP 2012
8. Issue
1:
The
availability
and
accessibility
of
the
data
concerning
this
event
Issue
2:
The
construc<on
of
relevant
informa<on
from
these
data
Issue
3:
The
reconstruc<on
of
a
coherent
«story»
from
these
informa<on
!
This
is
what
historians
do,
but
it
would
be
helpful
to
be
able
to
do
it
in
a
more
systema8c
way
as
this
concerns
hundreds
of
thousands
of
events.
8
However,
being
able
to
learn
from
a
past
event
requires
addressing
some
issues
9. In
the
last
10
years,
informa8on
technology
has
become
ubiquitous
in
disaster
risk
management
and
there
are
hundreds
of
solu8ons
developed
!
!
!
!
!
!
!
!
!
!
!
!
But
they
require
the
availability
of
large
datasets
of
digital
informa8on
about
each
event
9
For
predic<ng
risks
For
assessing
risks
For
mi<ga<ng
risks
For
launching
alerts
For
educa<ng
people
For
organizing
rescue
....
!
10. Digital
informa8on
is
the
data
stored
in
computers,
which
can
be
automa8cally
harvested
and
analyzed
to
produce
useful
knowledge
about
a
disaster
10
From
real-‐<me
monitoring... ...
to
post-‐assessment
11. In
the
last
10
years,
as
soon
as
a
disaster
occurs,
rich
digital
informa8on
is
produced,
disseminated,
and
immediately
analyzed
11
Immediately
aGer
Fukushima,
572.000
new
TwiHer
accounts
have
been
created
in
Japan
12. today1900 20001800170016001000500 1500
However,
the
quan8ty
of
digital
informa8on
about
past
risk
events
is
strongly
dependent
on
when
in
history
they
have
happened
12
Past Future
Digi8za8on
of
physical
documents
Produc8on
of
digital
documents
cf.
F.
Kaplan,
2013,
hIp://Laplan.wordpress.com/2013/03/14/lancement-‐de-‐la-‐venice-‐8me-‐machine/
13. today1900 20001800170016001000500 1500
A
first
step
can
be
to
make
more
informa8on
available
through
the
exploita8on
and
automated
analysis
of
available
digi8zed
contents
13
Past Future
Ins8tu8onal
analysis
(Web)mapping
Social
network
analysis
Social
network
analysis
Digi8za8on
of
physical
documents
Produc8on
of
digital
documents
Analysis
of
digital
informa8on
14. But
how
to
benefit,
for
past
events,
from
the
abundance
of
the
informa8on
on
contemporary
catastrophic
events
?
How
can
we
reproduce
the
dynamics
of
the
event
itself
so
as
to
beHer
understand
its
impacts
?
!
How
can
we
have
a
closer
look
at
the
social
dynamics
of
the
management
of
the
event
?
!
How
can
we
follow
the
behaviors
of
the
mul<ple
actors
of
an
event
in
order
to
understand
their
rela<onships
?
!
How
can
we
recreate
the
equivalent
of
Facebook,
Google
Maps,
YouTube,
TwiIer
for
past
events
?
(F.
Kaplan,
2013)
!
!
14
15. Geo-‐historical
modeling
is
one
way
to
extrapolate
the
informa8on
available
in
order
to
«
tell
stories
»
and
produce
new
digital
informa8on
through
simula8ons
15
Past Future
Digi8za8on
of
physical
documents
Produc8on
of
digital
documents
Analysis
of
digital
informa8on
Simula8on
of
digital
models
3D reconstruction
Rialto neighborhood
in 1500 ab. based
on the documents
of Venetian archives
The diversity, amount and accuracy of the Venetian administrative documents are unique in Western history. By com-
bining this mass of information, it is possible to reconstruct large segments of the city’s past: complete biographies,
political dynamics, or even the appearance of buildings and entire neighborhoods. The documents are intricately
interweaved, telling a much richer story when they are cross-referenced.
Text recognition in
ncient hand-written
documents
16. Geo-‐historical
models
are
not
supposed
to
be
faithful
reproduc8ons
(i.e.
«
movies
»).
16
Rather,
they
propose
to
reconstruct
fic8onal
reali8es,
suppor<ng
the
explora<on
of
what-‐if
scenarios
(e.g.,
«
what
if
such
interven0on
op0on
had
been
chosen…
?
»,
«what
effect
this
decision
could
have
had
on
…
?»)
and
a
quasi-‐experimental
approach
to
«
historical
truth
»
17. Research
works
on
geo-‐historical
models
belong
to
rather
recent
trends
in
digital
humani8es
Geo-‐historical
methodologies
Flooding
risks
in
Lyon
city,
C.
Combe,
J-‐P.
Bravard
(Univ.
Lyon
2)
Simulation
of
Historical
Tsunamis
(Japan,
Taiwan,
US)
Virtual
archaeology
(Univ.
Of
Sussex),
«
Anasazi
Culture
»
(SFI),
etc.
!
Digital
History
«Venice
Time
Machine»
(EPFL)
!
!
Very
few
references,
however,
to
the
modeling
of
past
catastrophes
in
their
social/management
dimensions.
17
121
Fig. 27. L’inondation du Rhône en 1840.
18. The
ARCHIVES
project,
a
mul8disciplinary
approach
to
the
construc8on
of
geo-‐historical
models
of
catastrophic
events
from
archived
data
International
Center
for
Advanced
Research
on
Global
Change,
VNU
(Geomorphology,
Hydrology)
IDEES,
Univ.
Rouen
(GIS,
hydrological
model,
Patrick
Taillandier)
Vietnam
National
Satellite
Center
(Red
River
basin,
Nguyen
Thi
Hoang
Anh)
!
National
Archives
Center
n°1
(Documents
and
data)
Ecole
Française
d’Extrême-‐Orient
(History,
Olivier
Tessier)
IOIT,
VAST
(Digitizing,
Luong
Chi
Mai)
L3I,
Univ.
la
Rochelle
(Document
recognition,
Muriel
Visani)
!
IRIT,
Université
de
Toulouse
(Social
model,
Benoît
Gaudou)
IT
Dept,
University
of
Science
and
Technology
of
Hanoi
(GIS
building,
Nasser
Gasmi)
UMMISCO,
IRD
(Models
coupling,
Alexis
Drogoul)
18
19. ARCHIVES
is
organized
in
three
main
ac8vi8es,
with
two
outcomes
iden8fied
19
Chronology
and
scenarios
Stakeholders
GIS,
«
physical
»
models
Digitizing
&
analysis
of
documents
Reconstruction
of
geographical/
geophysical/hydrological
information
Geo-‐referenced
index
Geo-‐historical
simulations
Geo-‐historical
model
20. The
first
proof
of
concept
focused
on
the
floods
of
July
1926
in
Hanoi
and
its
management
by
French
and
Vietnamese
authori8es
20
21. Delimita8on
of
the
case
study:
from
the
25th
to
the
31st
of
July,
1926,
in
Gia
Lâm
21
Breach at Gia Quất
28th, evening (old dyke)
29th, at 9 AM (new dyke)
Dykes
Breaches
Breach at Ái Mộ
29th, at 4 PM
Hà Nội -
downtown
Breach at Lâm Du
29th, between 4 PM and 5PM
Study area:
!
Gia Lâm (eastern
district of Hanoi).
!
Chronology:
!
- 25th to 30th of July:
increase of water height
(~12m) and main dyke
breaches
!
- 31st of July to
November: plugging of
dykes
22. First
task
was
to
gather,
digi8ze,
analyze
(and
some8mes
complement)
the
data
available
French
colonial
civil
archives
(NAC1
&
EFEO,
Hanoi)
French
military
archives
(Aix-‐en-‐
Provence)
Vietnamese
newspapers
(NAC1,
Hanoi)
Archives
of
technical
services
(water
management,
agriculture,
…)
(NAC1,
Hanoi)
City
Maps
(IGN,
France
&
NAC1,
Hanoi)
Vietnamese
imperial
archives
(NAC1
&
EFEO,
Hanoi)
Morphology
of
the
Red
River
bed
(VNSC,
Hanoi)
!
!
!
22
23. 6"
Contour lines
(brown)!
Buildings(red)! Red River (blue)!
Lakes (blue)!
The
second
task
consisted
in
linking
these
heterogenous
data
pieces
in
a
geo-‐referenced,
8me-‐indexed
database
23
24. This
allowed
to
produce
a
reasonably
realis8c
GIS
of
the
hydrographic/
urban/geomorphologic
condi8ons
in
which
the
flooding
event
took
place
24
6"
Contour lines
(brown)!
Buildings(red)! Red River (blue)!
Lakes (blue)!
The
addi<on
of
temporal
informa<on
allowed
to
query
and
navigate
the
database
and
get
an
idea,
locally,
about
the
«
<meline
»
of
the
event.
25. The
third
task
was
to
build
a
hydrological
model,
able
to
replicate
the
dynamics
of
the
Red
River
during
this
period
! GIS
Data
available
" Digital
Eleva<on
Model
(DEM)
" Shapefile
of
the
dykes
" Shapefile
of
the
buildings
" Shapefile
of
the
Red
river
" Shapefile
of
the
lakes
25
26. The
GAMA
plaiorm
was
used
to
implement
the
models
because
of
its
facili8es
for
handling
spa8al
data,
coupling
heterogeneous
models
and
ease
of
use
for
non-‐computer
scien8sts
26
http://gama-platform.org
draw shape color: color depth:depth;
}
}
species red_river{
rgb color;
aspect geometry{
draw shape color:color;
}
}
species lakes {
rgb color;
int depth;
aspect geometry {
draw shape color: color;
}
}
species dyke parent: obstacle{
bool was_broken;
string break_date_str;
int month_break;
int day_break;
bool has_to_die;
bool is_flooded -> {cells_concerned first_with(each.water_height > 0) != nil};
bool is_about_to_be_flooded -> {water_pressure > threshold_to_be_flooded};
string commune_name;
float small_dyke_height <- 0.0;
int nb_step_flooded <- 0;
reflex breaking when: destruction_of_dykes and day = day_break and month = month_break {
do break;
}
action break{
ask cells_concerned {
do update_after_destruction(myself);
}
ask(commune where (each.name = commune_name)){
remove myself from: self.commune_dykes;
}
do die;
}
action compute_height
{
height <- dyke_height - min(cells_concerned collect (each.altitude));
}
user_command "Destroy dyke" action: break;
action split_dykes (float threshold) {
list<geometry> lines1 <- shape.geometries;
if (length(lines1) > 1) {
loop i from: 0 to: (length(lines1) - 2) {
geometry li <- lines1[i];
create dyke {
shape <- li ;
commune_name <- myself.commune_name;
do split_dykes(threshold);
}
}
shape <- last(lines1) ;
do split_dykes(threshold);
} else {
if (shape.perimeter < (threshold * 2) ) {
shape <- shape + 10.0;
do update_cells;
} else {
list<point> points <- list(shape points_on threshold);
list<geometry> lines <- [];
remove last(points) from: points;
geometry geom <- copy(shape);
loop pt over: points {
list<geometry> gs <- list(geom split_at pt);
add gs[0] to:lines;
geom <- gs[1];
27. The
model
designed
is
a
simple
diffusion
model
on
a
regular
grid,
which
could
be
easily
calibrated
using
historical
data,
and
could
easily
adapt
to
changes
in
its
«
environment
»
27
altitude
water height
height
height of the
highest dykes/
buildings located
on the cell
28. This
model
proved,
once
correctly
calibrated,
to
be
quite
accurate
(with
respect
to
the
occurrence
of
some
events,
like
the
breaking
of
dykes)
28
29. The
fourth
task
in
ARCHIVES
consisted
in
building
a
model
of
the
«
management
»
and
social
response
to
the
event
The
data
available
consisted
in:
!
-‐
the
descrip<on
of
the
official
administra<ve
and
military
hierarchies
(Vietnamese
and
French
ones)
-‐
the
iden<fica<on
of
the
key
actors
and
their
role
in
the
event
(through
reports
and
inves<ga<ons
led
aGer
the
event),
-‐
the
flow
of
their
communica<ons
(leHers,
telegrams)
-‐
and
various
other
pieces
of
informa<on
from
newspapers,
tes<monies
and
memories.
29
30. The
analysis
and
linking
of
the
documents
allowed
to
reconstruct
the
structure
of
the
command
chain
and
communica8on
flows
30
31. From
this
descrip8on,
a
«
social
model
»
of
the
actors
was
built,
focusing
on
understanding
how
the
flows
of
orders/informa8on
resulted
in
concrete
ac8ons
(building
of
small,
temporary
dykes)
31
32. A
number
of
simplifica8ons
were
necessary,
so
that
the
model
could
be
calibrated
and
easily
coupled
with
the
hydrological
model
(through
the
«
dyke
»
agents)
32
!
We
considered
for
instance
only
a
top-‐down
order
and
a
bottom-‐up
information/
request
chain,
using
FIPA-‐ACL
to
manage
the
communication
protocols
between
agents
33. ARCHIVES
was
then
tested
during
a
7-‐days
workshop
held
in
Da
Lat
(Vietnam)
in
July
2013
with
geographers
and
social
scien8sts
33
Par<cipants,
once
trained
on
the
basic
model,
were
encouraged
to
adopt
an
approach
based
on
hypothe<cal
reasonings,
which
resulted
in
a
number
of
addi<ons
to
the
basic
model
and
experiments.
34. A
number
of
«
historical
experiments
»
were
conducted
by
the
par8cipants,
among
them:
34
-‐ understanding
and
modeling
the
dynamics
of
the
refugees
and
tes8ng
evacua<on
policies
-‐ understanding
the
dynamics
of
the
resources
(material
ones,
like
bamboo
s<cks,
or
human
ones,
like
coolies)
-‐ understanding
the
difference
between
the
official
descrip<on
of
the
command
chain
and
the
actual
communica<on
flows
observed
-‐ …
35. ARCHIVES,
despite
it
being
quite
complete
now,
is
s8ll
a
preliminary
proof
of
concept.
• The
whole
project
has
proved
invaluable
in
• building
a
huge
dataset
(maps,
reports,
...
)
about
this
par<cular
event
in
a
comprehensive
and
focused
way
• providing
archivists
and
historians
with
new
ways
of
«
represen<ng
»
and
«
using
»
their
documents
and
knowledge
• providing
a
support
for
understanding
the
role
of
simula<ons
in
historical
research
(esp.
regarding
the
differences
between
theore<cal
and
actual
organiza<ons)
• However,
the
main
challenge
for
generalizing
this
approach
remains
the
transforma<on
of
raw
informa<on
into
digital
informa<on
• the
automatic
generation
of
actors
and
their
behavior
from
textual
documents
(e.g.
using
process-‐mining
tools,
SNA…)
is
a
necessary
condition
to
address
different
events
35
36. The
general
perspec8ve
of
such
geo-‐historical
models
is
to
provide
stakeholders
with
a
live
historical
fic8on,
which
can
be
used
as
an
experimental
framework
36
• For
tes8ng
prepara<on
or
management
op<ons
(including
«
modern
»
ones)
• For
comparing
these
op<ons
in
terms
of
consequences
on
society
• For
suppor8ng
the
work
of
historians
in
transmibng
the
memory
of
events
• For
building
interac<ve
and
easily
accessible
living
memories
of
these
events All
of
this
adding
to
the
«
digital
informa8on
»
available
with
the
goal
of
enhancing
the
awareness
and
prepara8on
of
contemporary
stakeholders
regarding
similar
risks