Download as PDF, PPTX

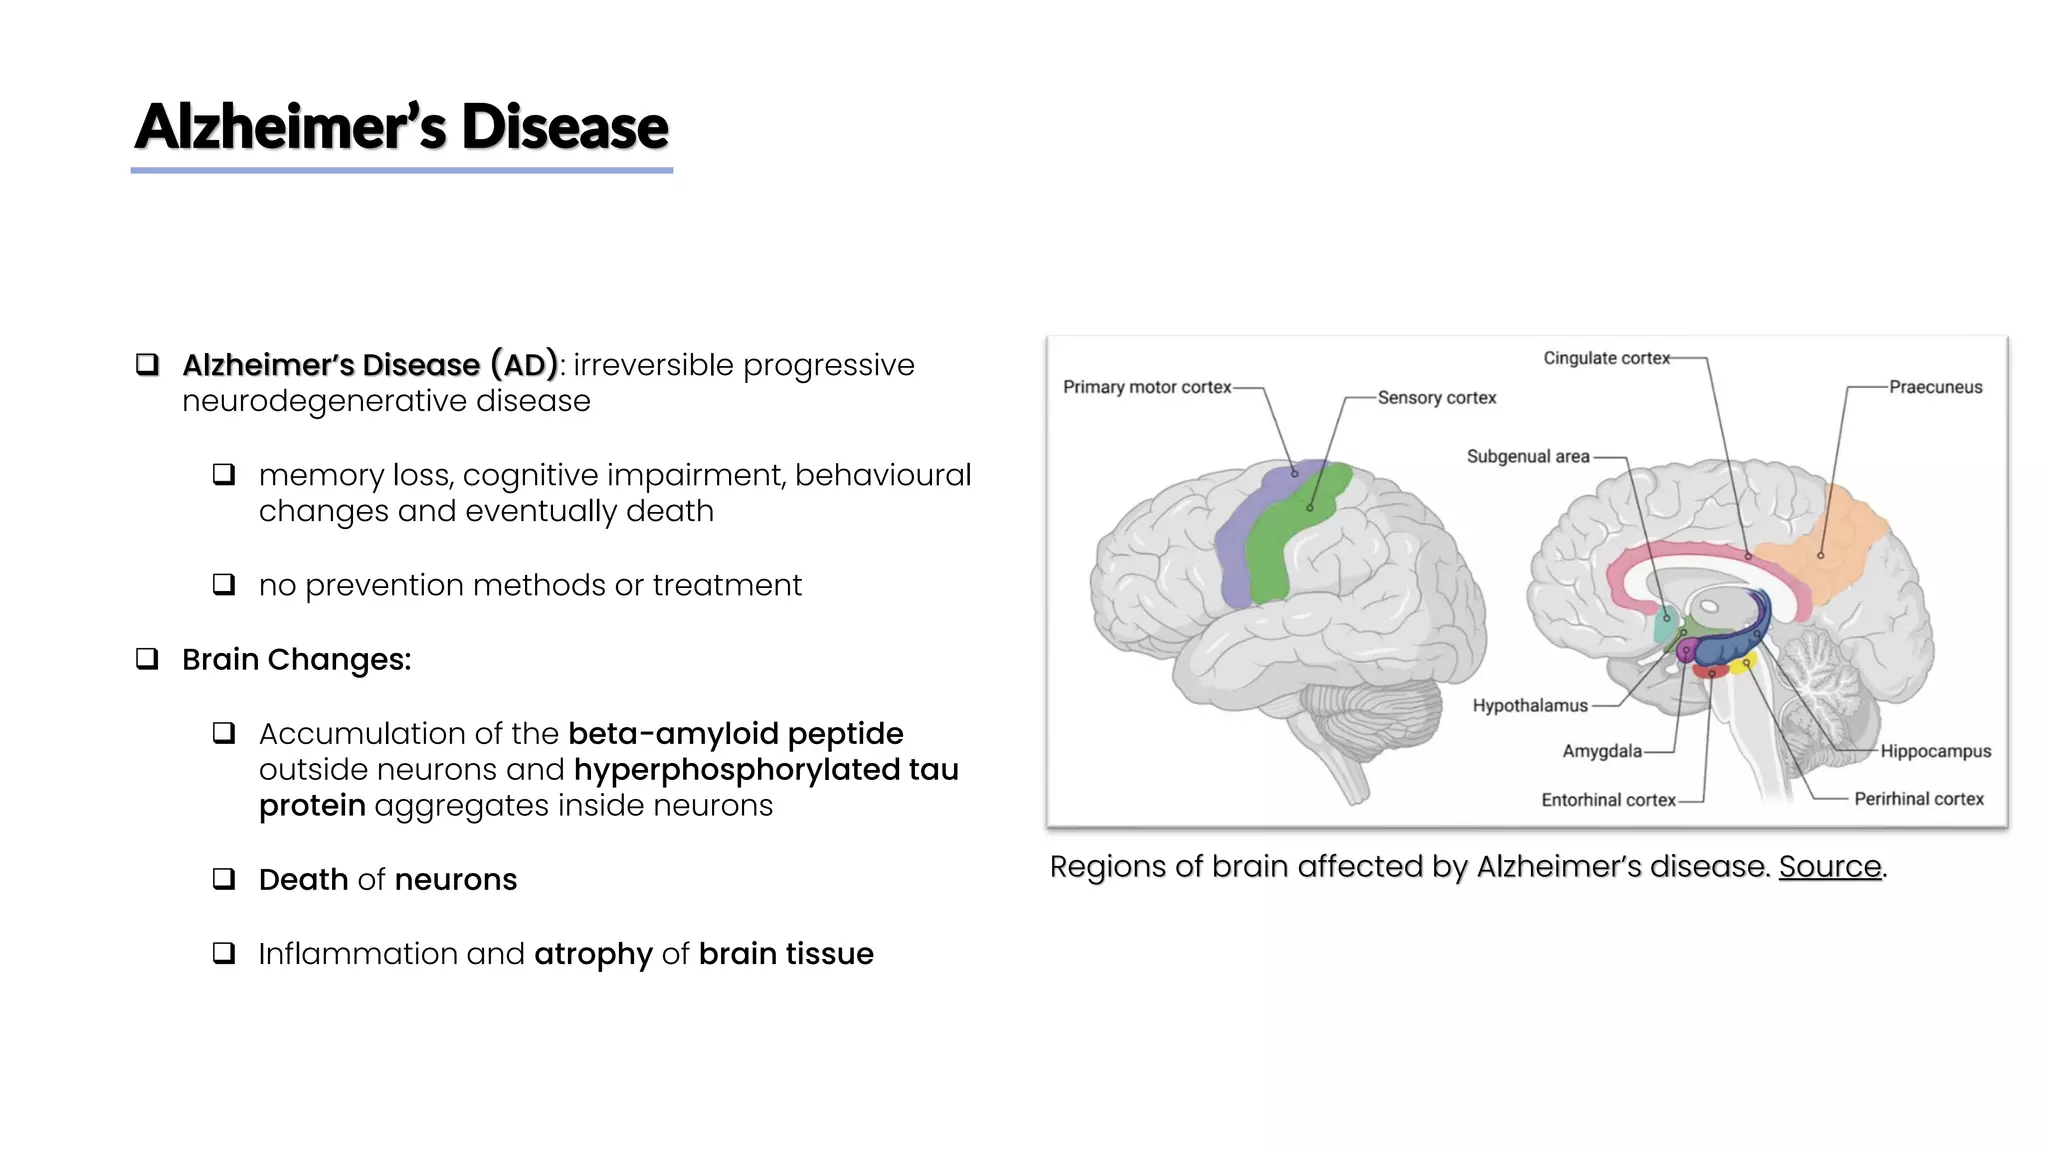


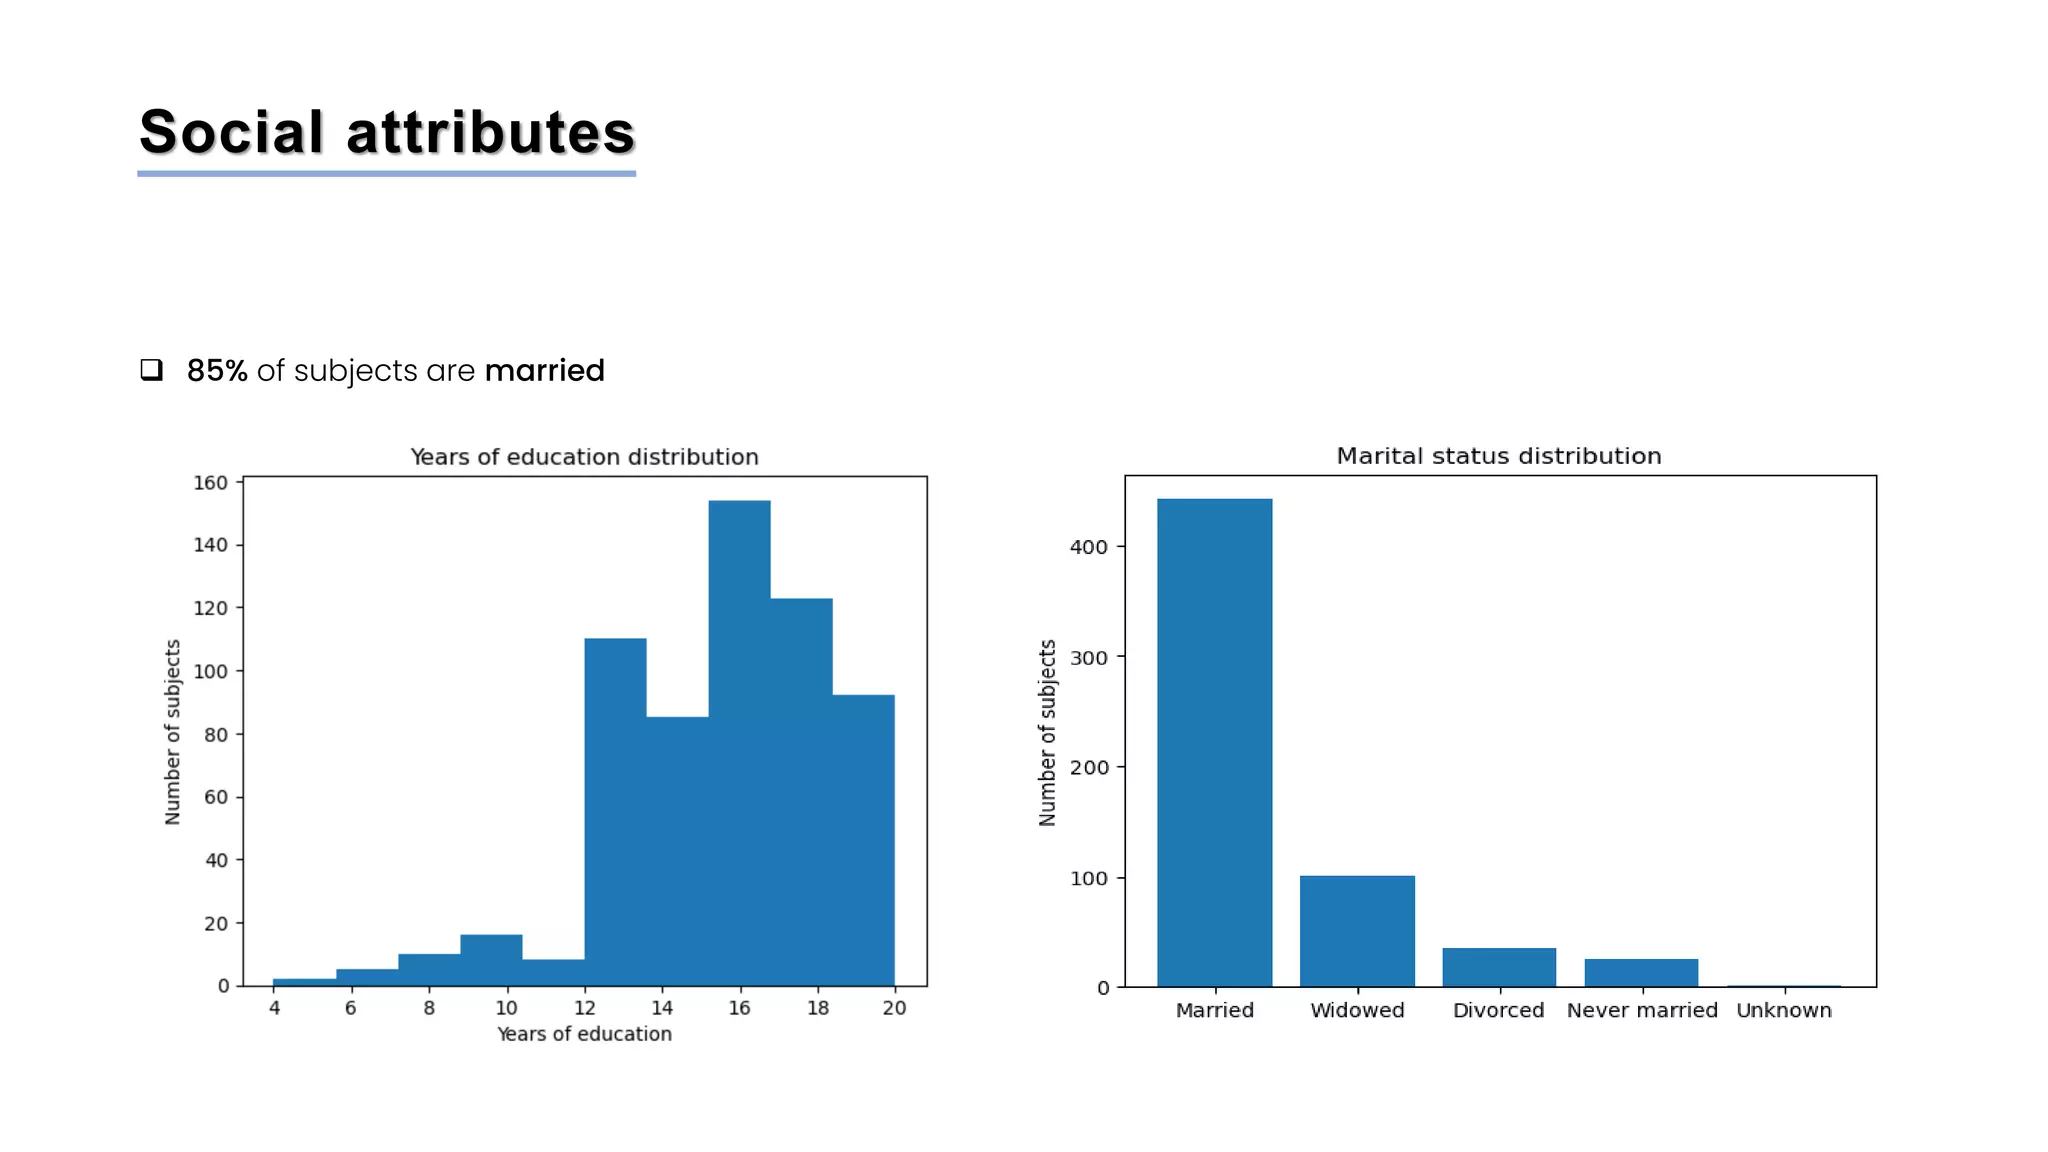
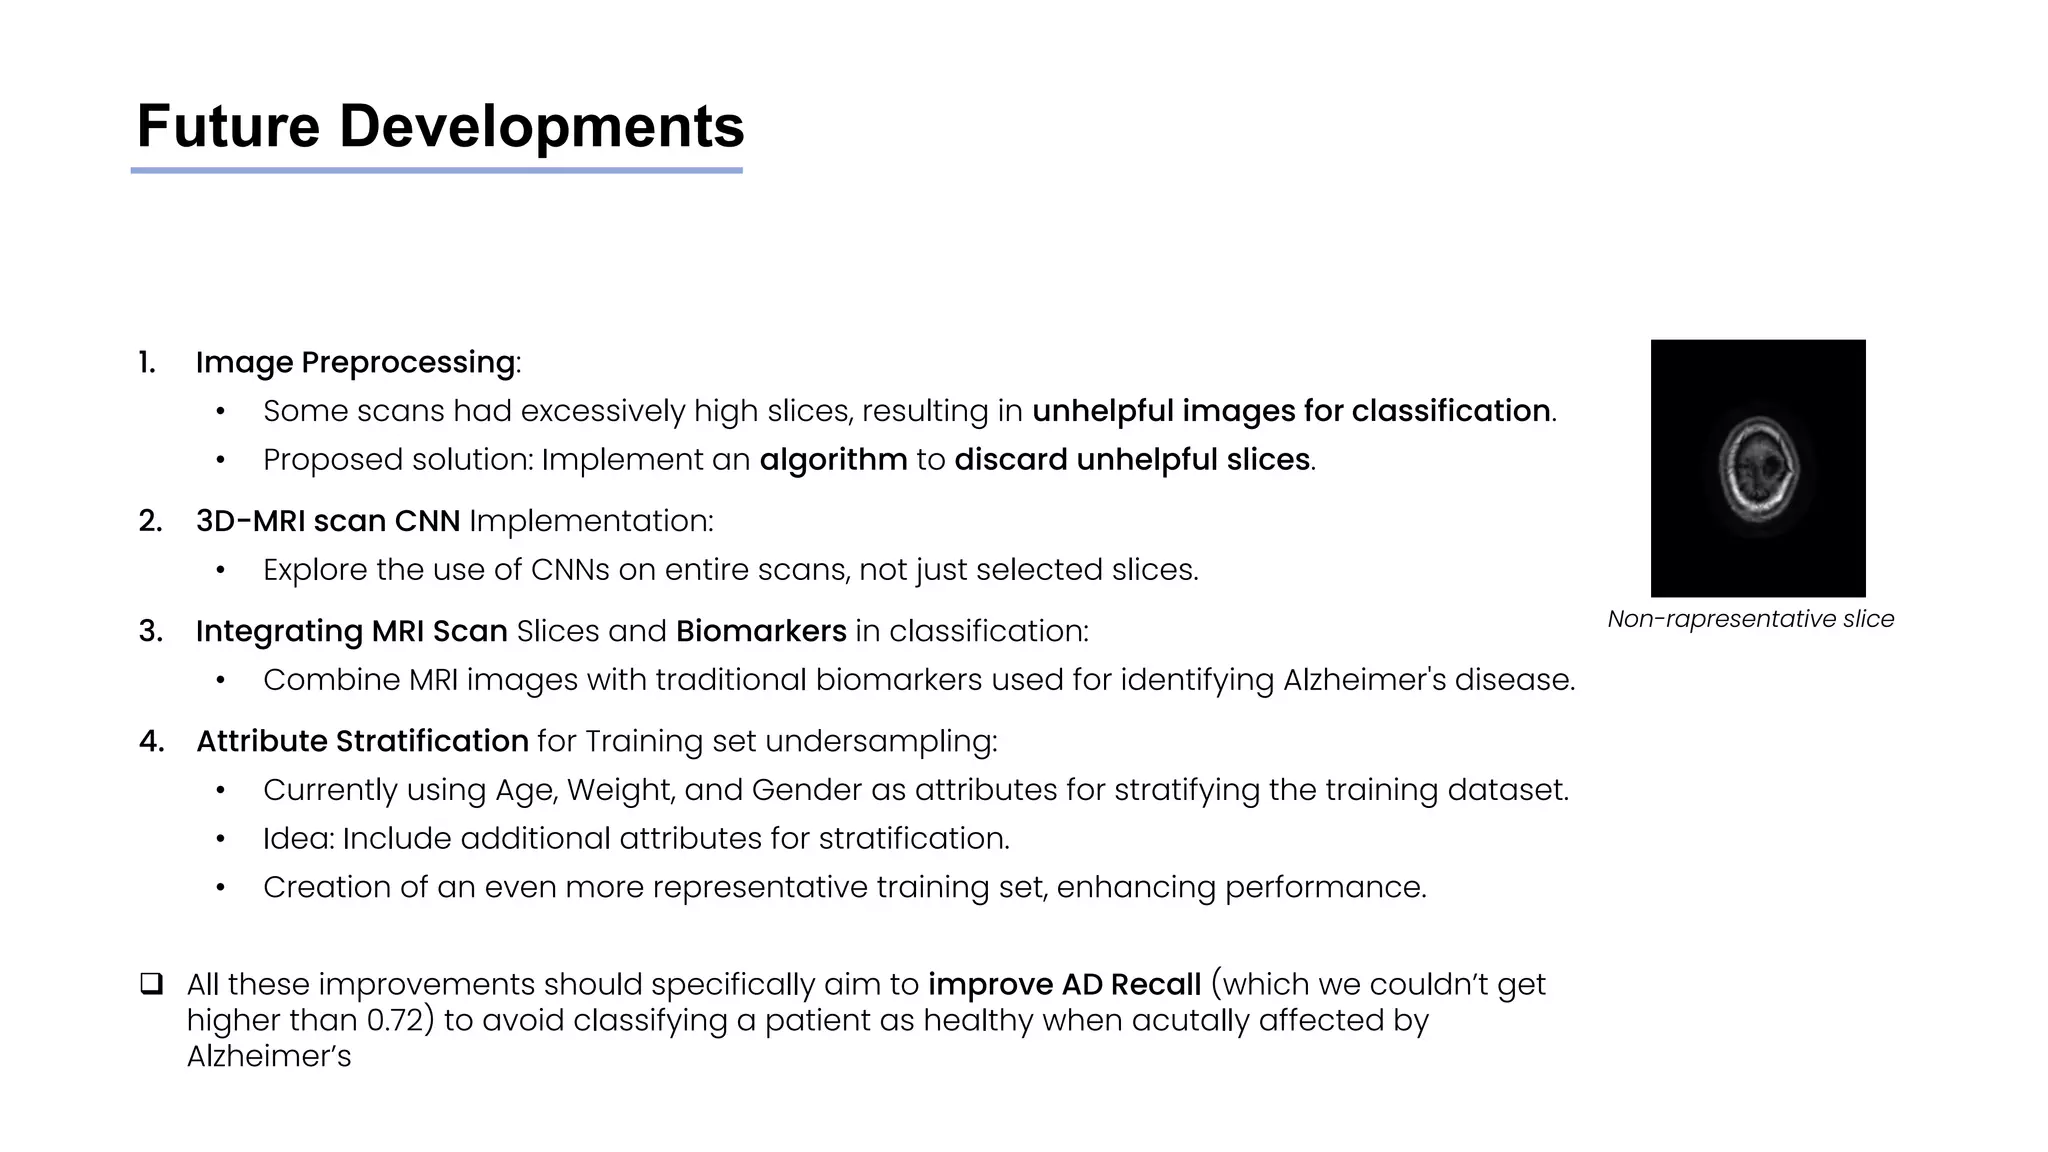
![Biochemical attributes: p-Tau 181 plasma concentration
❑ Plasma phosphorylated-tau181 (p-tau181) is
a promising biomarker for Alzheimer's
disease (AD) [8]
❑ According to some studies [8] → Higher
plasma tau should be associated with
higher CSF tau and AD dementia
❑ plasma p-Tau 181 levels (pg/mL) are
available for 70% of subjects
❑ No particular differences are found between
the distributions of p-Tau 181 plasma
concentrations in AD, MCI and NC subjects](https://image.slidesharecdn.com/datascienceinbioscences-finalprojectreport-230614150035-d72560ac/75/Identification-Of-Alzheimer-s-Disease-Using-A-Deep-Learning-Method-Based-On-T1-w-Brain-Mri-Images-24-2048.jpg)
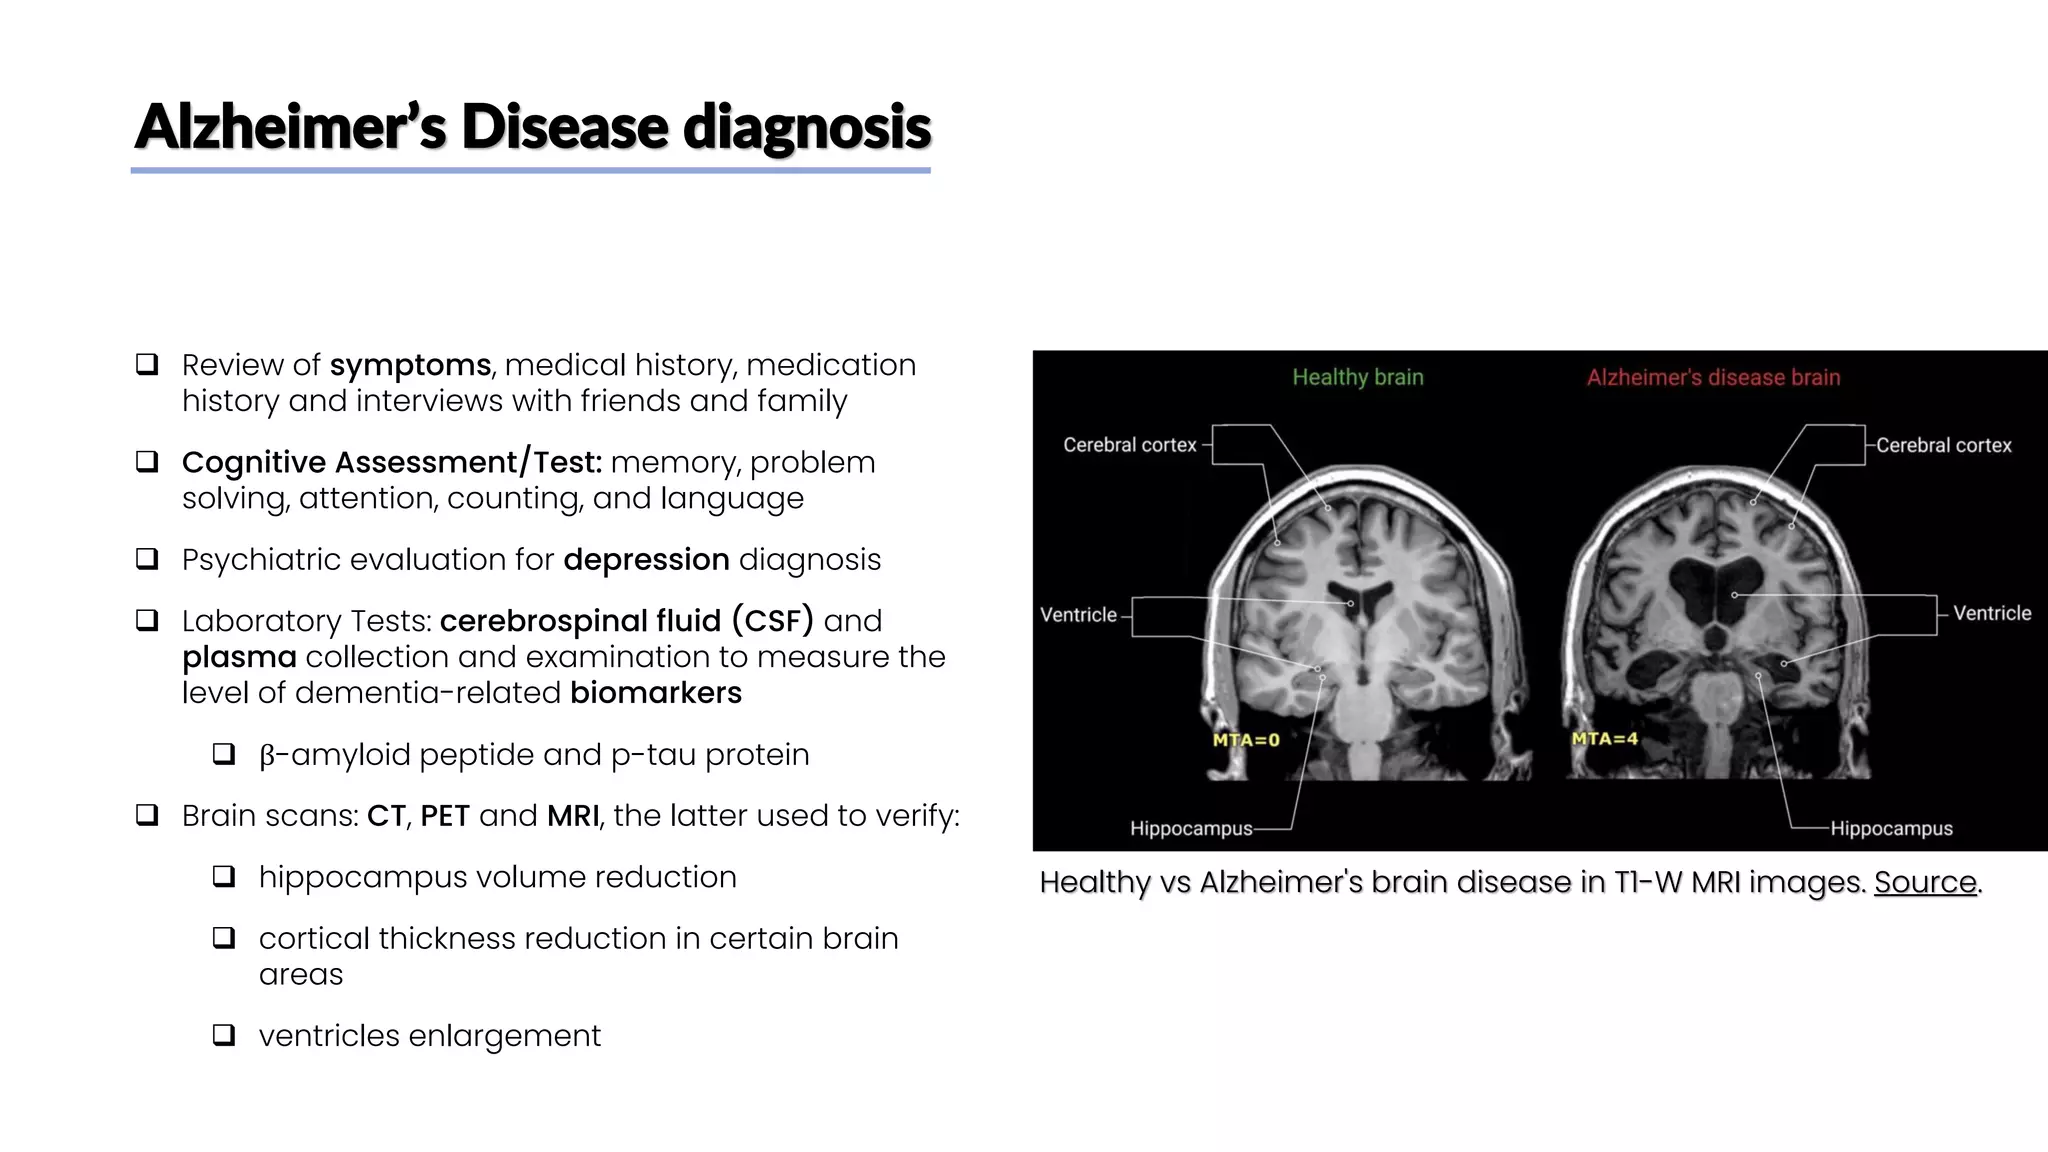
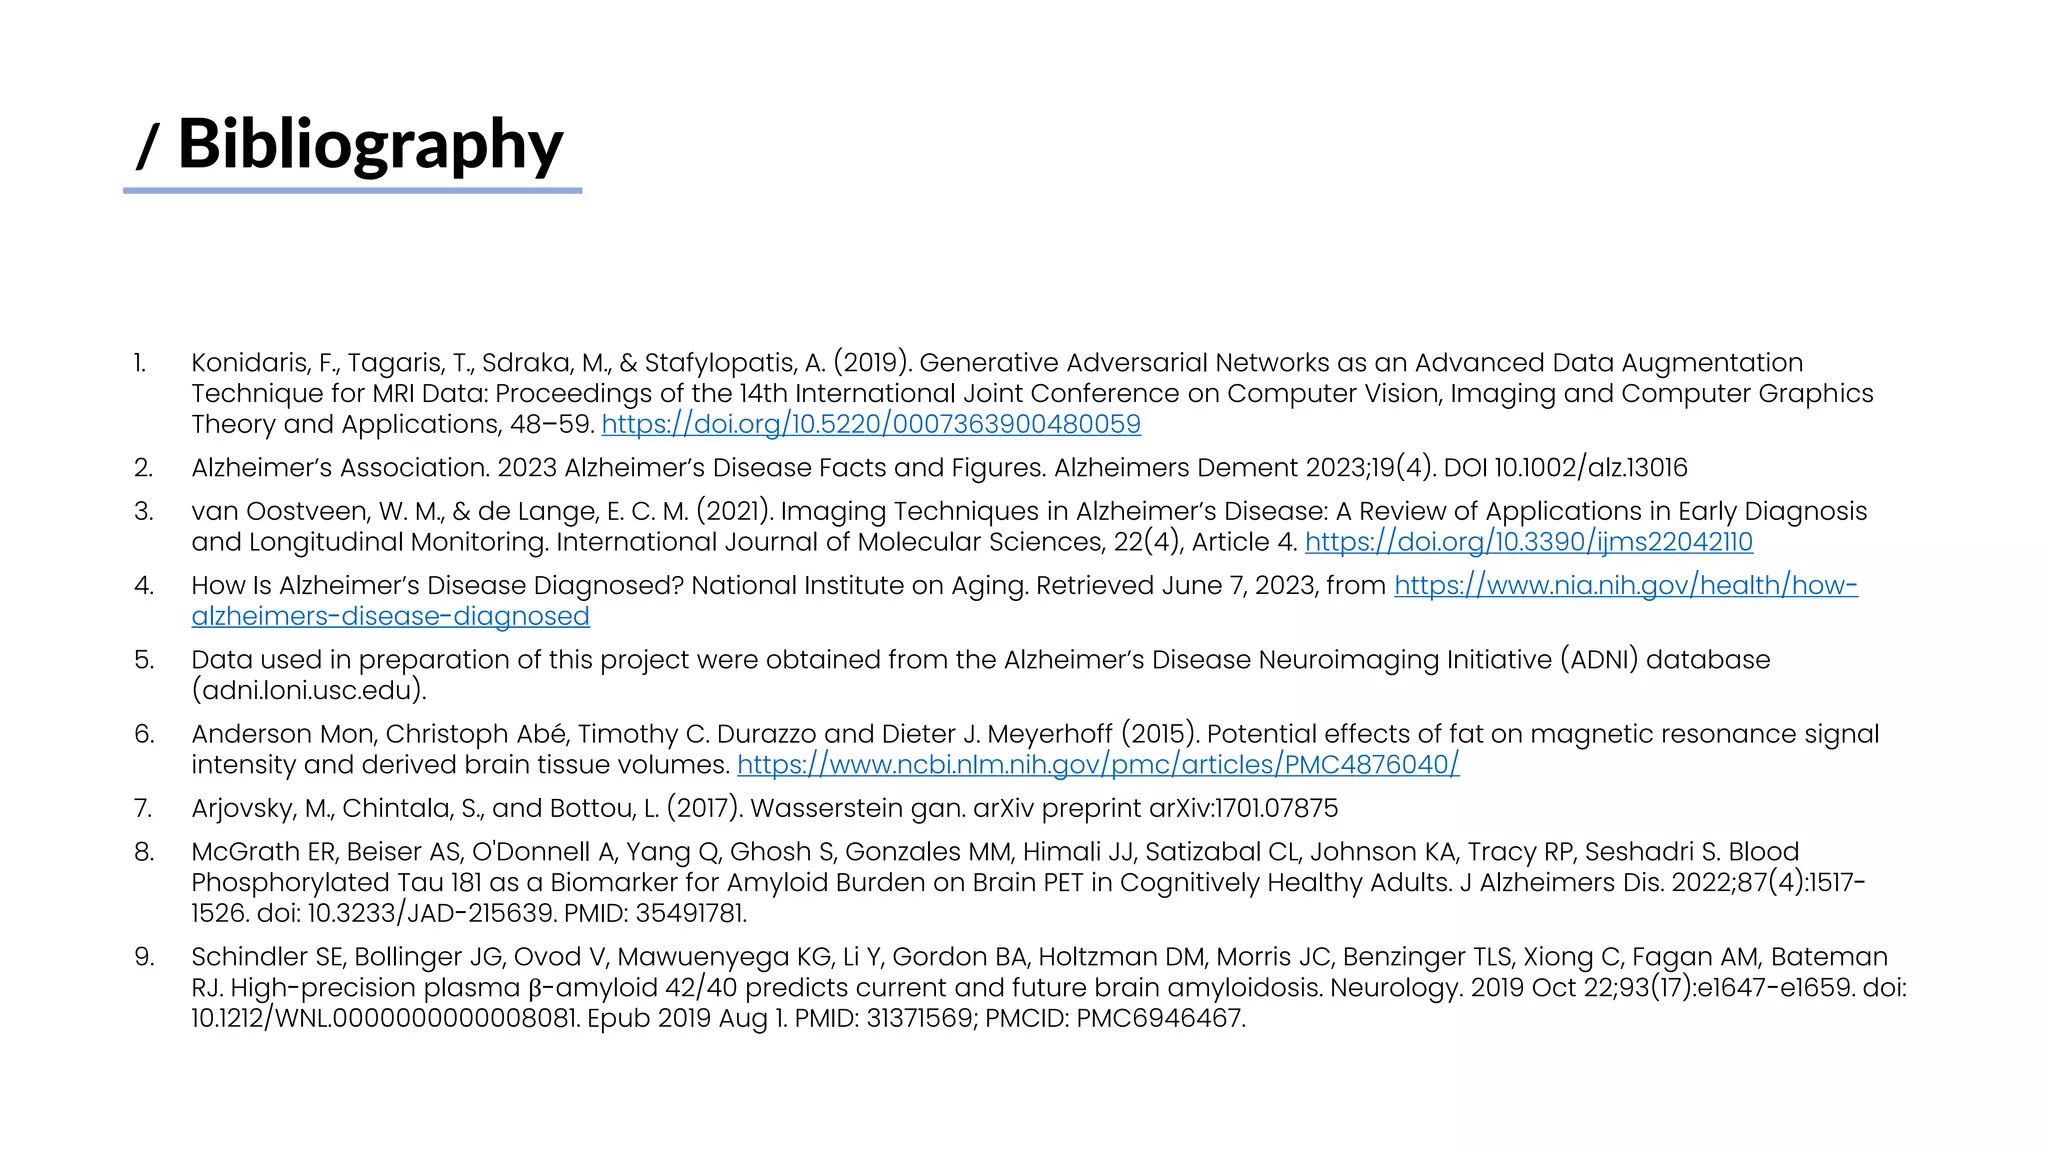
![Biochemical attributes: plasma amyloid-β 1–42/1–40
❑ A reduced amyloid-β (Aβ) 42/40 peptide
concentration ratio in blood plasma [9]
❑ represents a peripheral biomarker of the
cerebral amyloid pathology observed in
Alzheimer’s disease brains.
❑ No particular differences are found between the
distributions of amyloid-β (Aβ) 42/40 ratio in MCI
and NC subjecs
❑ But plasma amyloid-β (Aβ) 42/40 ratio are
available for only 7% of subjects (only CN and MCI
subjects)](https://image.slidesharecdn.com/datascienceinbioscences-finalprojectreport-230614150035-d72560ac/75/Identification-Of-Alzheimer-s-Disease-Using-A-Deep-Learning-Method-Based-On-T1-w-Brain-Mri-Images-25-2048.jpg)

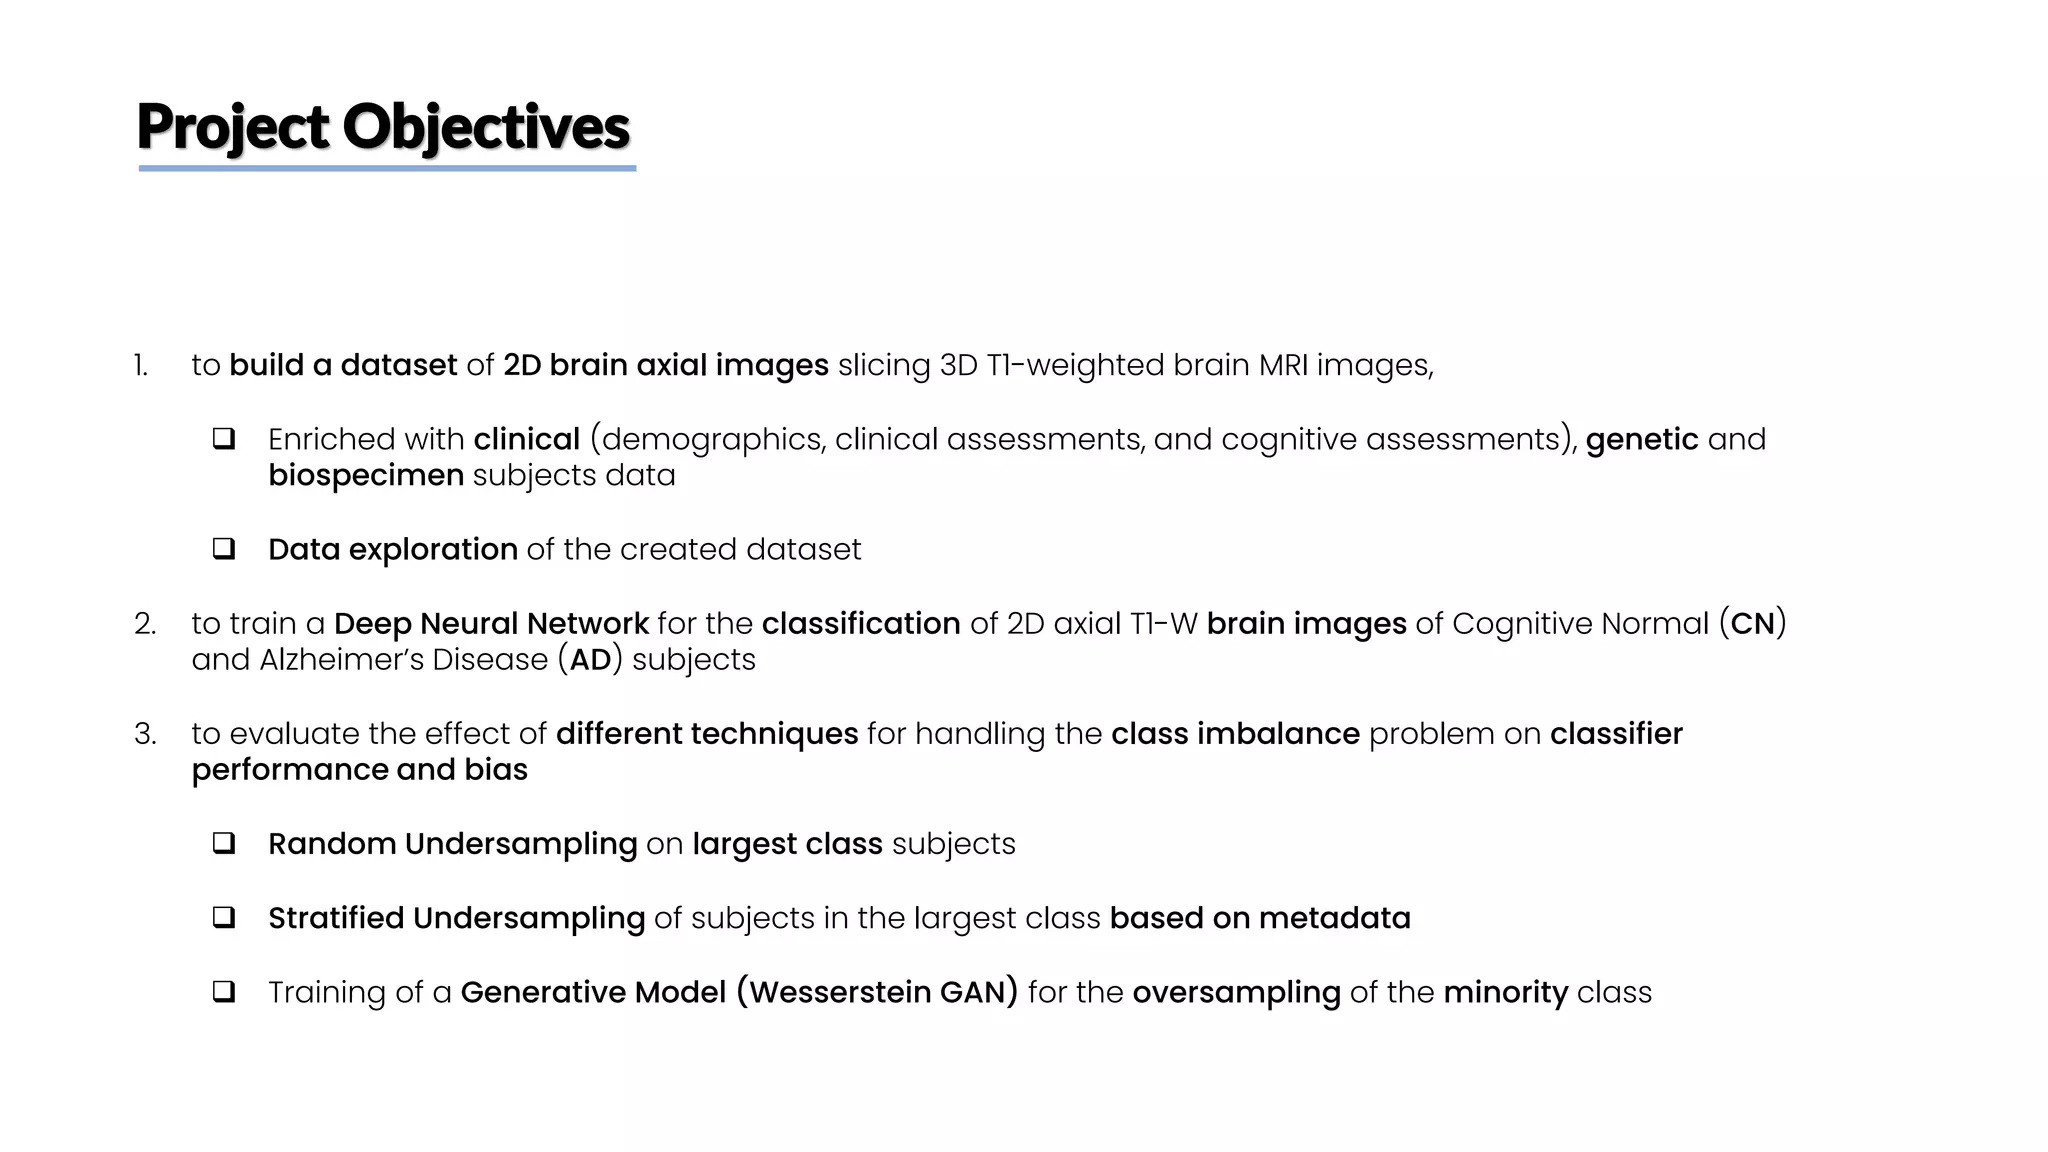
![CNN Architecture Summary
❑ 2-class classification task using a custom Resnet-18
CNN
❑ Hyperparameters that gave the best performances on
the validation set while limiting overfitting, following [1]
• Epochs: 50
• Batch size: 32
• Loss function: Binary cross entropy
• Optimizer: Adam
• Dropout rate: 0.25
MRI slice
192 x 160 x 1
Input Layer
96 x 80 x 64
48 x 40 x 64
24 x 20 x 128
192 x 160 x 1
Flatten 512
Conv2D (X filters, filter_size = 3x3, stride = Y)
Batch Normalization
LeakyReLU
Conv2D X, Y
=
Conv2D (64 kernels, kernel_size = 7x7, stride = 2)
Batch Normalization
LeakyReLU
MaxPooling (kernel_size = 3x3, stride = 2)
Conv2D 64, 1
Conv2D 64, 2
Conv2D 128, 2
Conv2D 128, 2
Conv2D 256, 2
Conv2D 256, 2
12 x 10 x 256
Conv2D 512, 2
Conv2D 512, 2
6 x 5 x 512
AvgPooling (kernel_size = 6x5) 1 x 1 x 512
FC (Softmax) 1
Custom
Layer
Params: 11,190,082
Trainable: 11,180,354
Non-trainable: 9,728](https://image.slidesharecdn.com/datascienceinbioscences-finalprojectreport-230614150035-d72560ac/75/Identification-Of-Alzheimer-s-Disease-Using-A-Deep-Learning-Method-Based-On-T1-w-Brain-Mri-Images-29-2048.jpg)
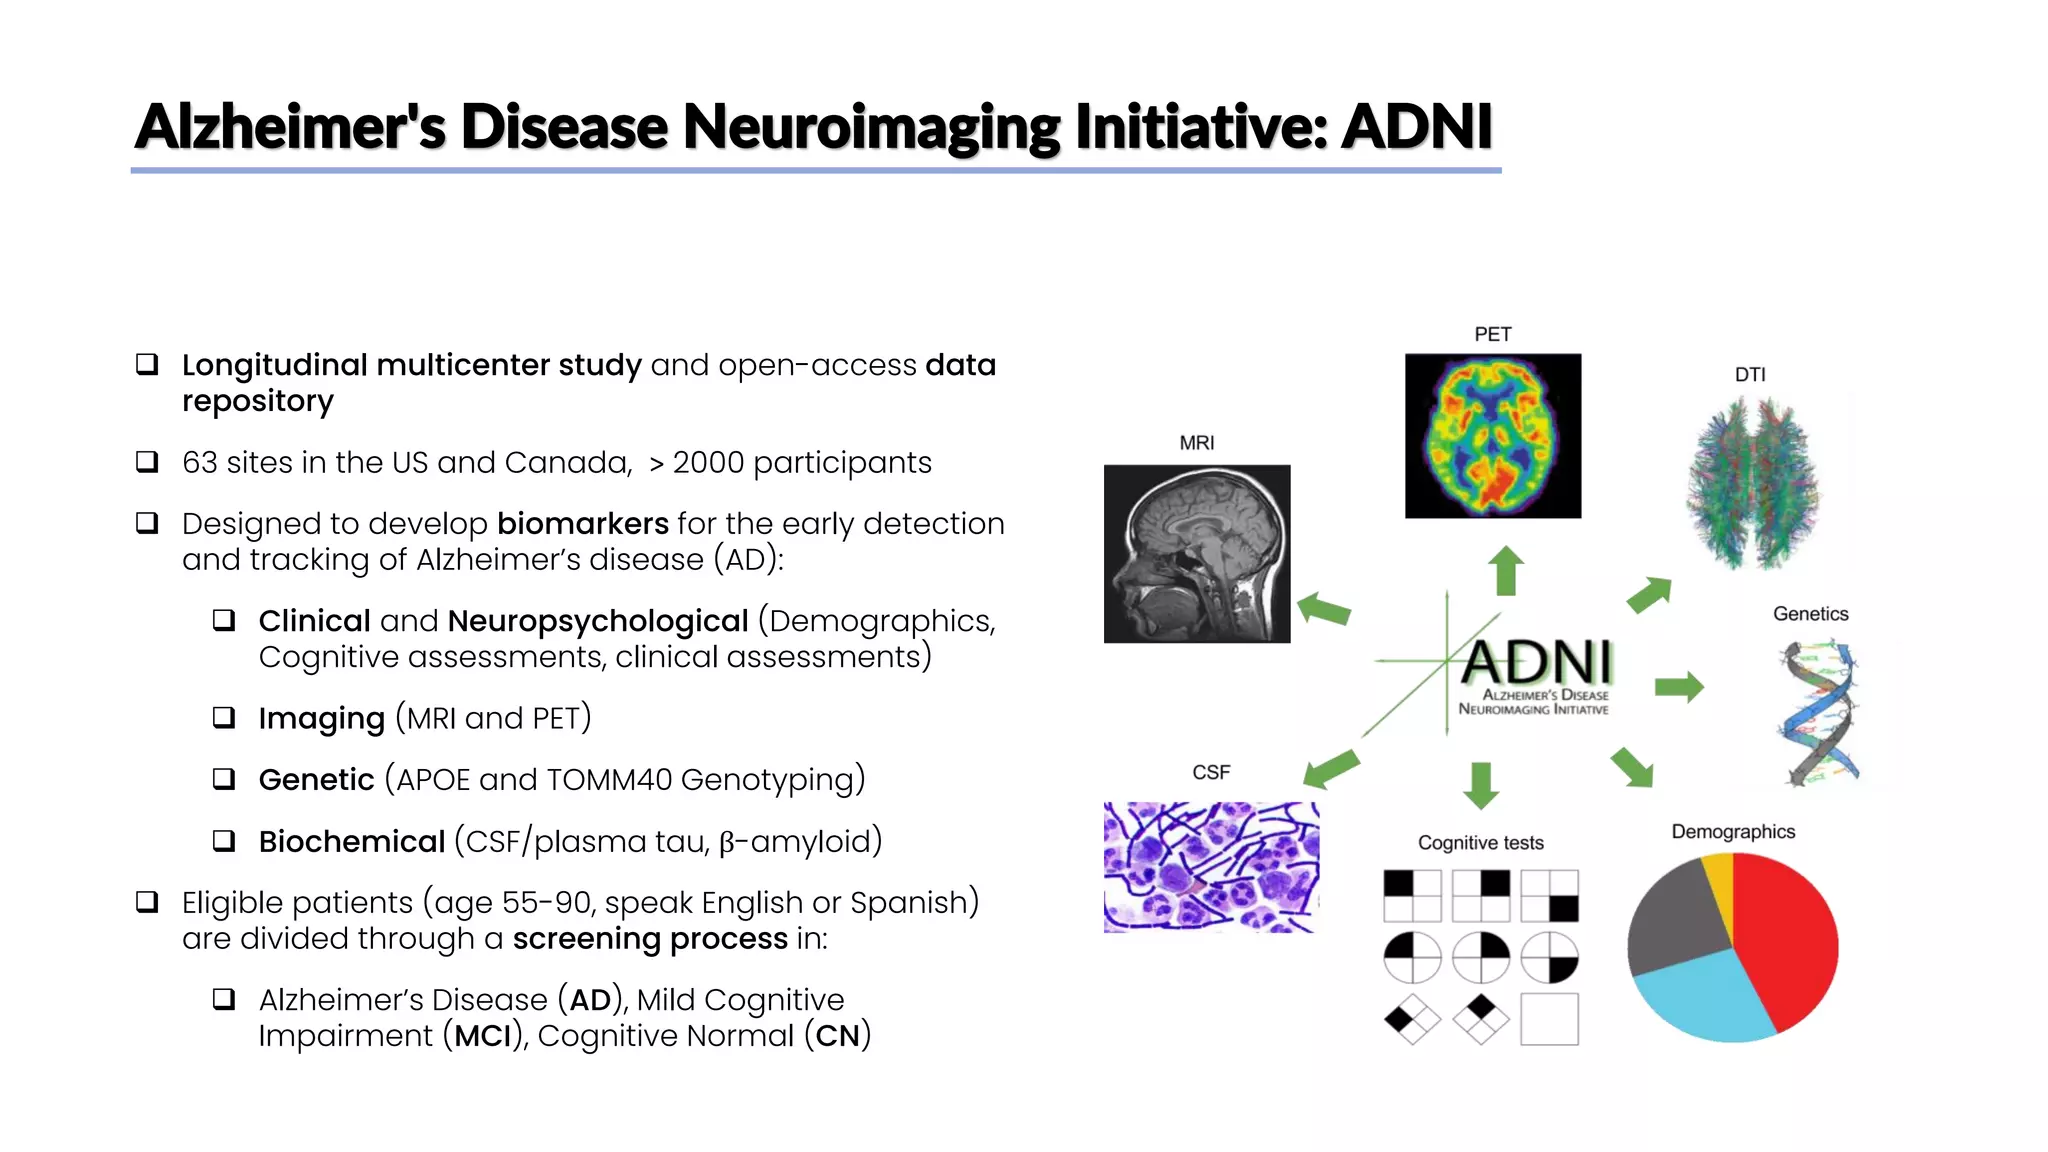
![Class imbalance
❑ Main paper [1] idea:
❑ Only tried to achieve high accuracy, no distinction
between FP and FN
❑ Same (imbalanced) distribution of CN and AD
users in train, validation and test set
❑ Our take:
❑ FN errors (diagnosing as healthy a patient who’s
actually sick) are worse than FP
❑ Creation of a balanced train set on subjects (to
decrease FN) keeping test and validation sets
unbalanced (to keep a good guess of real
performances on new patients)
Train Validation Test
n. of
subjects
(n. of
images)
total 240
(~47k)
21
(~4.5k)
36
(~11k)
CN 151
(~40k)
13
(~2.4k)
20
(~6.7k)
AD 89
(~17k)
8
(~2.1k)
16
(~4k)](https://image.slidesharecdn.com/datascienceinbioscences-finalprojectreport-230614150035-d72560ac/75/Identification-Of-Alzheimer-s-Disease-Using-A-Deep-Learning-Method-Based-On-T1-w-Brain-Mri-Images-30-2048.jpg)
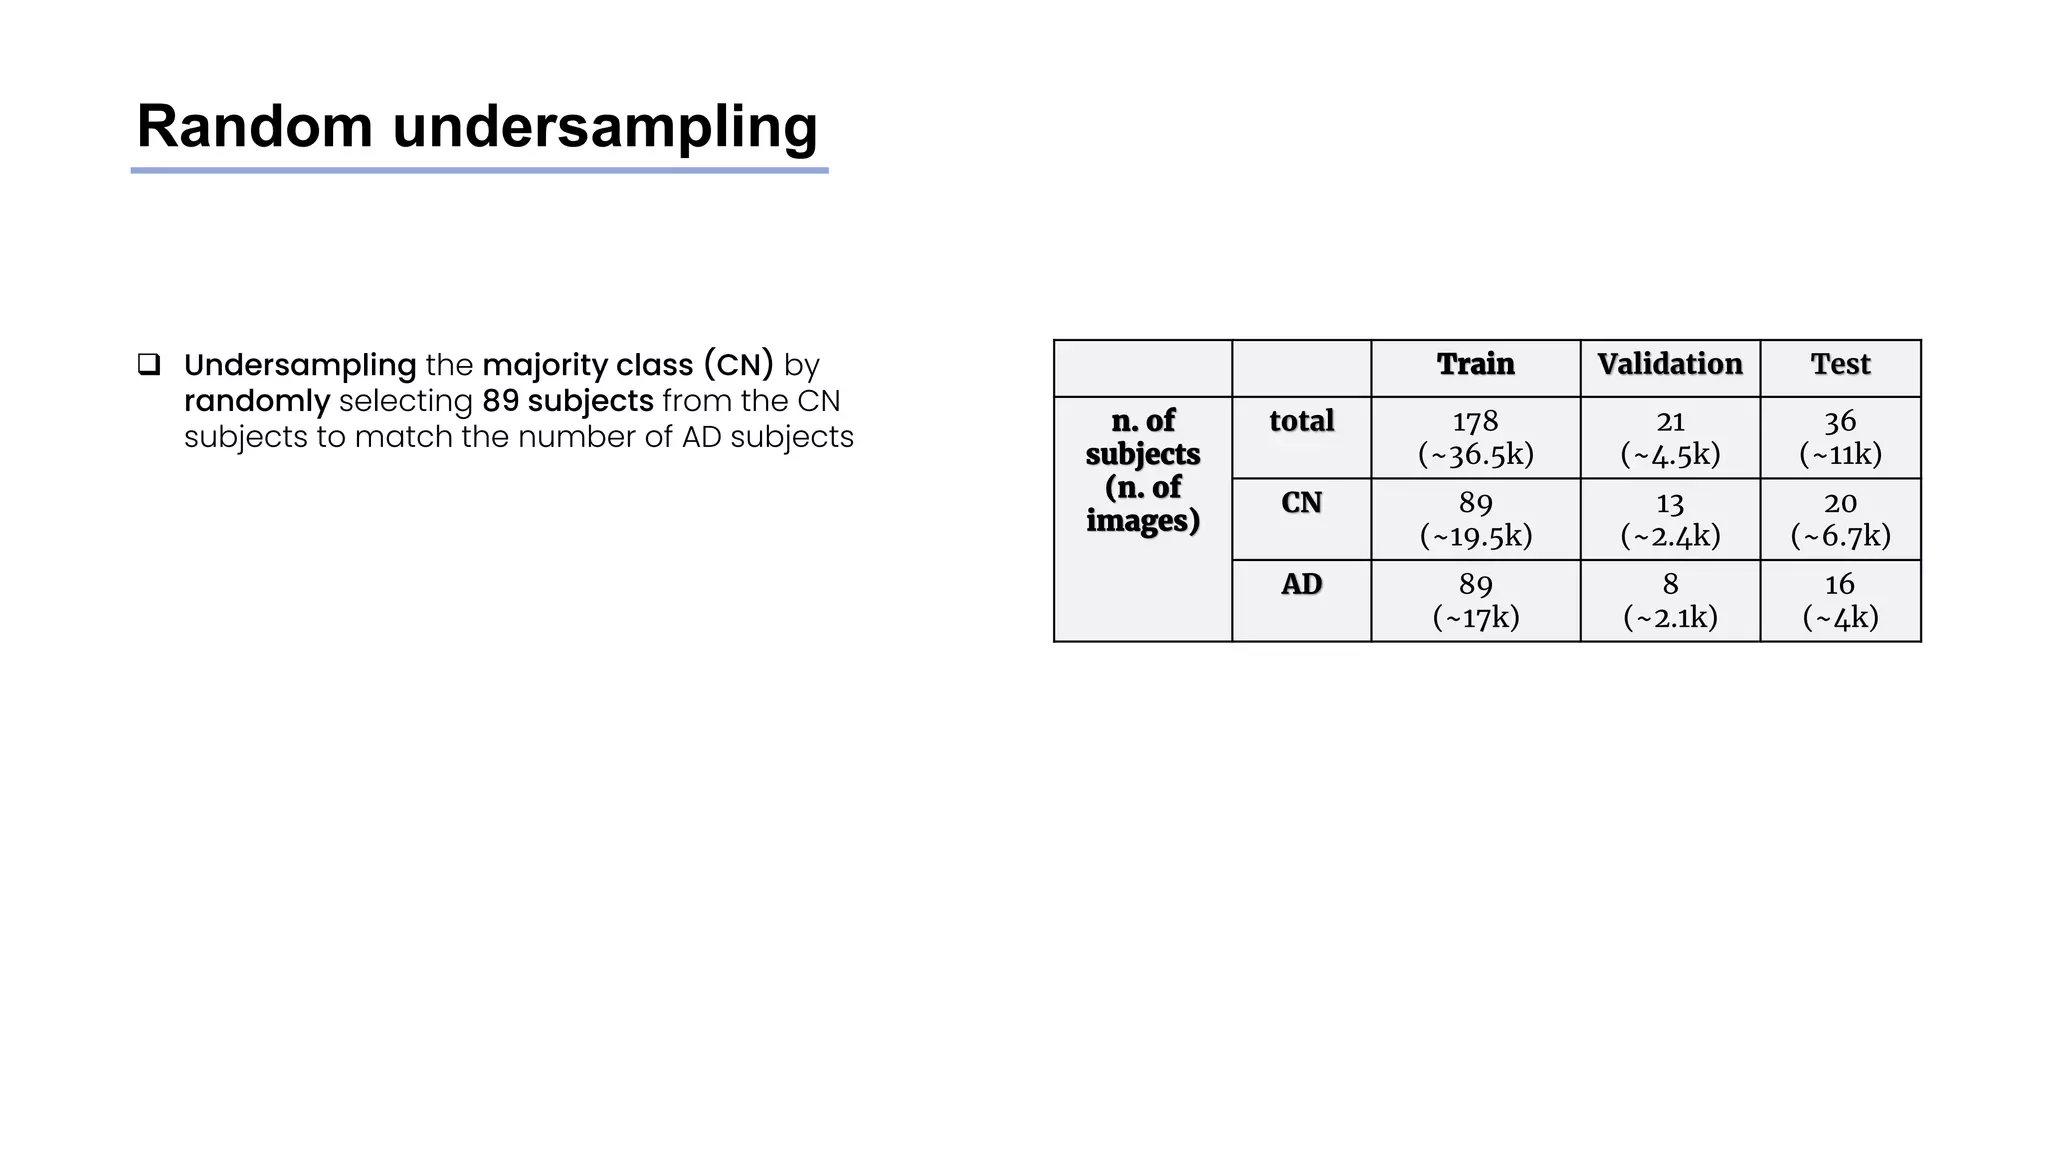
![Stratified undersampling
❑ Random undersampling method on the train set did
not consider metadata: some attributes have an
impact on MRI scans images
❑ To have a more representative image dataset and
avoid bias we undersample the CN class subjects
while mantaining the original distribution of the
following attributes:
❑ Age (older subjects’ MRI scans tend to look like AD
brains even if they don’t have it)
❑ Weight (levels of fat influence MRI scans [6])
❑ Sex (MRI scans are slightly different between
genders)
❑ We divided Age and weight into categories to perform
the undersampling
Train Validation Test
n. of
subjects
(n. of
images)
total 178
(~36.5k)
21
(~4.5k)
36
(~11k)
CN 89
(~20k)
13
(~2.4k)
20
(~6.7k)
AD 89
(~17k)
8
(~2.1k)
16
(~4k)](https://image.slidesharecdn.com/datascienceinbioscences-finalprojectreport-230614150035-d72560ac/75/Identification-Of-Alzheimer-s-Disease-Using-A-Deep-Learning-Method-Based-On-T1-w-Brain-Mri-Images-32-2048.jpg)

![Results: Unbalanced Train Set
Ground
Truth
Prediction
AD Recall CN Recall Accuracy
0.35 0.90 0.70
❑ The model adopted by [1], that only aimed for high
accuracy
❑ As expected, the imbalance in the training set
causes a bias: the model predicts very often CN
❑ High CN Recall
❑ Very low AD Recall
❑ n. of subjects (n. of images) per class/split
° train subj (img) val subj (img) test subj
(img)
AD 89 (~17k) 8 (2378) 16 (4011)
NC 151 (~39k) 13 (2194) 20 (6737)](https://image.slidesharecdn.com/datascienceinbioscences-finalprojectreport-230614150035-d72560ac/75/Identification-Of-Alzheimer-s-Disease-Using-A-Deep-Learning-Method-Based-On-T1-w-Brain-Mri-Images-41-2048.jpg)


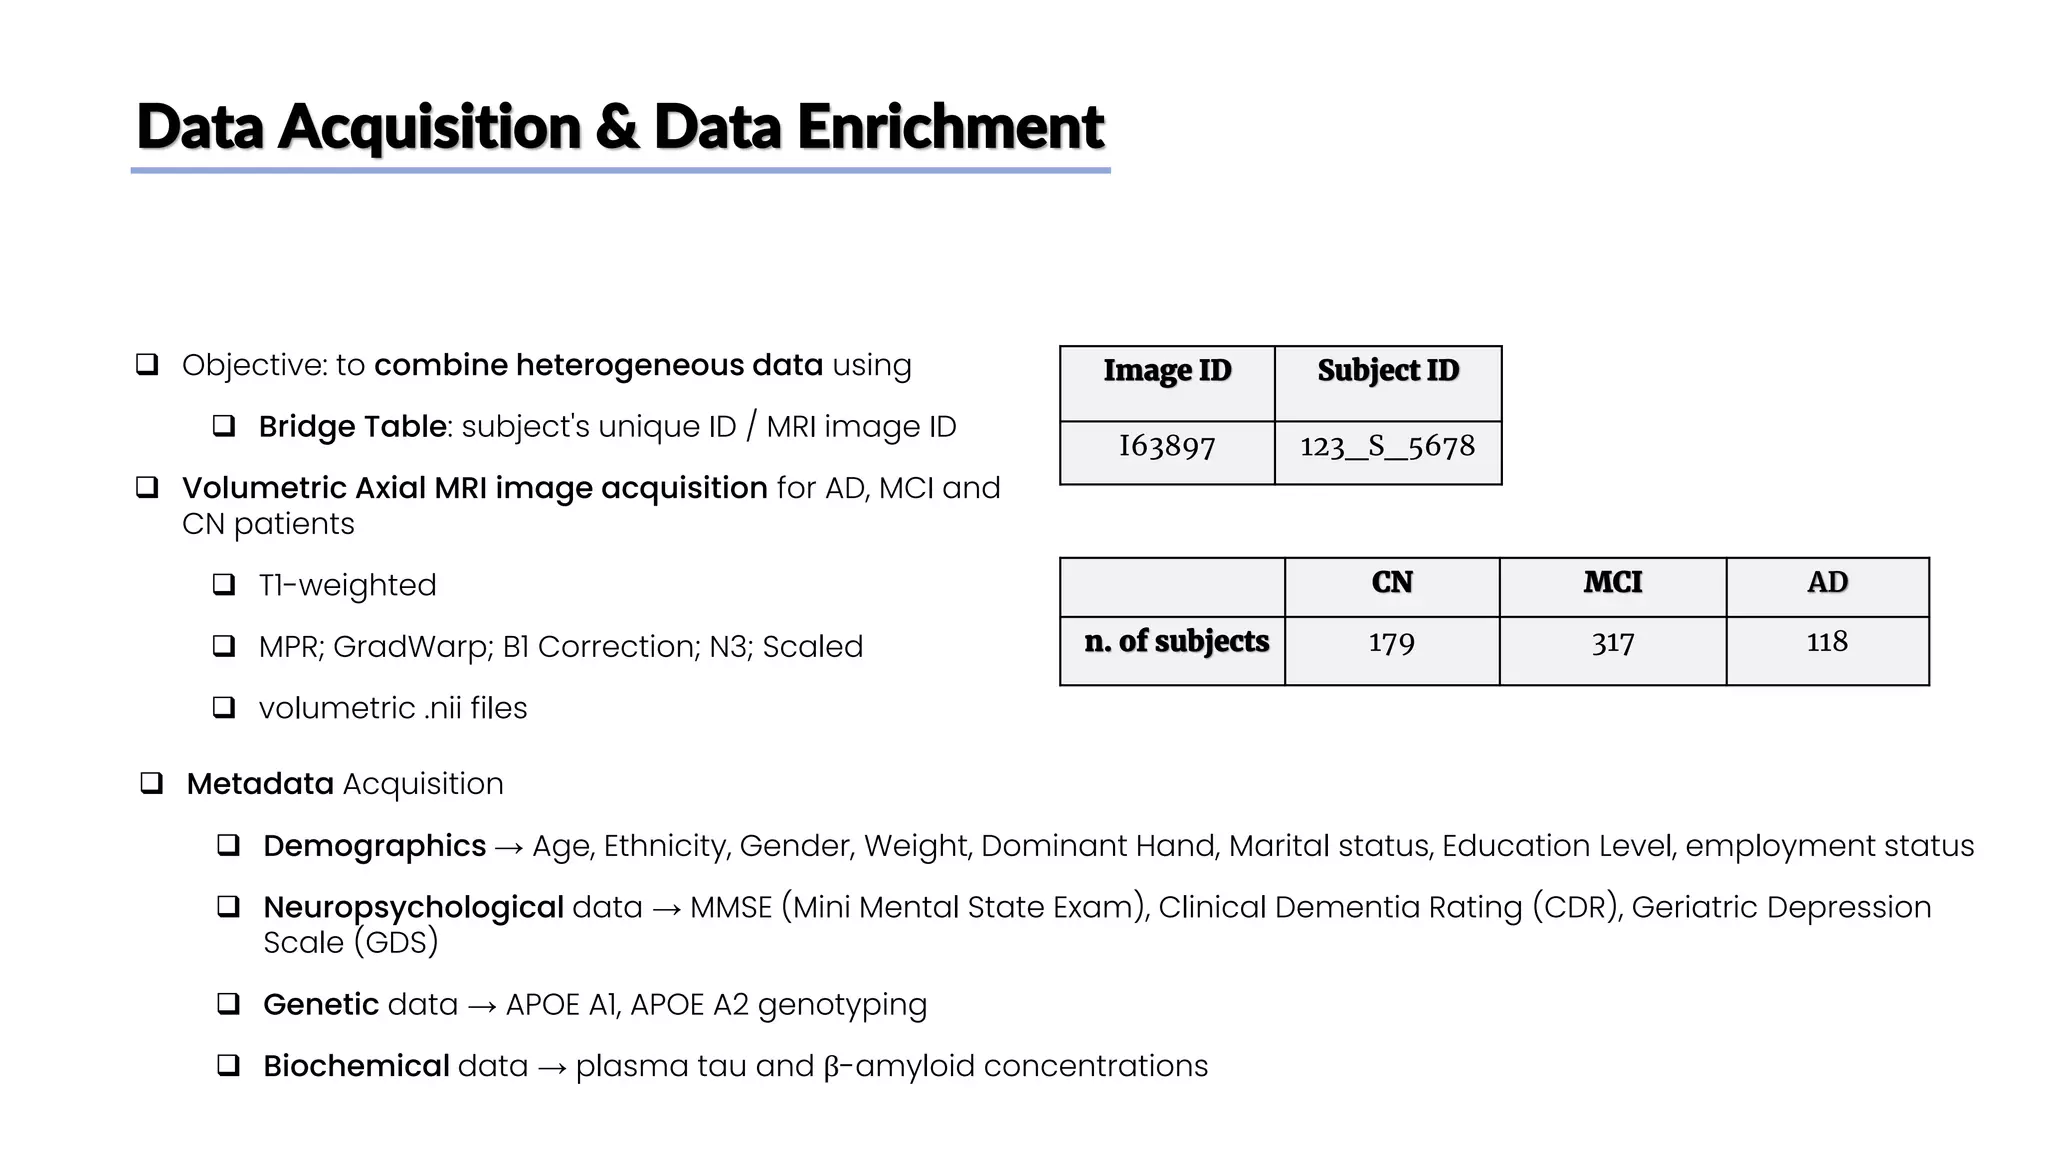
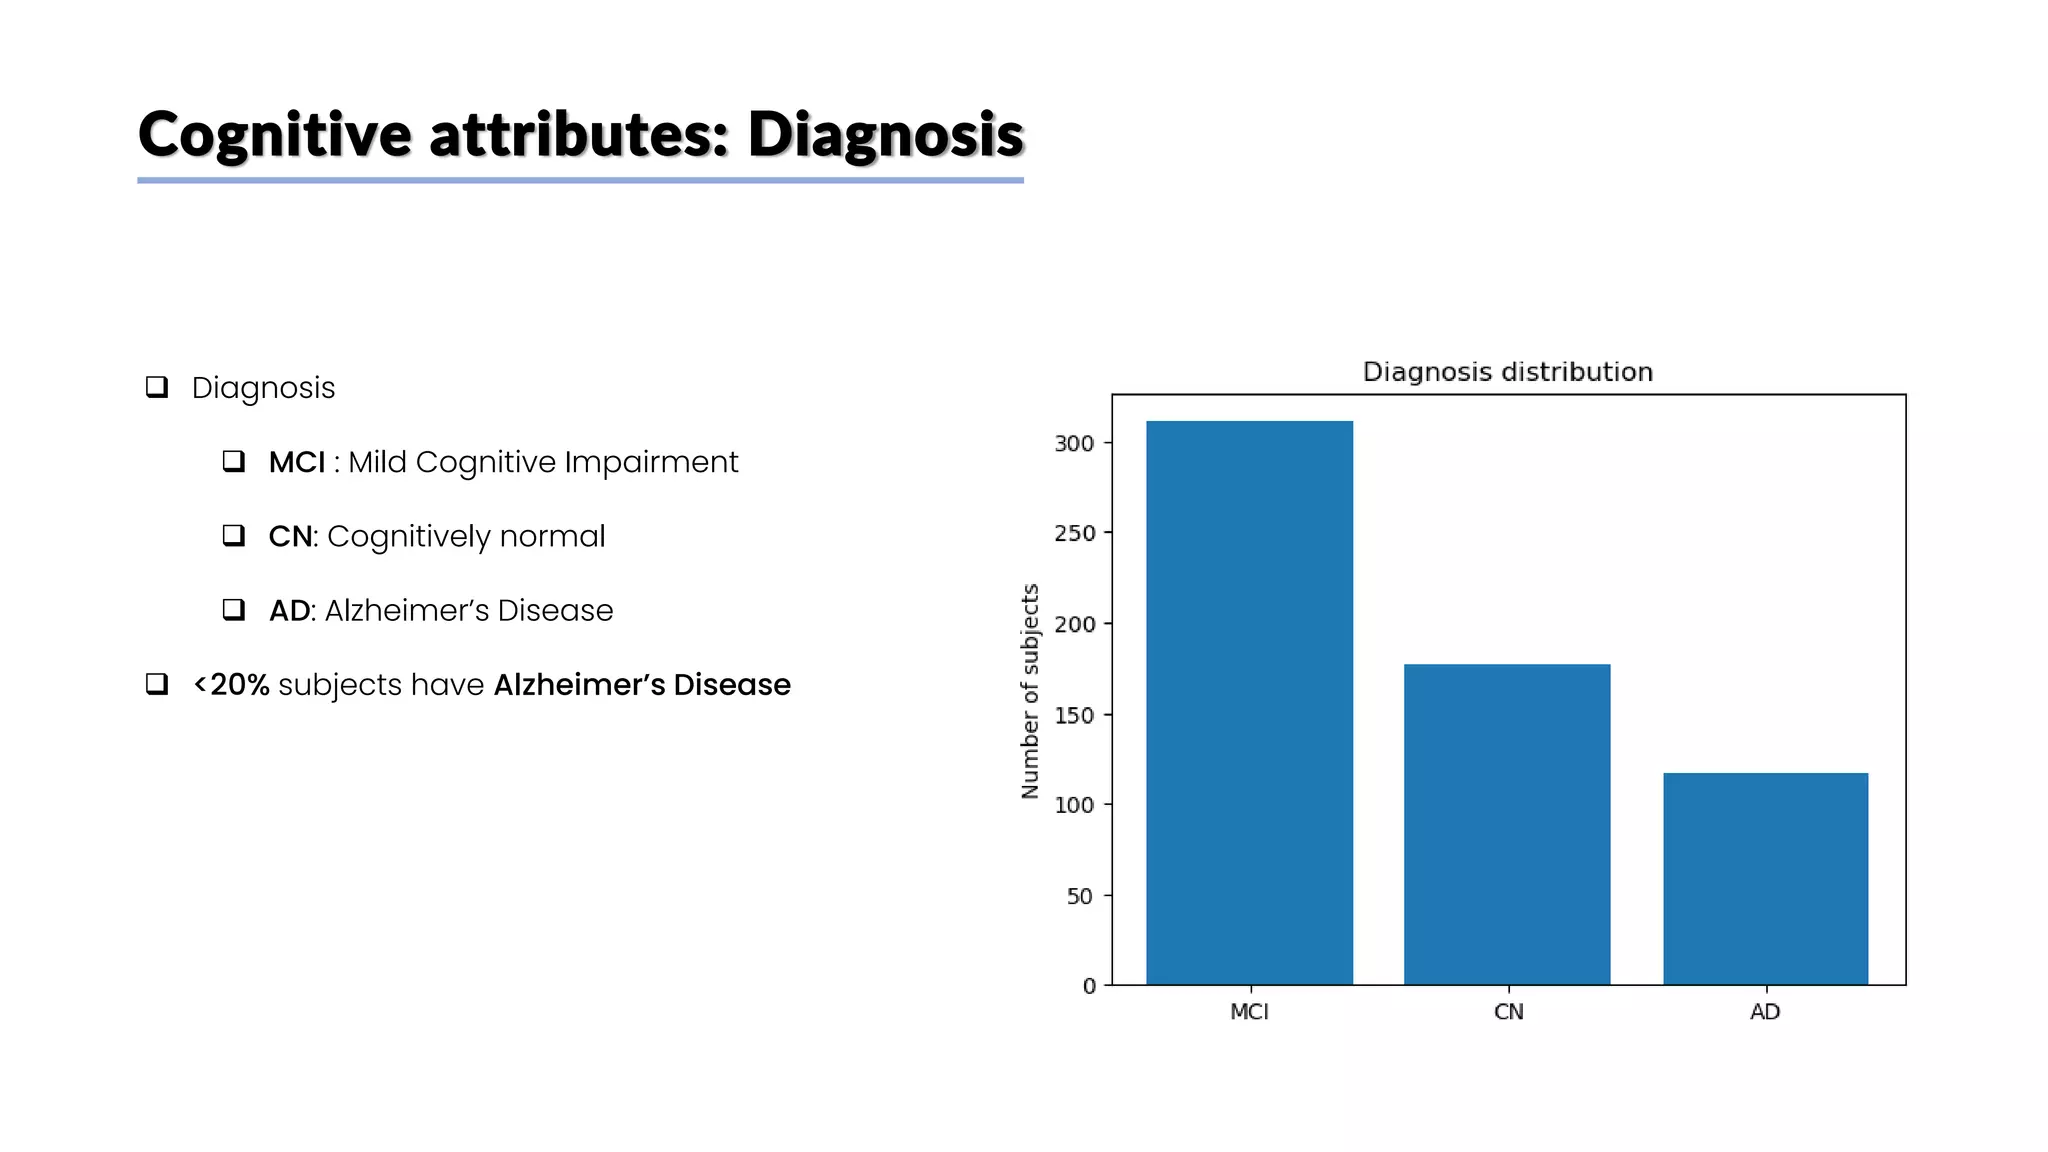
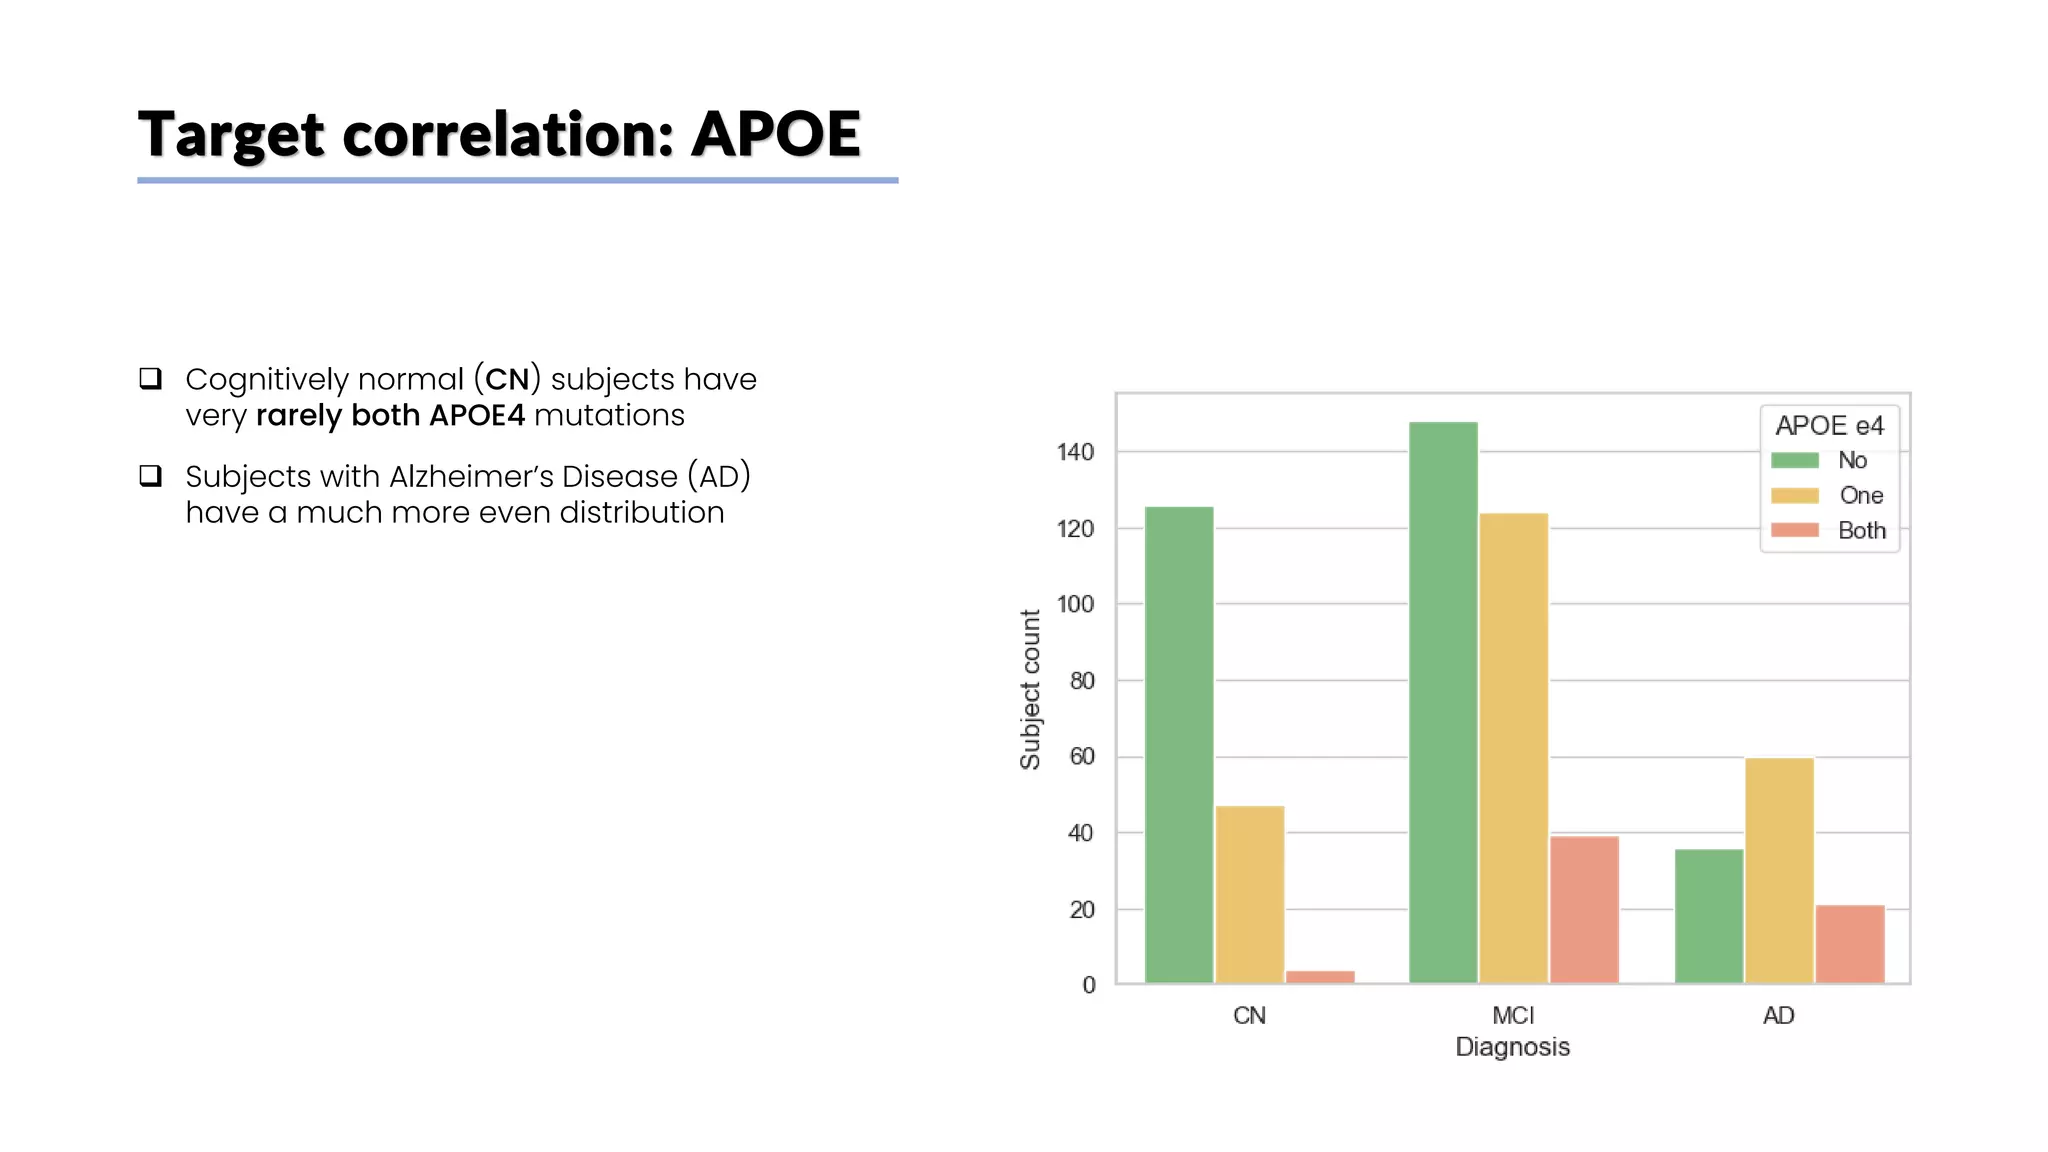
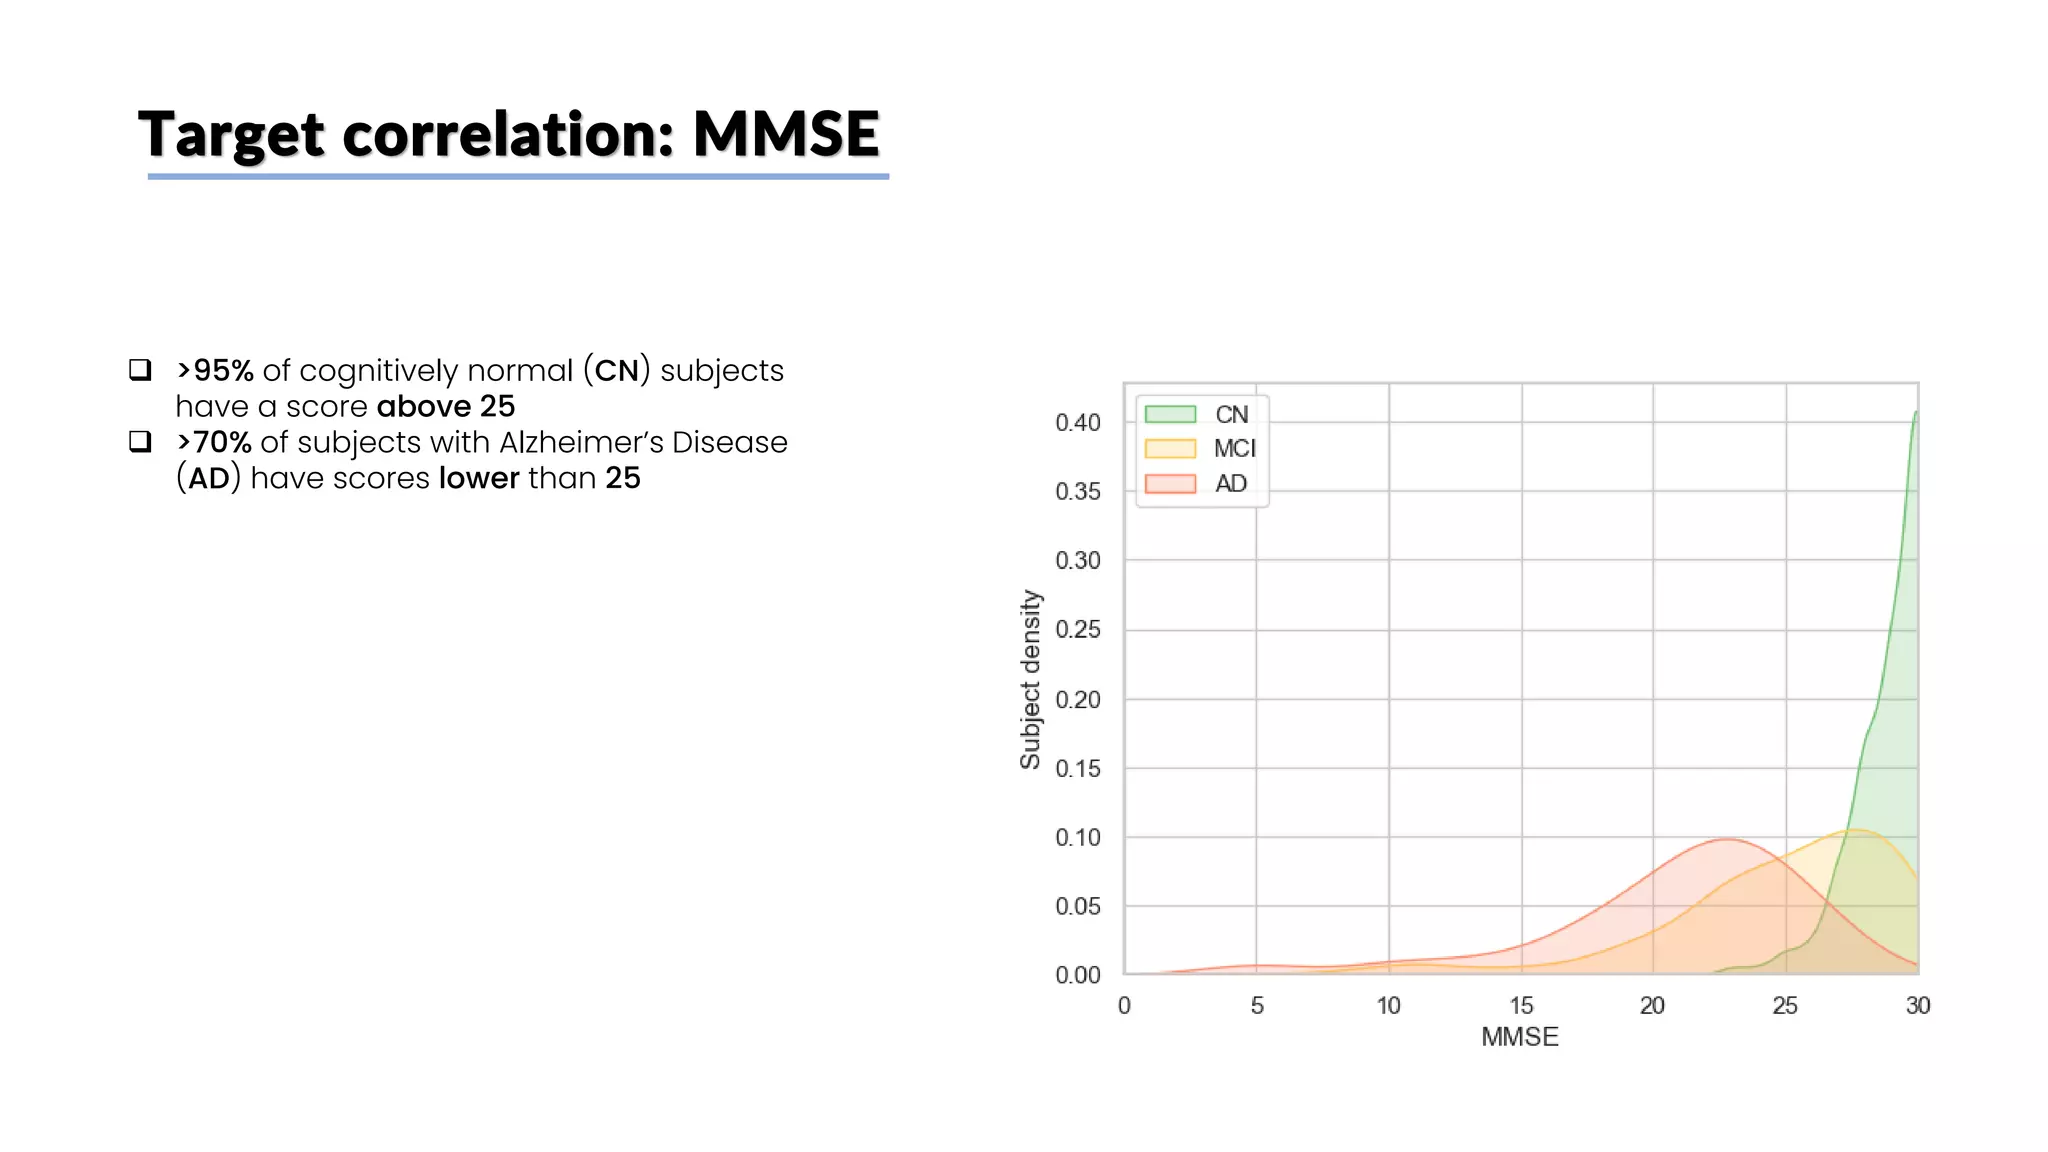
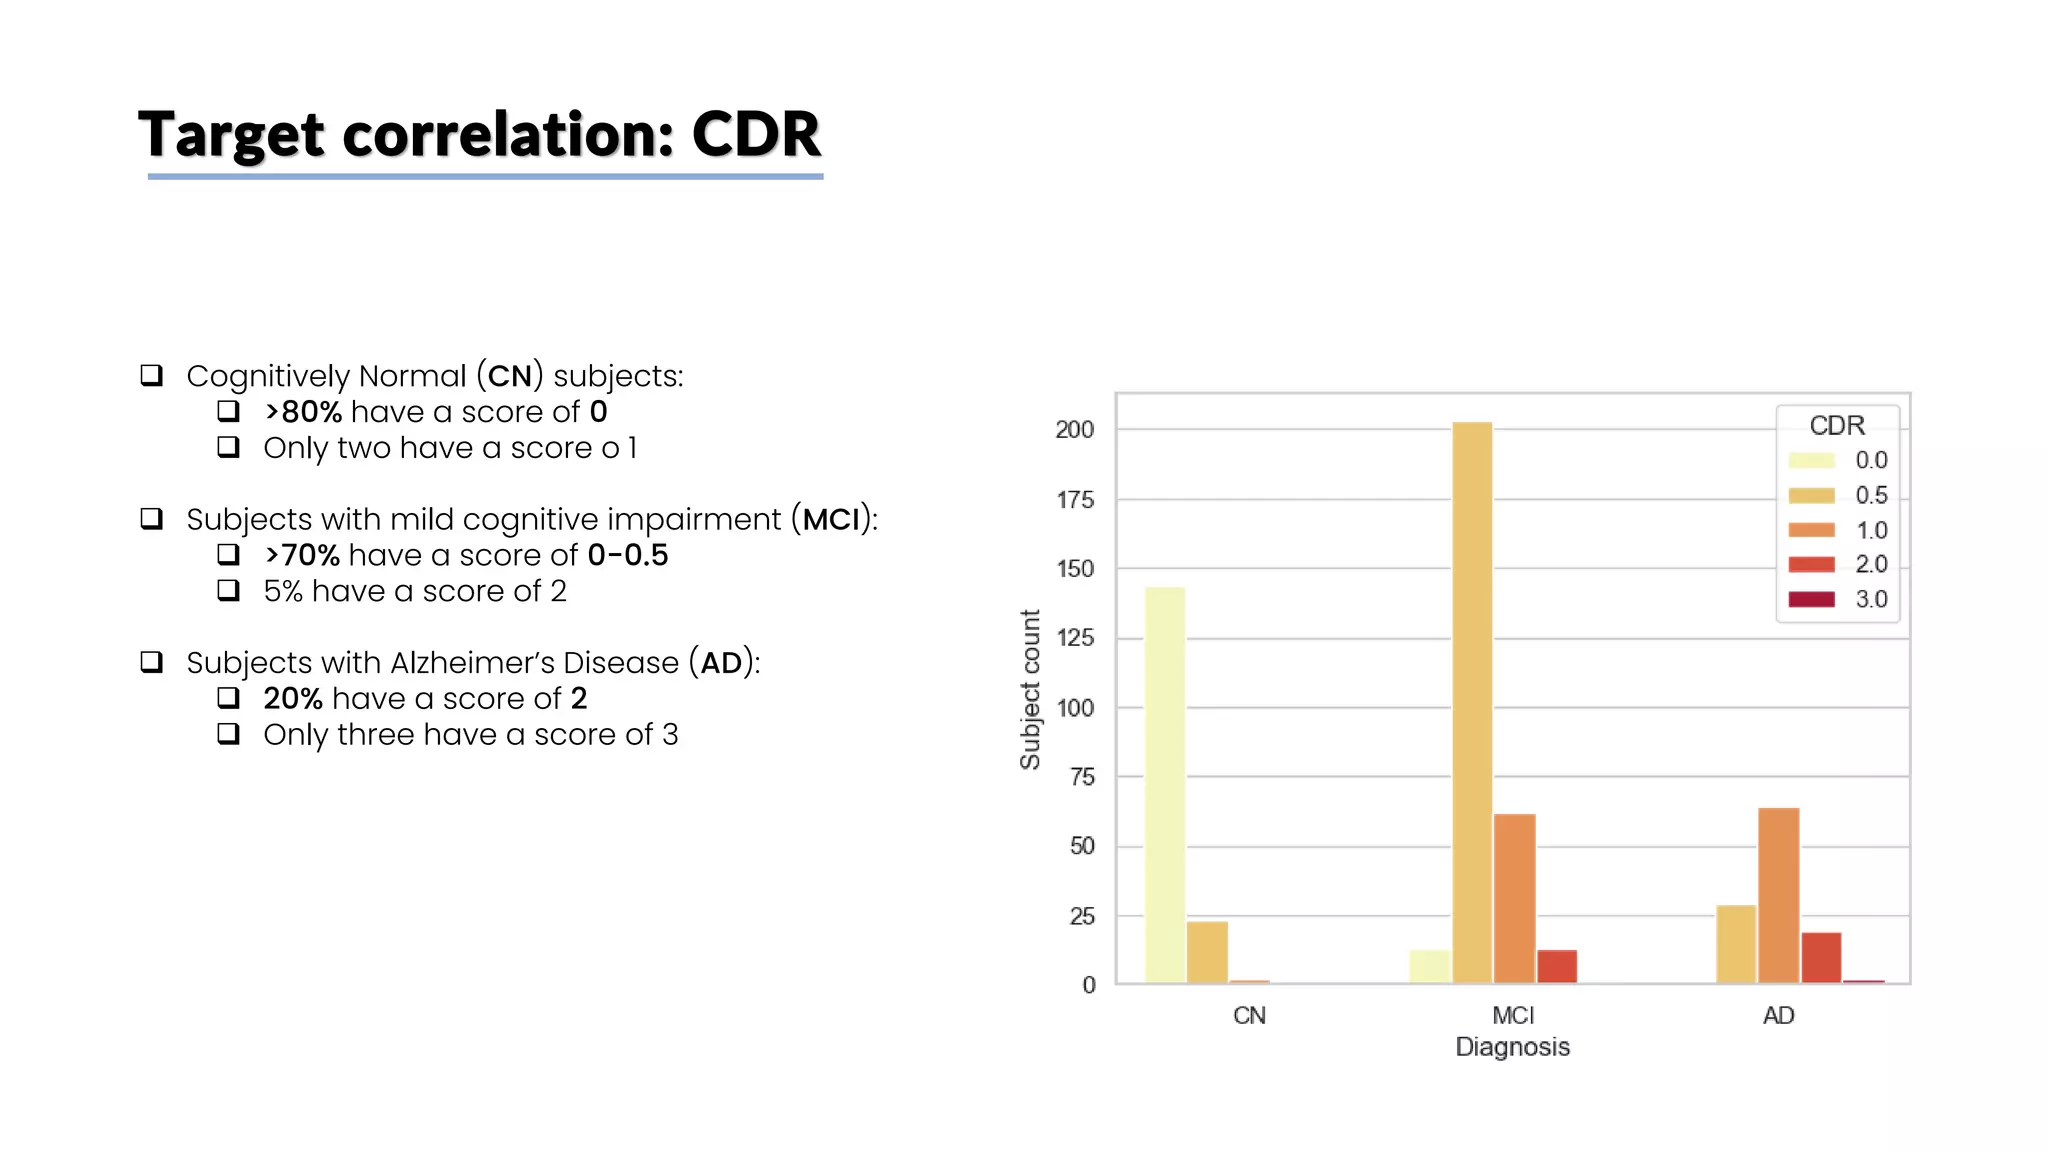
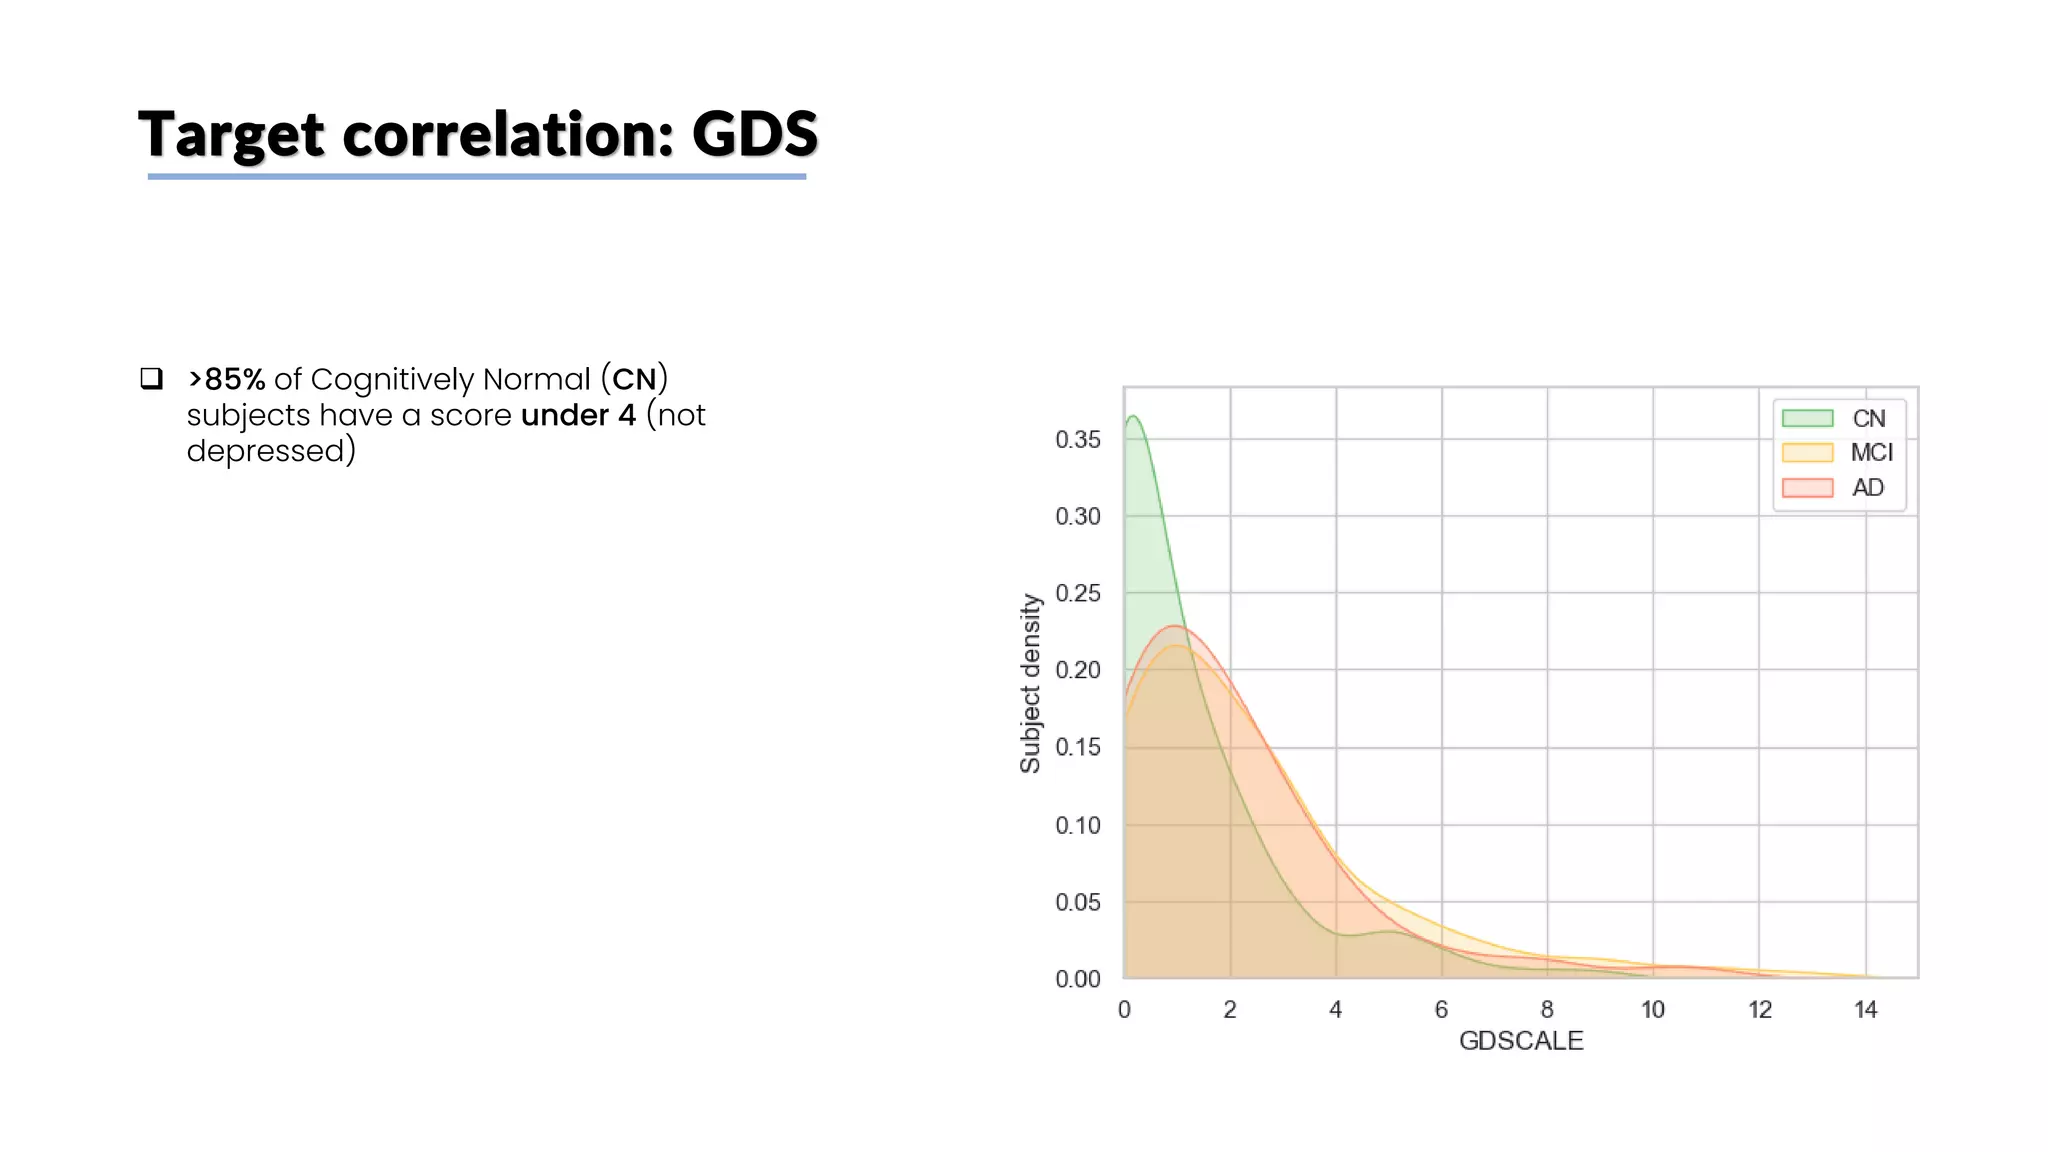
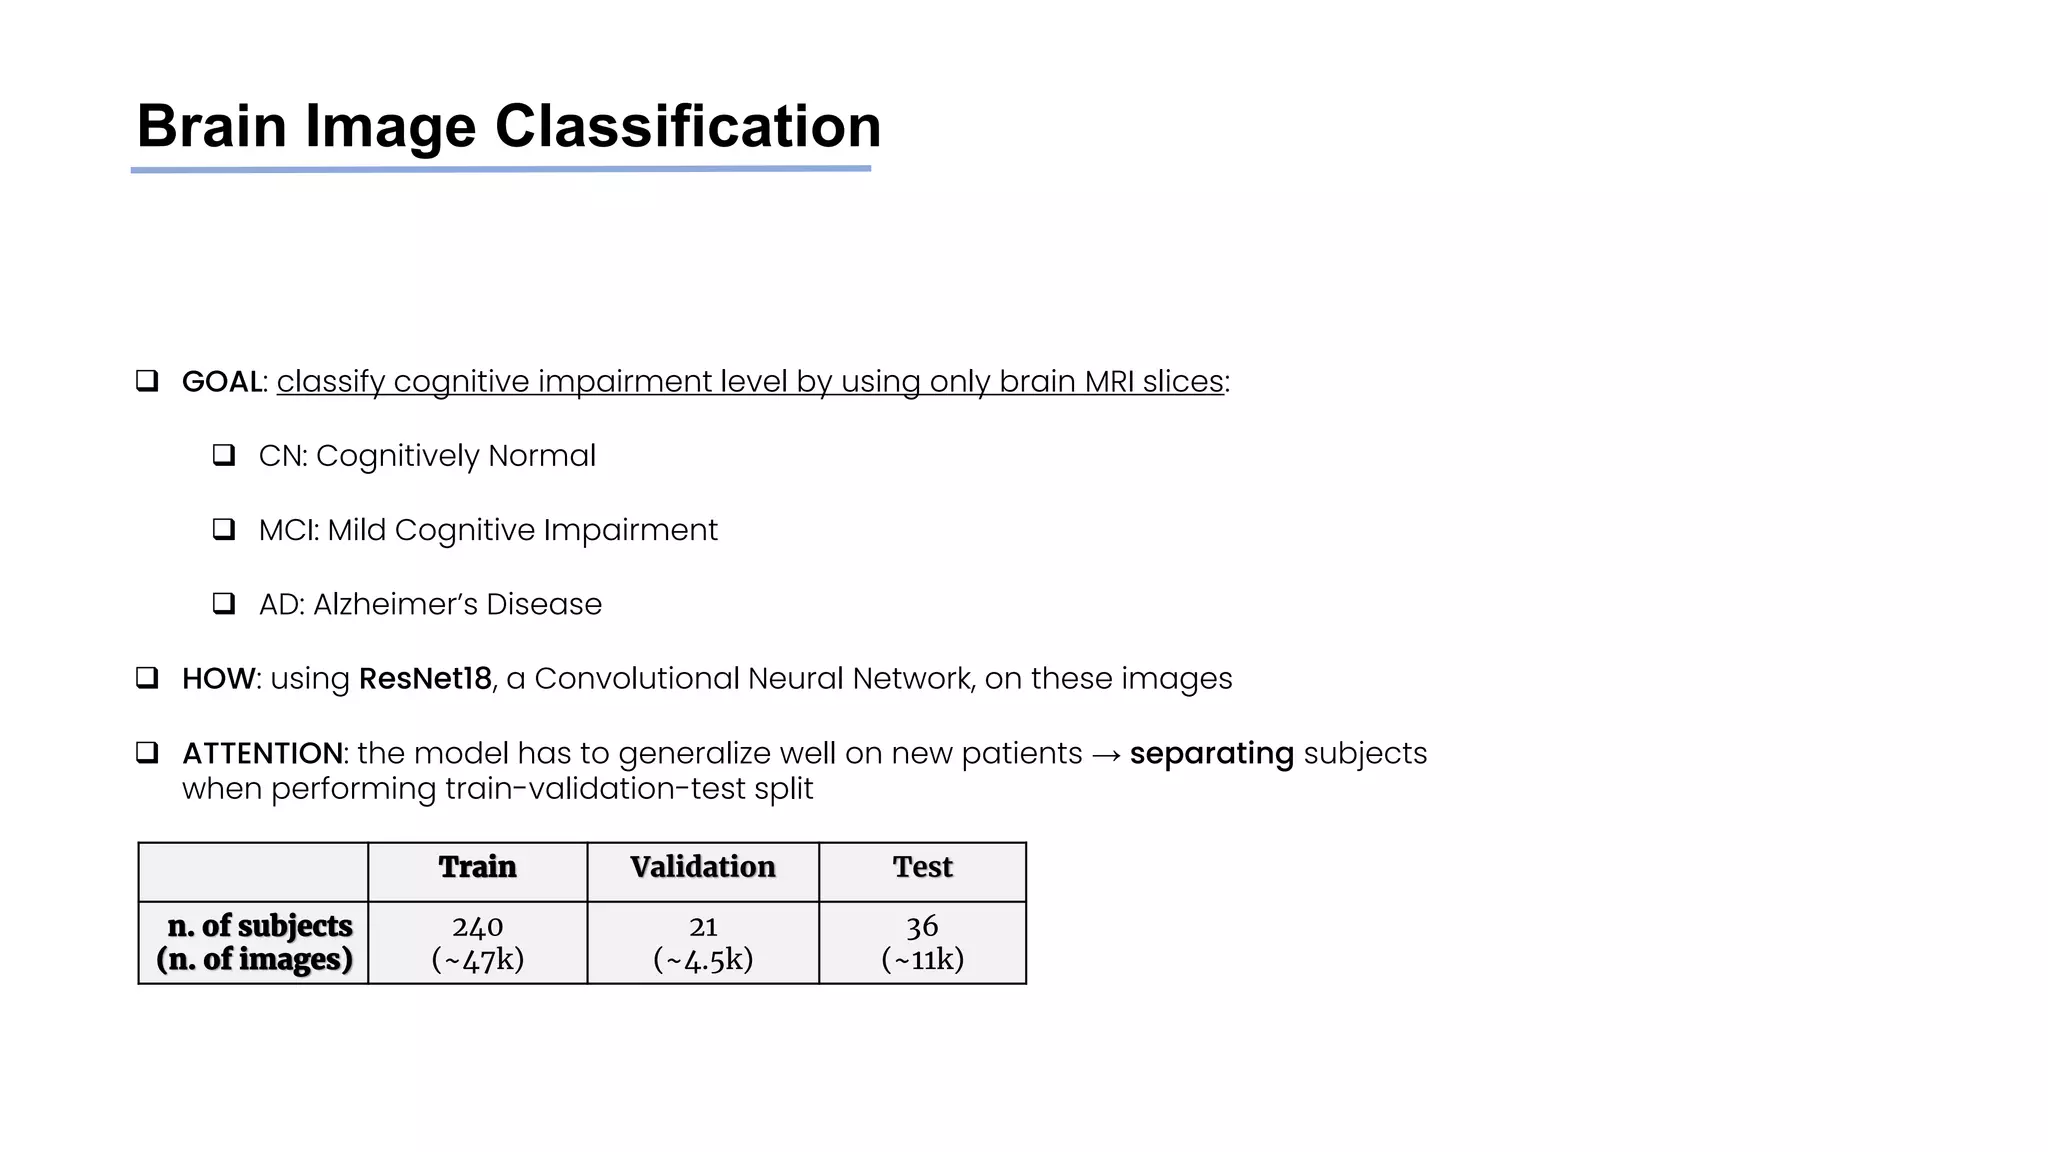
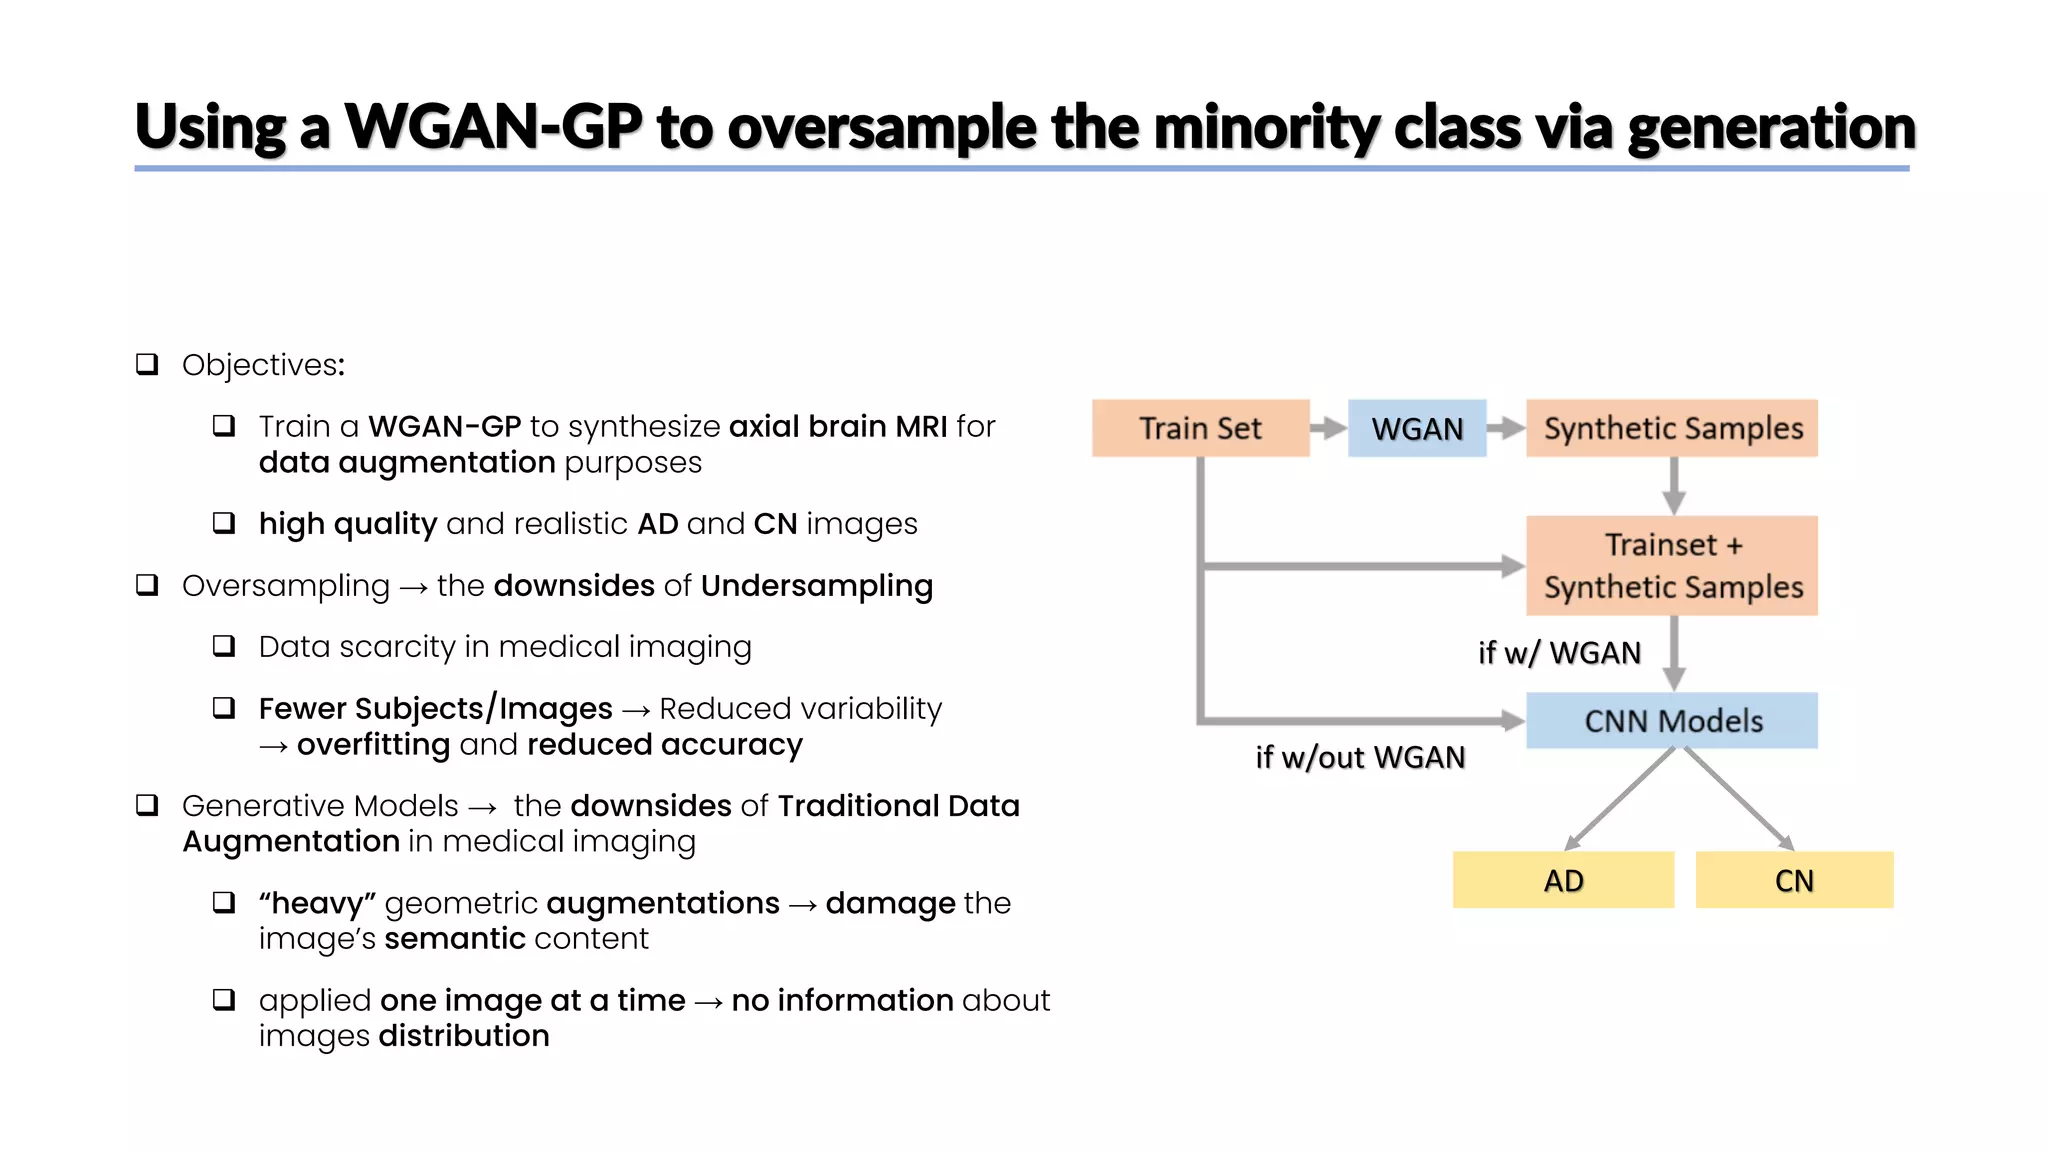
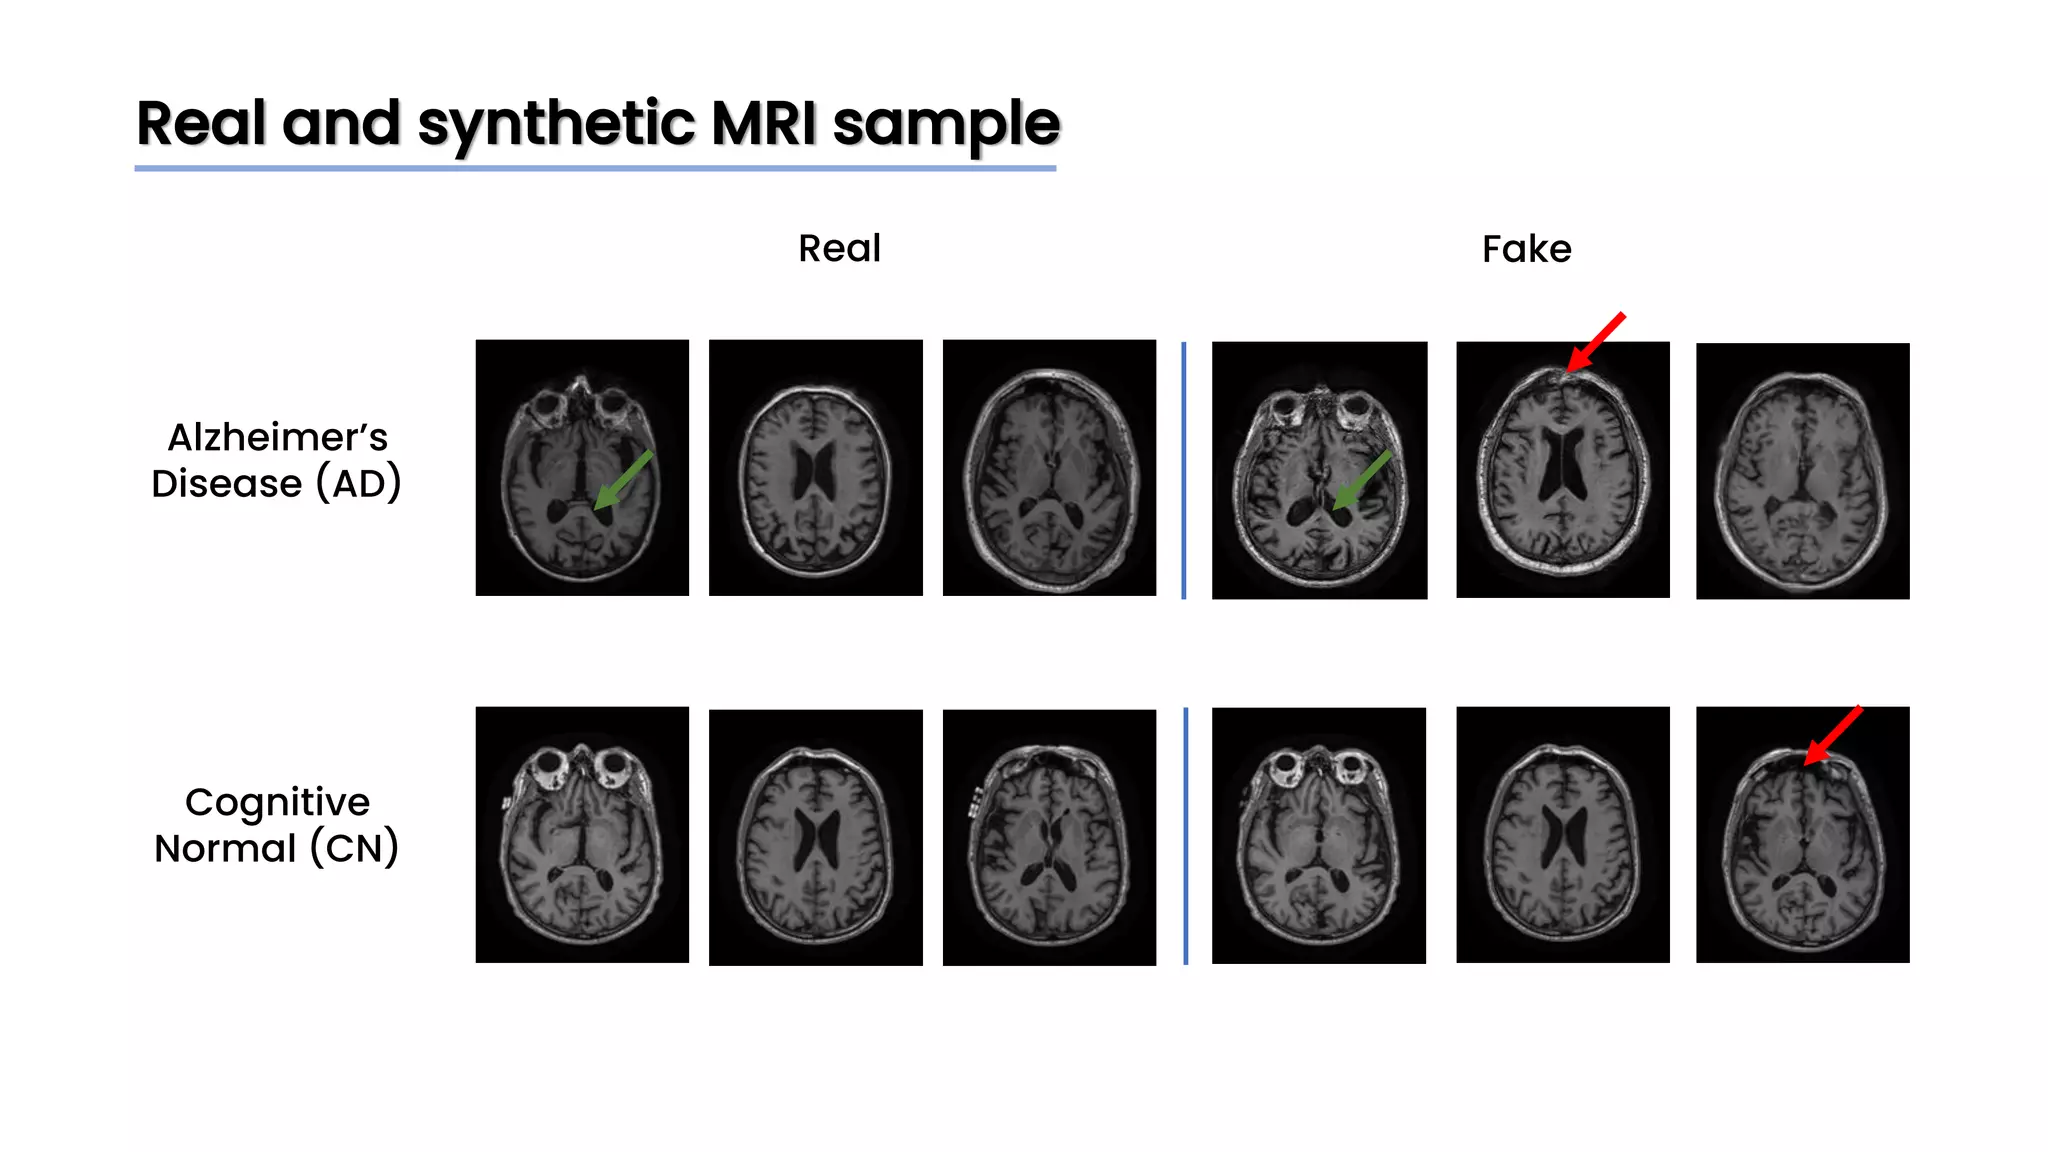
The document discusses a study that aimed to classify Alzheimer's disease using deep learning on T1-weighted brain MRI images. Specifically, it sought to 1) build a dataset from the ADNI database combining MRI images with clinical data, 2) train a deep neural network to classify images as Cognitive Normal or Alzheimer's, and 3) evaluate techniques for addressing class imbalance. The researchers explored the ADNI data, finding correlations between diagnostic labels and attributes. They then trained a ResNet model for binary classification but faced class imbalance issues given the rarity of Alzheimer's cases. To address this, they evaluated random and stratified undersampling of the majority class as well as oversampling the minority class using a WGAN-GP for synthetic image generation.


![[MICCAI 2022] Meta-hallucinator: Towards Few-Shot Cross-Modality Cardiac Imag...](https://cdn.slidesharecdn.com/ss_thumbnails/presentation-copy-220925094724-ff51f7fd-thumbnail.jpg?width=640&height=640&fit=bounds)


![[DSC Europe 25] Hans Kleinsman - The Compliance Gearbox: How Tax Tech Mediate...](https://cdn.slidesharecdn.com/ss_thumbnails/dxdytie1toel0hr90bjs-2-251212103250-174fdbe7-thumbnail.jpg?width=640&height=640&fit=bounds)


![[DSC Europe 25] Jovan Bogicevic - Legacy to AI-Driven Defense: Transforming D...](https://cdn.slidesharecdn.com/ss_thumbnails/rsarluadt563hntyfc8q-3-251211083849-3e7bc4c0-thumbnail.jpg?width=640&height=640&fit=bounds)

![[DSC Europe 25] Ivan Peric - Intelligence Swarm Logic and Techno-Functional M...](https://cdn.slidesharecdn.com/ss_thumbnails/7my7c97fsduiccadgavw-2-251212103249-5a03f7c6-thumbnail.jpg?width=640&height=640&fit=bounds)
![[DSC Europe 25] Dusan Nesic - Securing Tomorrow’s Infrastructure: Why Cyber-P...](https://cdn.slidesharecdn.com/ss_thumbnails/qikbszfftyowjm2q6duw-1-251211083848-8f2ead6b-thumbnail.jpg?width=640&height=640&fit=bounds)
![[DSC Europe 25] Milan Sekuloski - Data, Defence, and Development: Cybersecuri...](https://cdn.slidesharecdn.com/ss_thumbnails/dfrkwwx4qly6atqpbl4z-4-251209104645-c3d4b0ca-thumbnail.jpg?width=640&height=640&fit=bounds)
