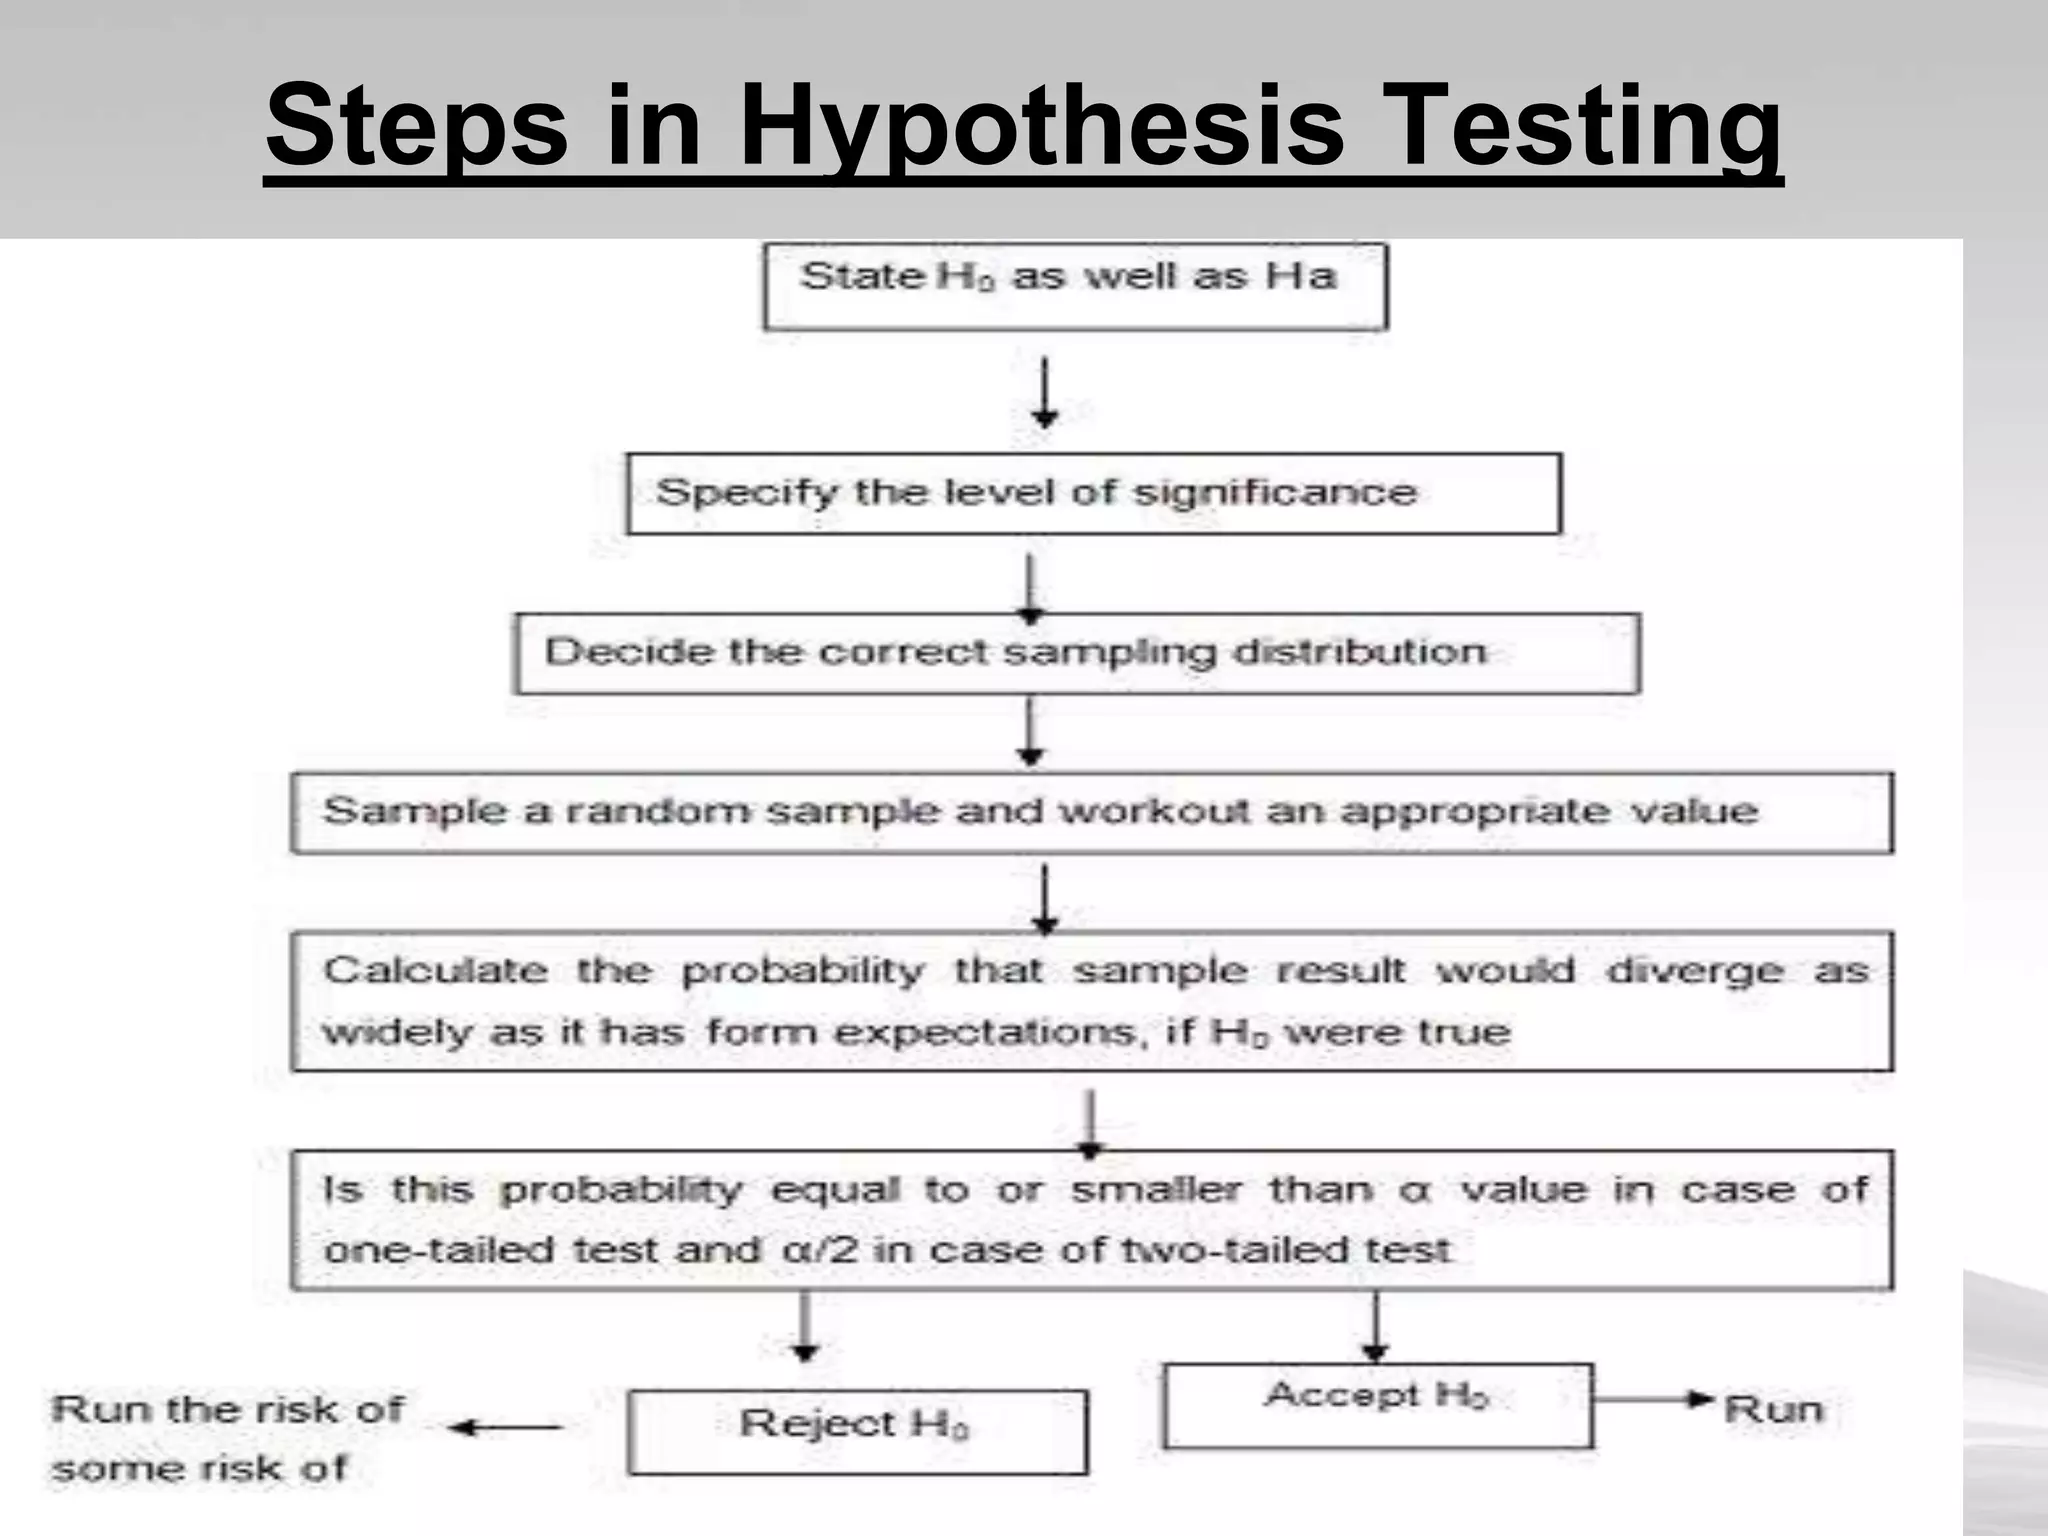
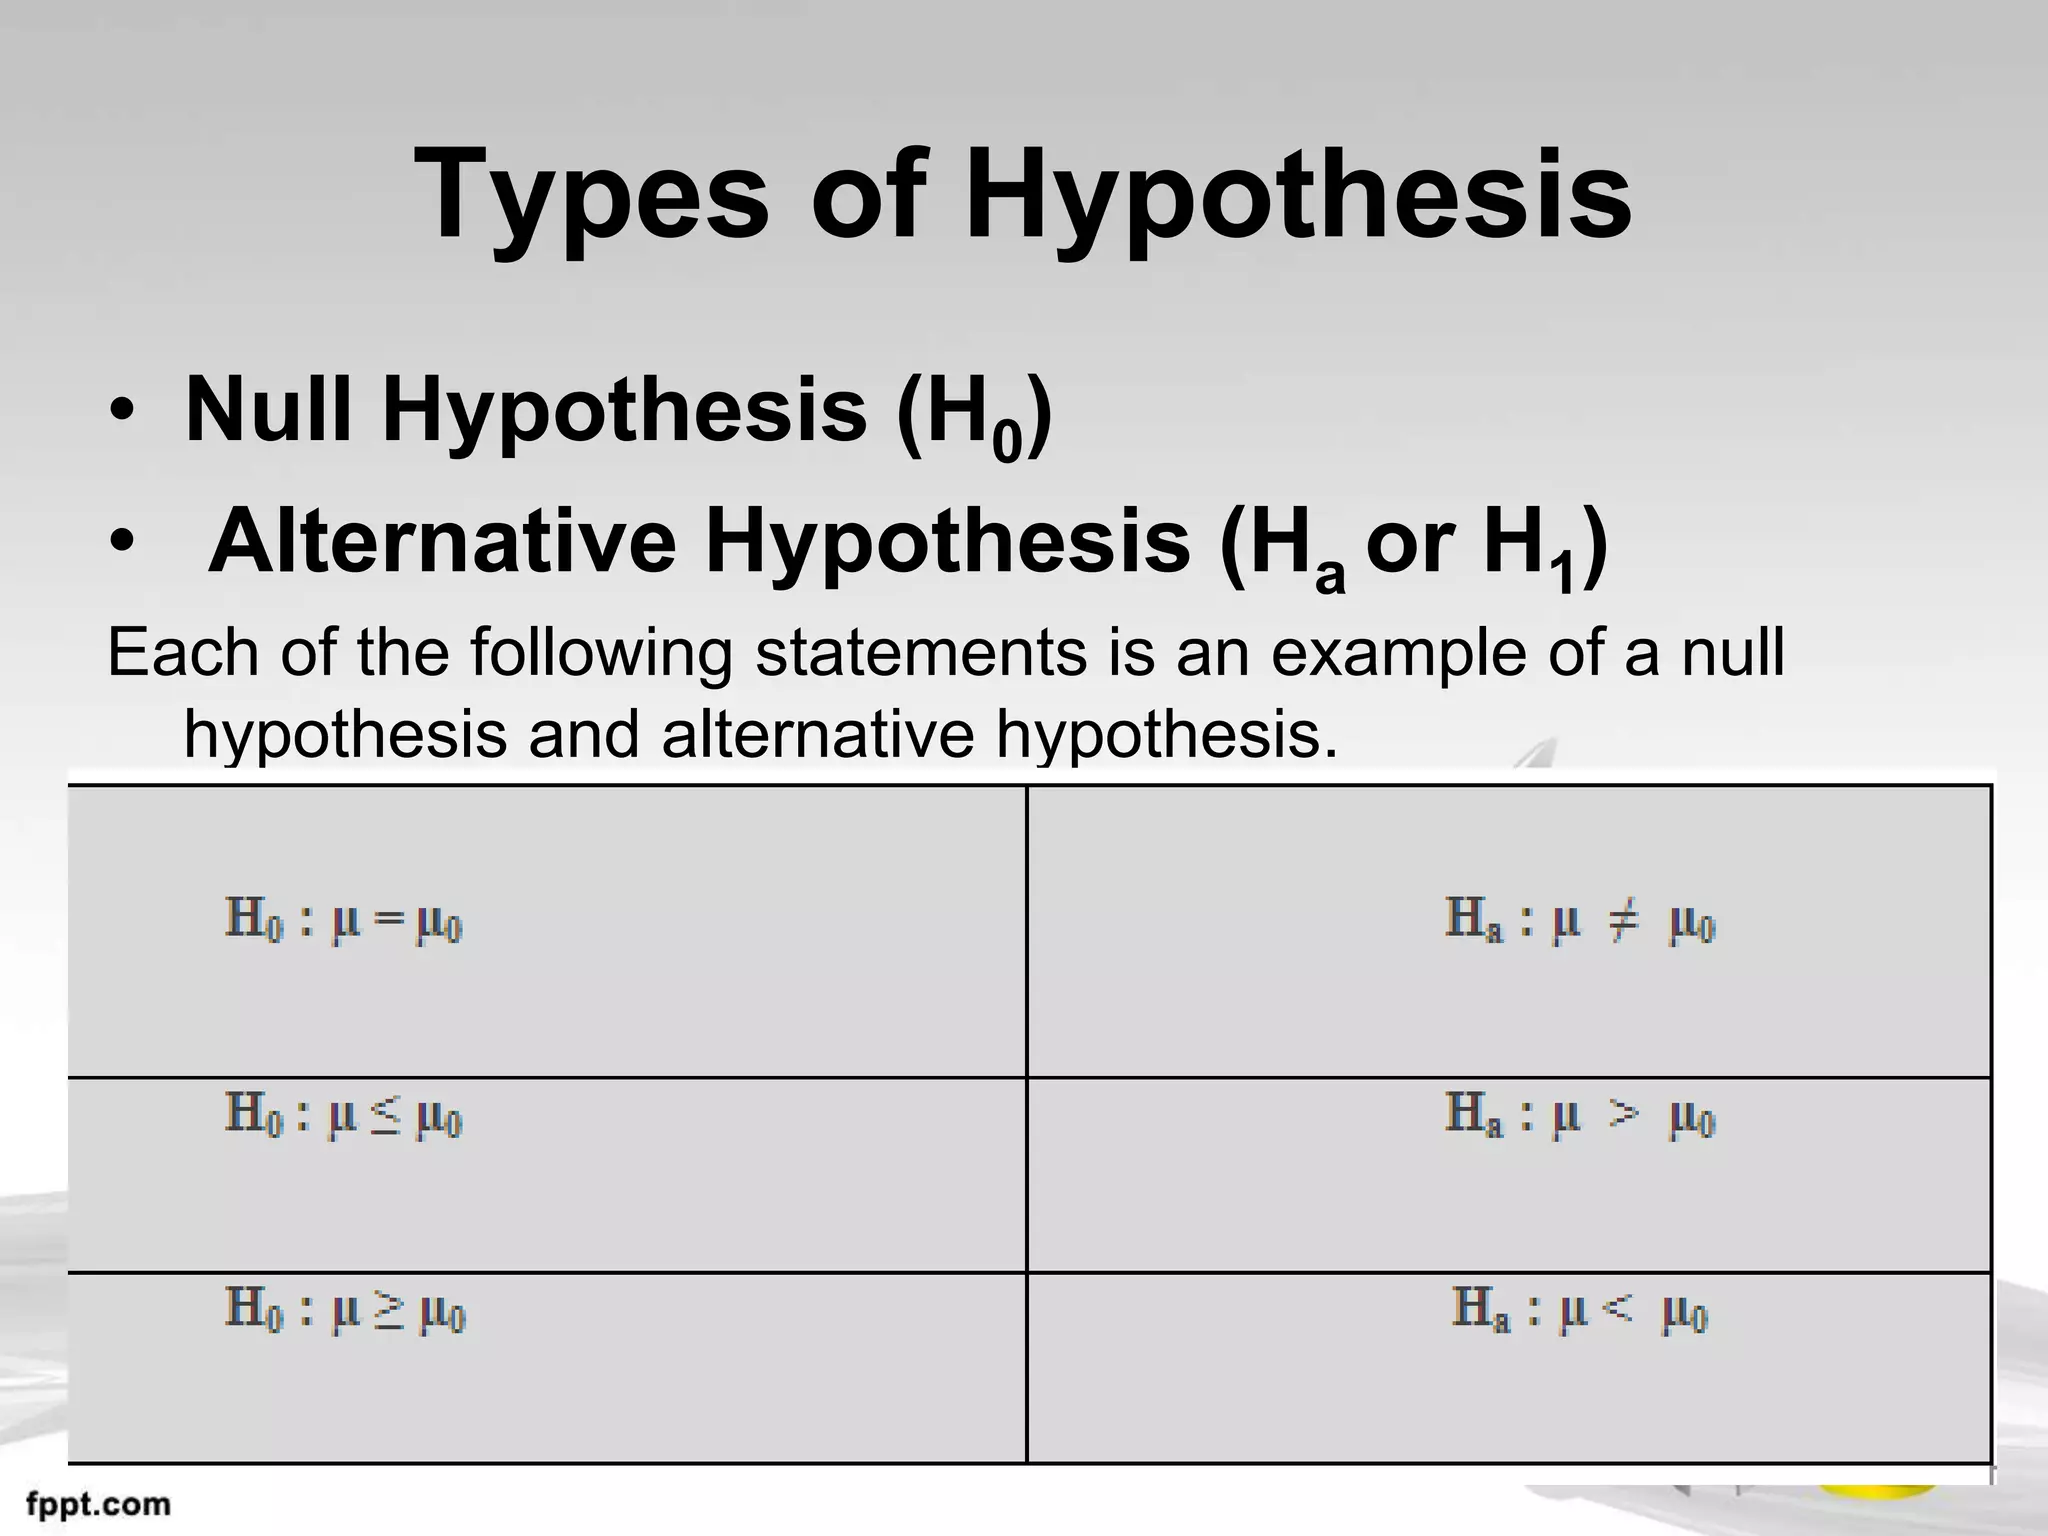
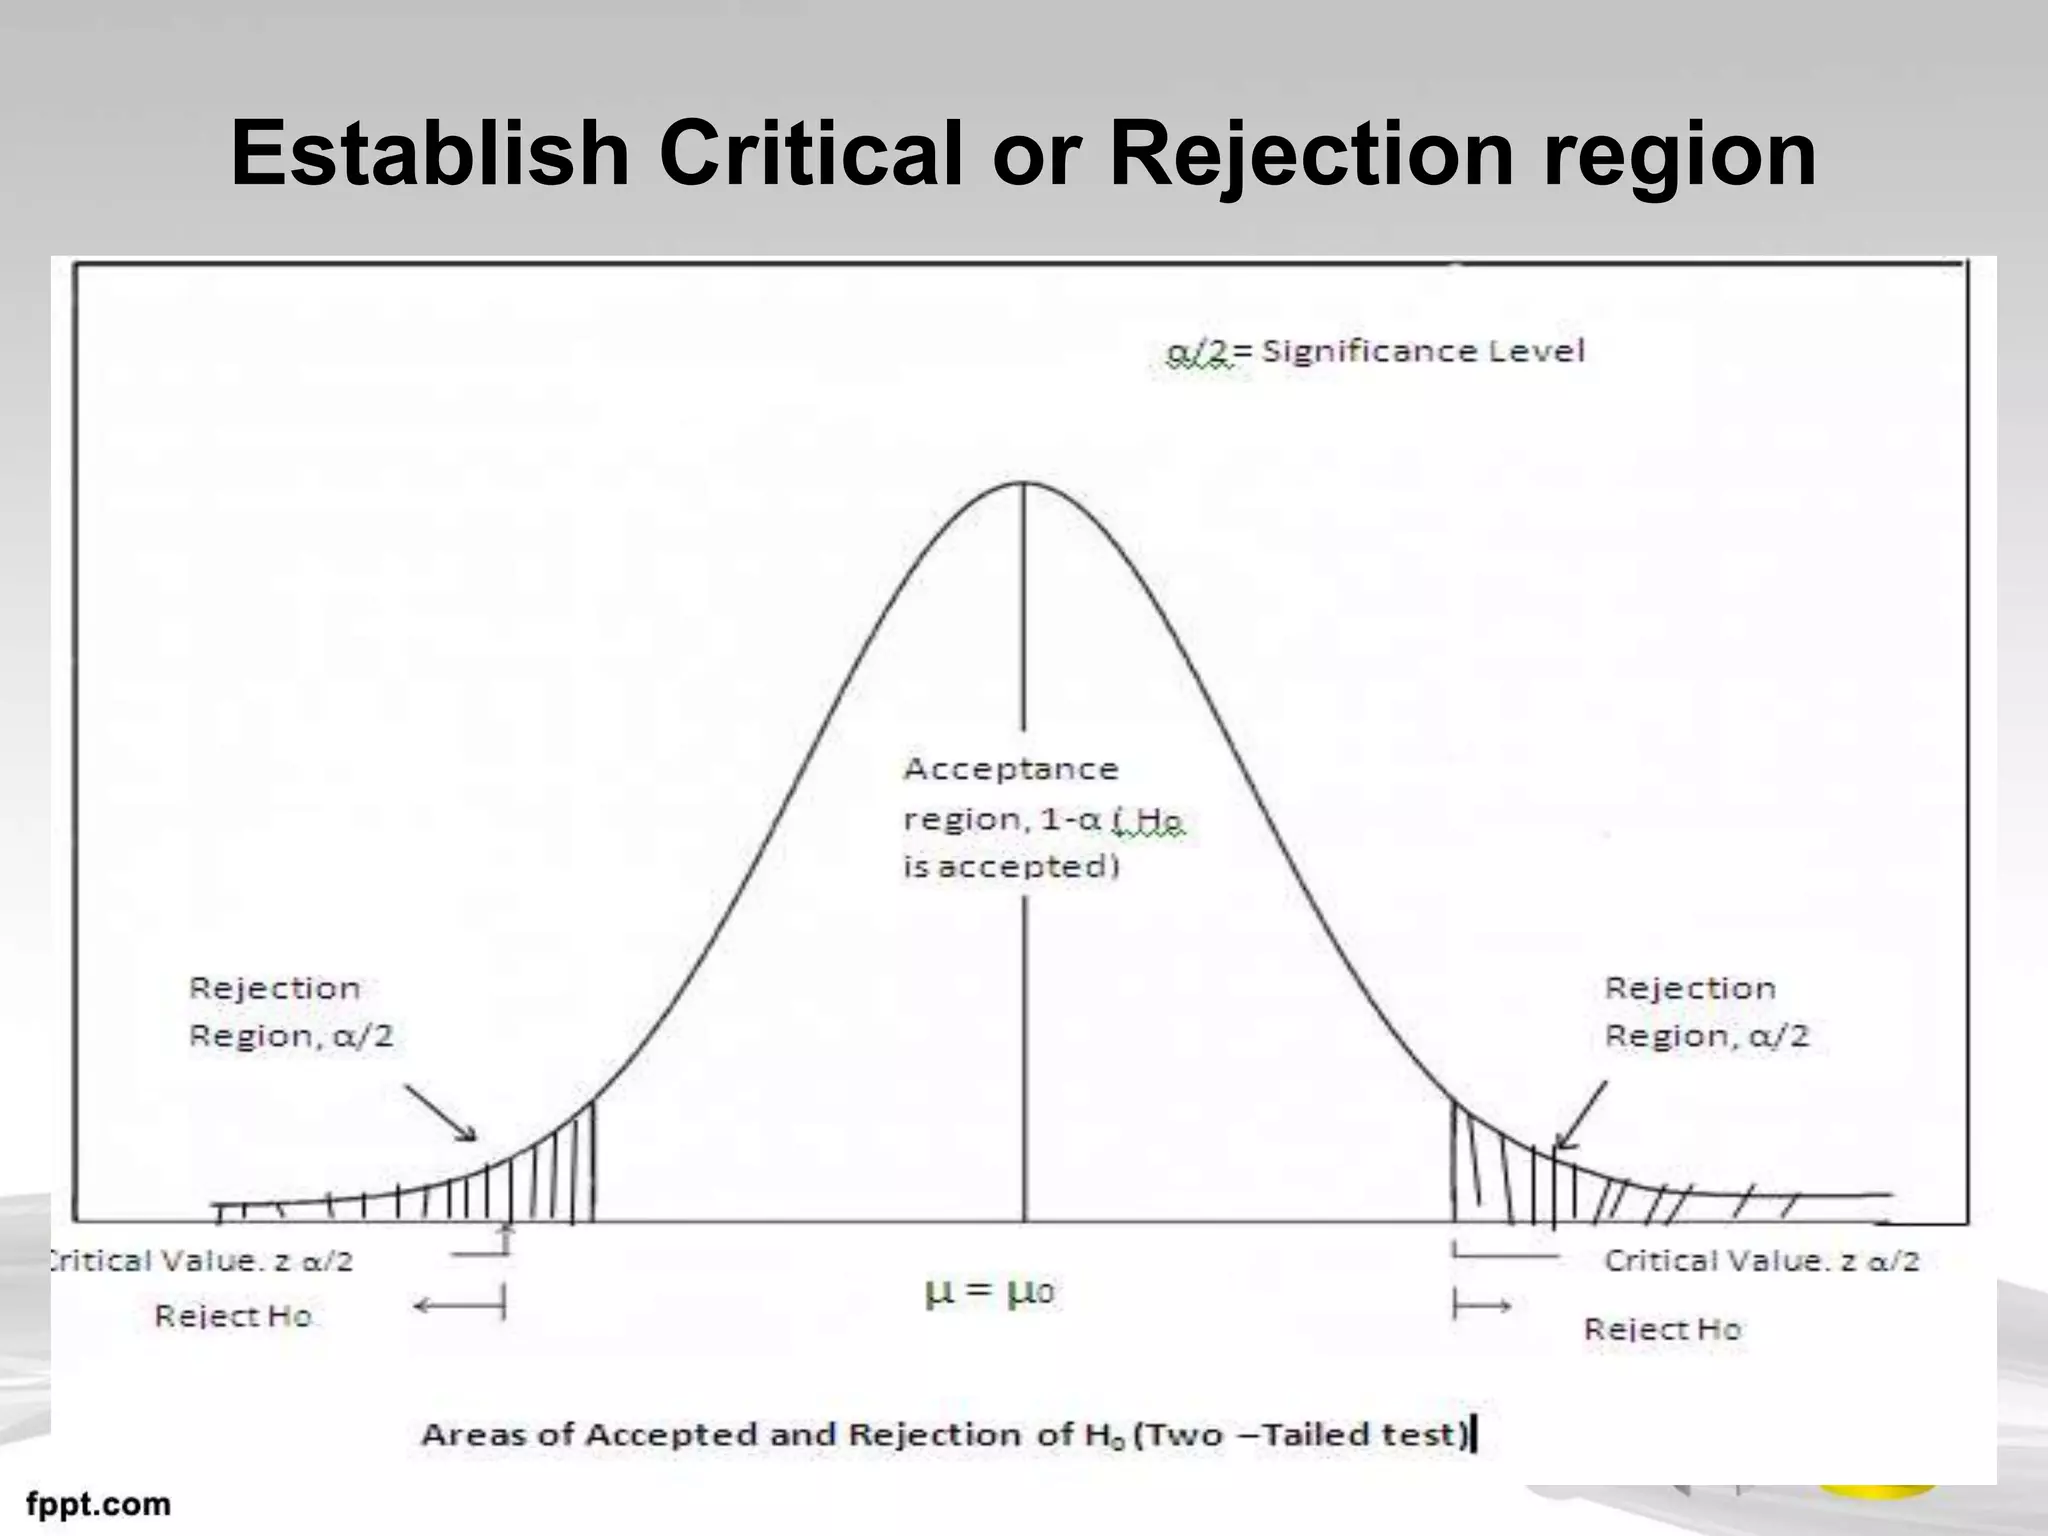
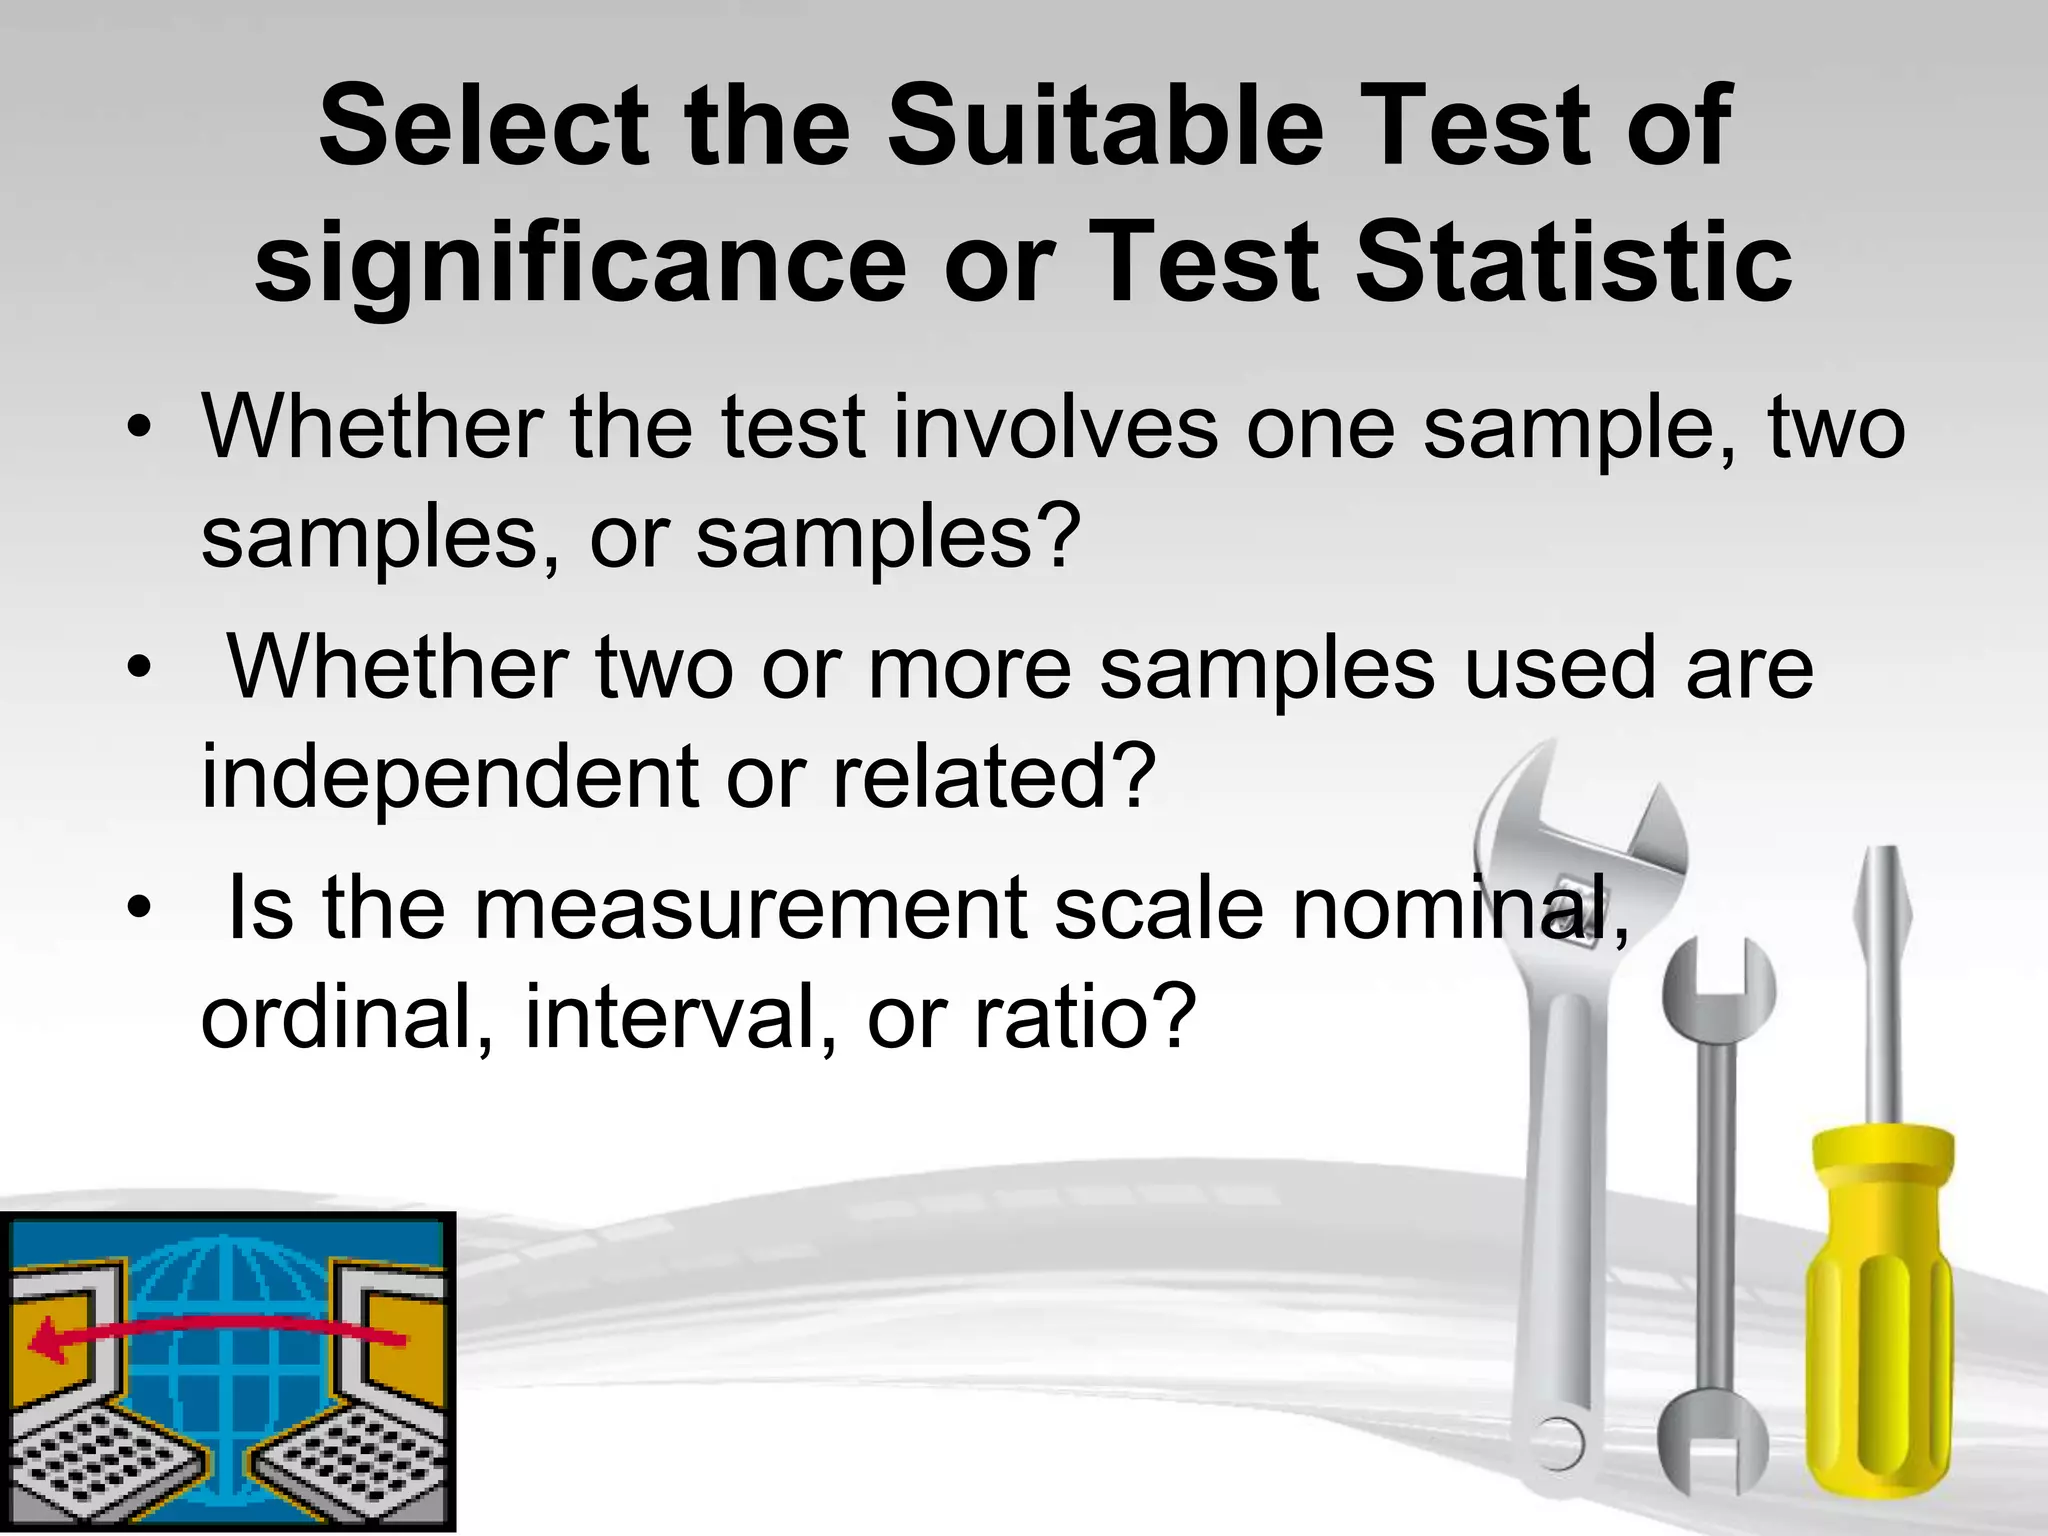
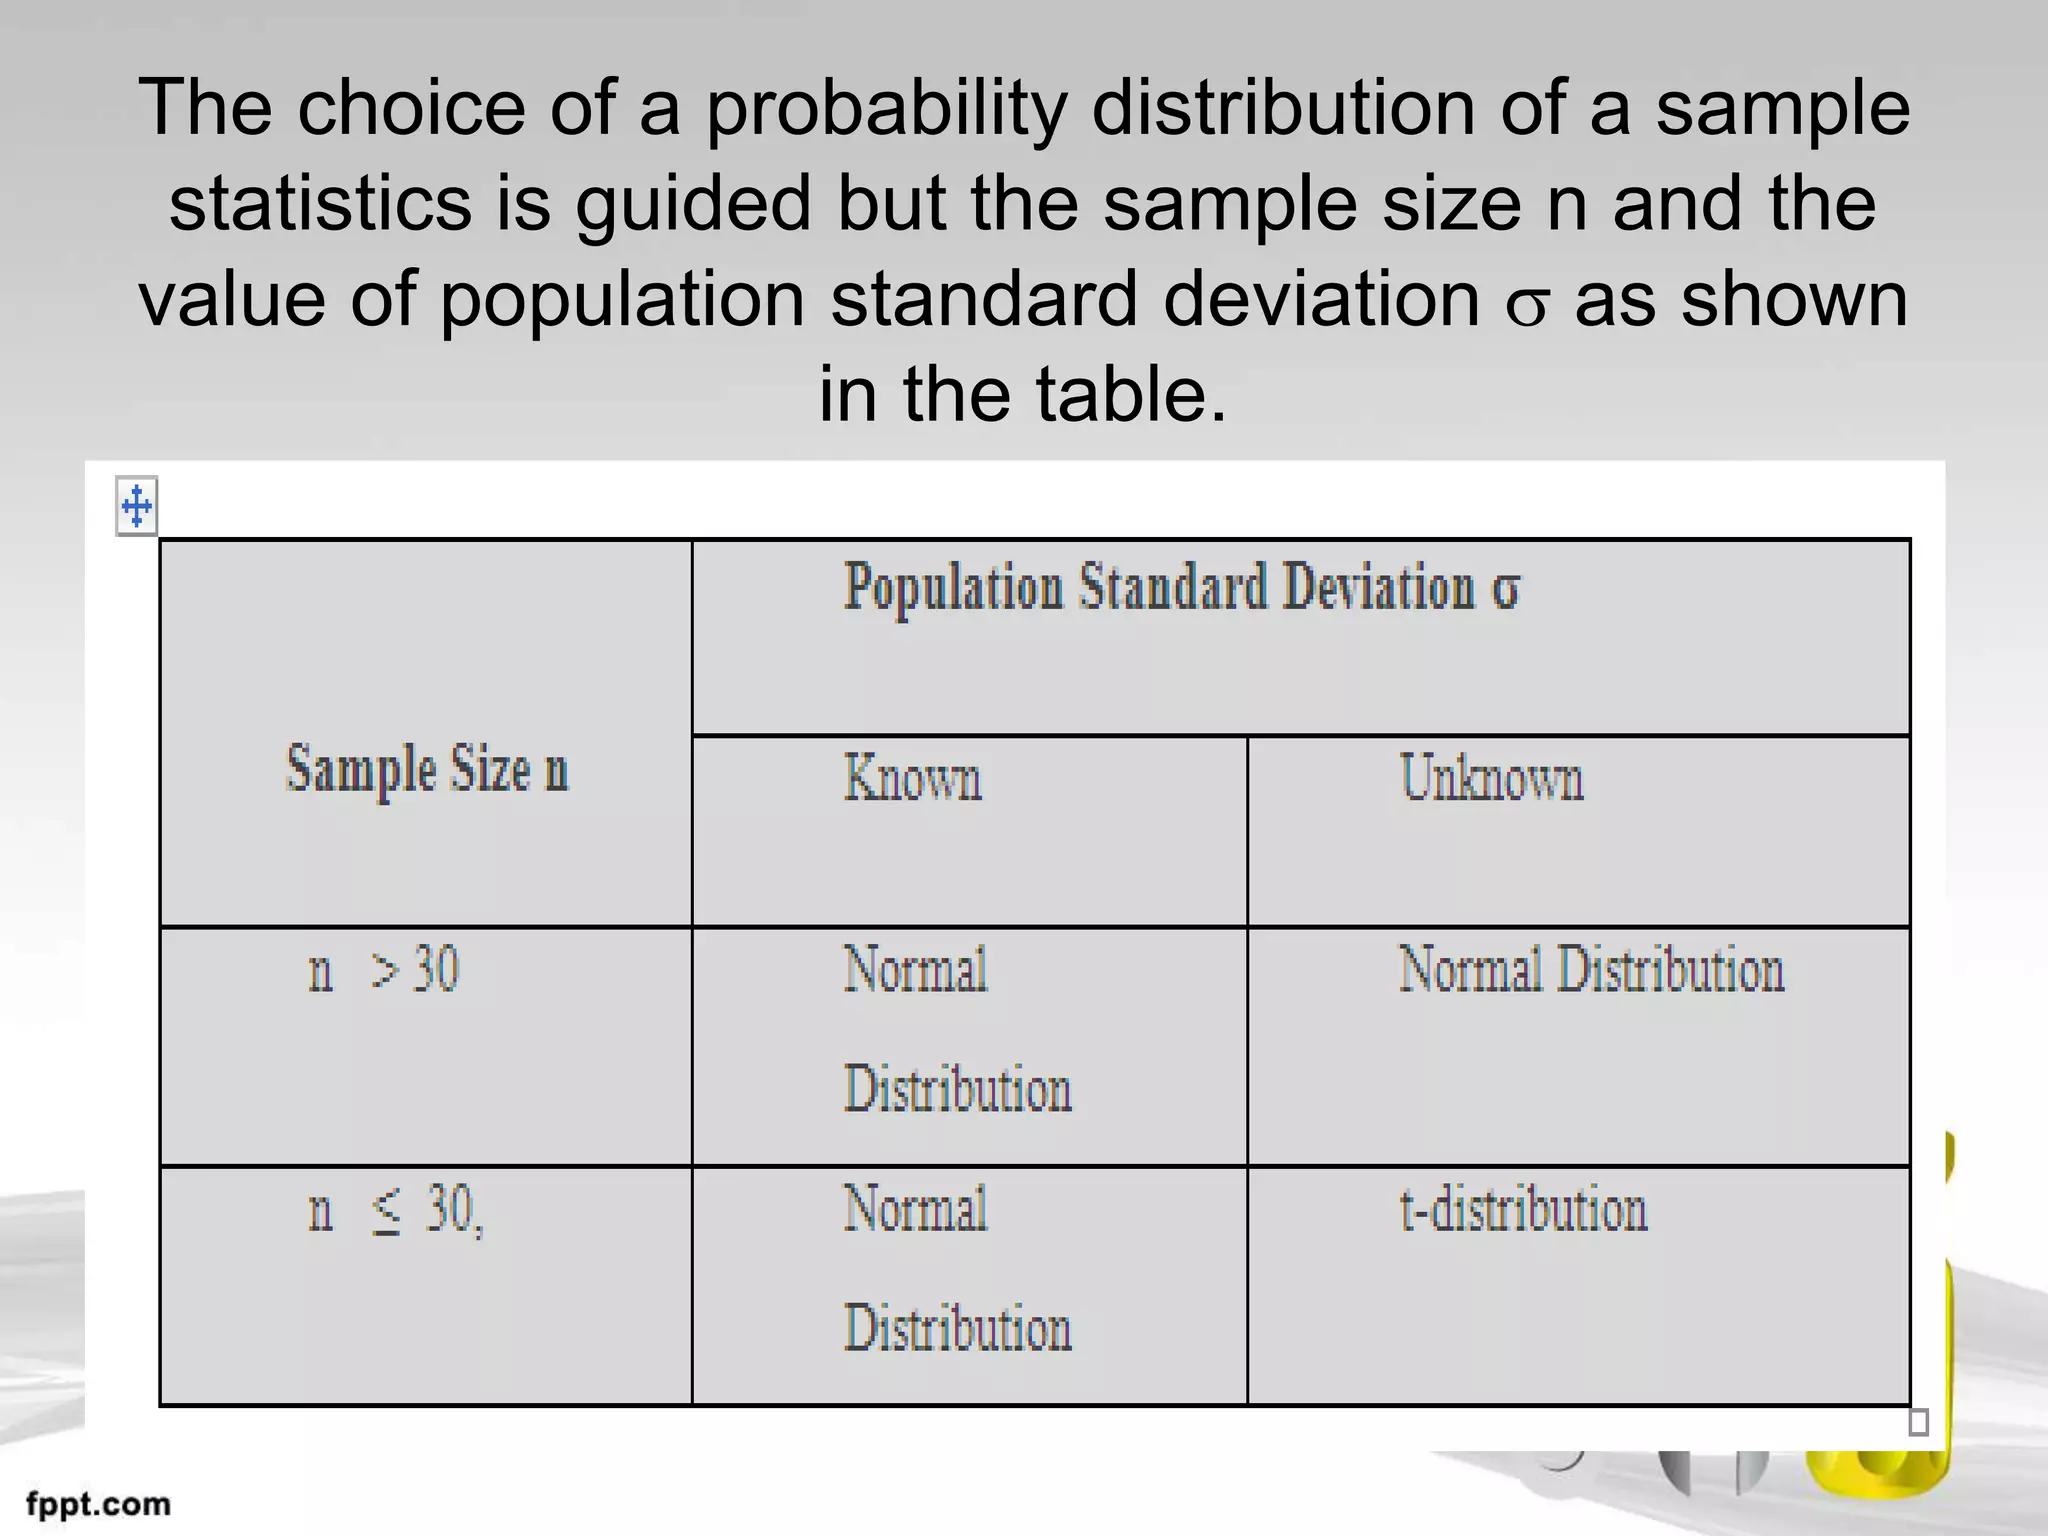
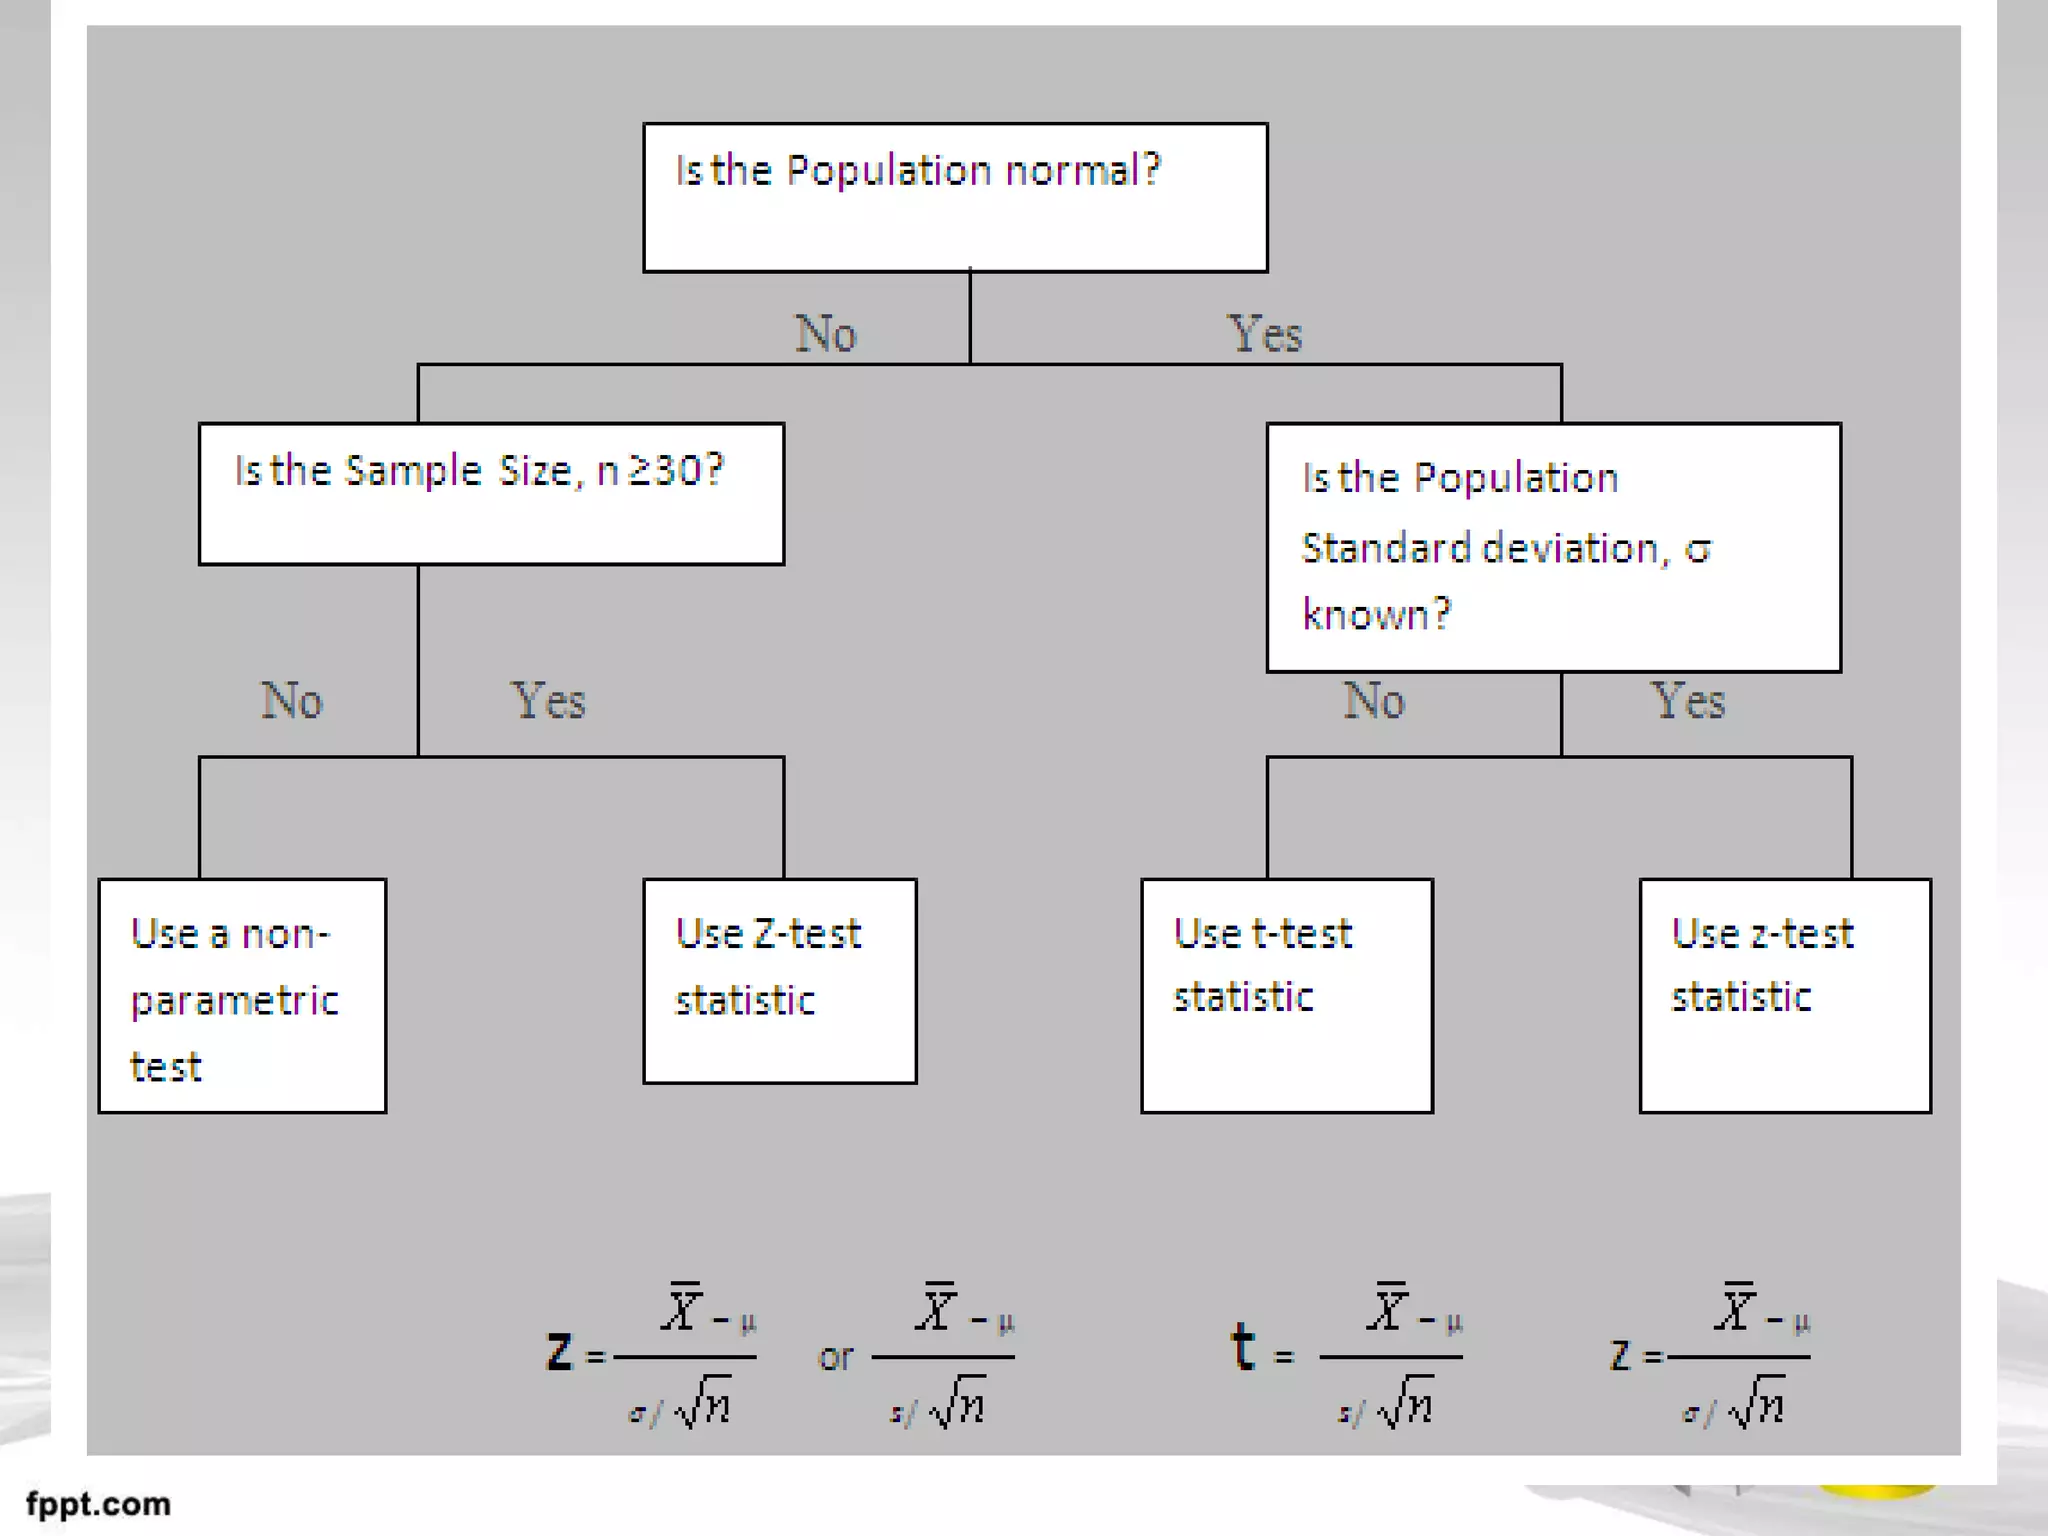
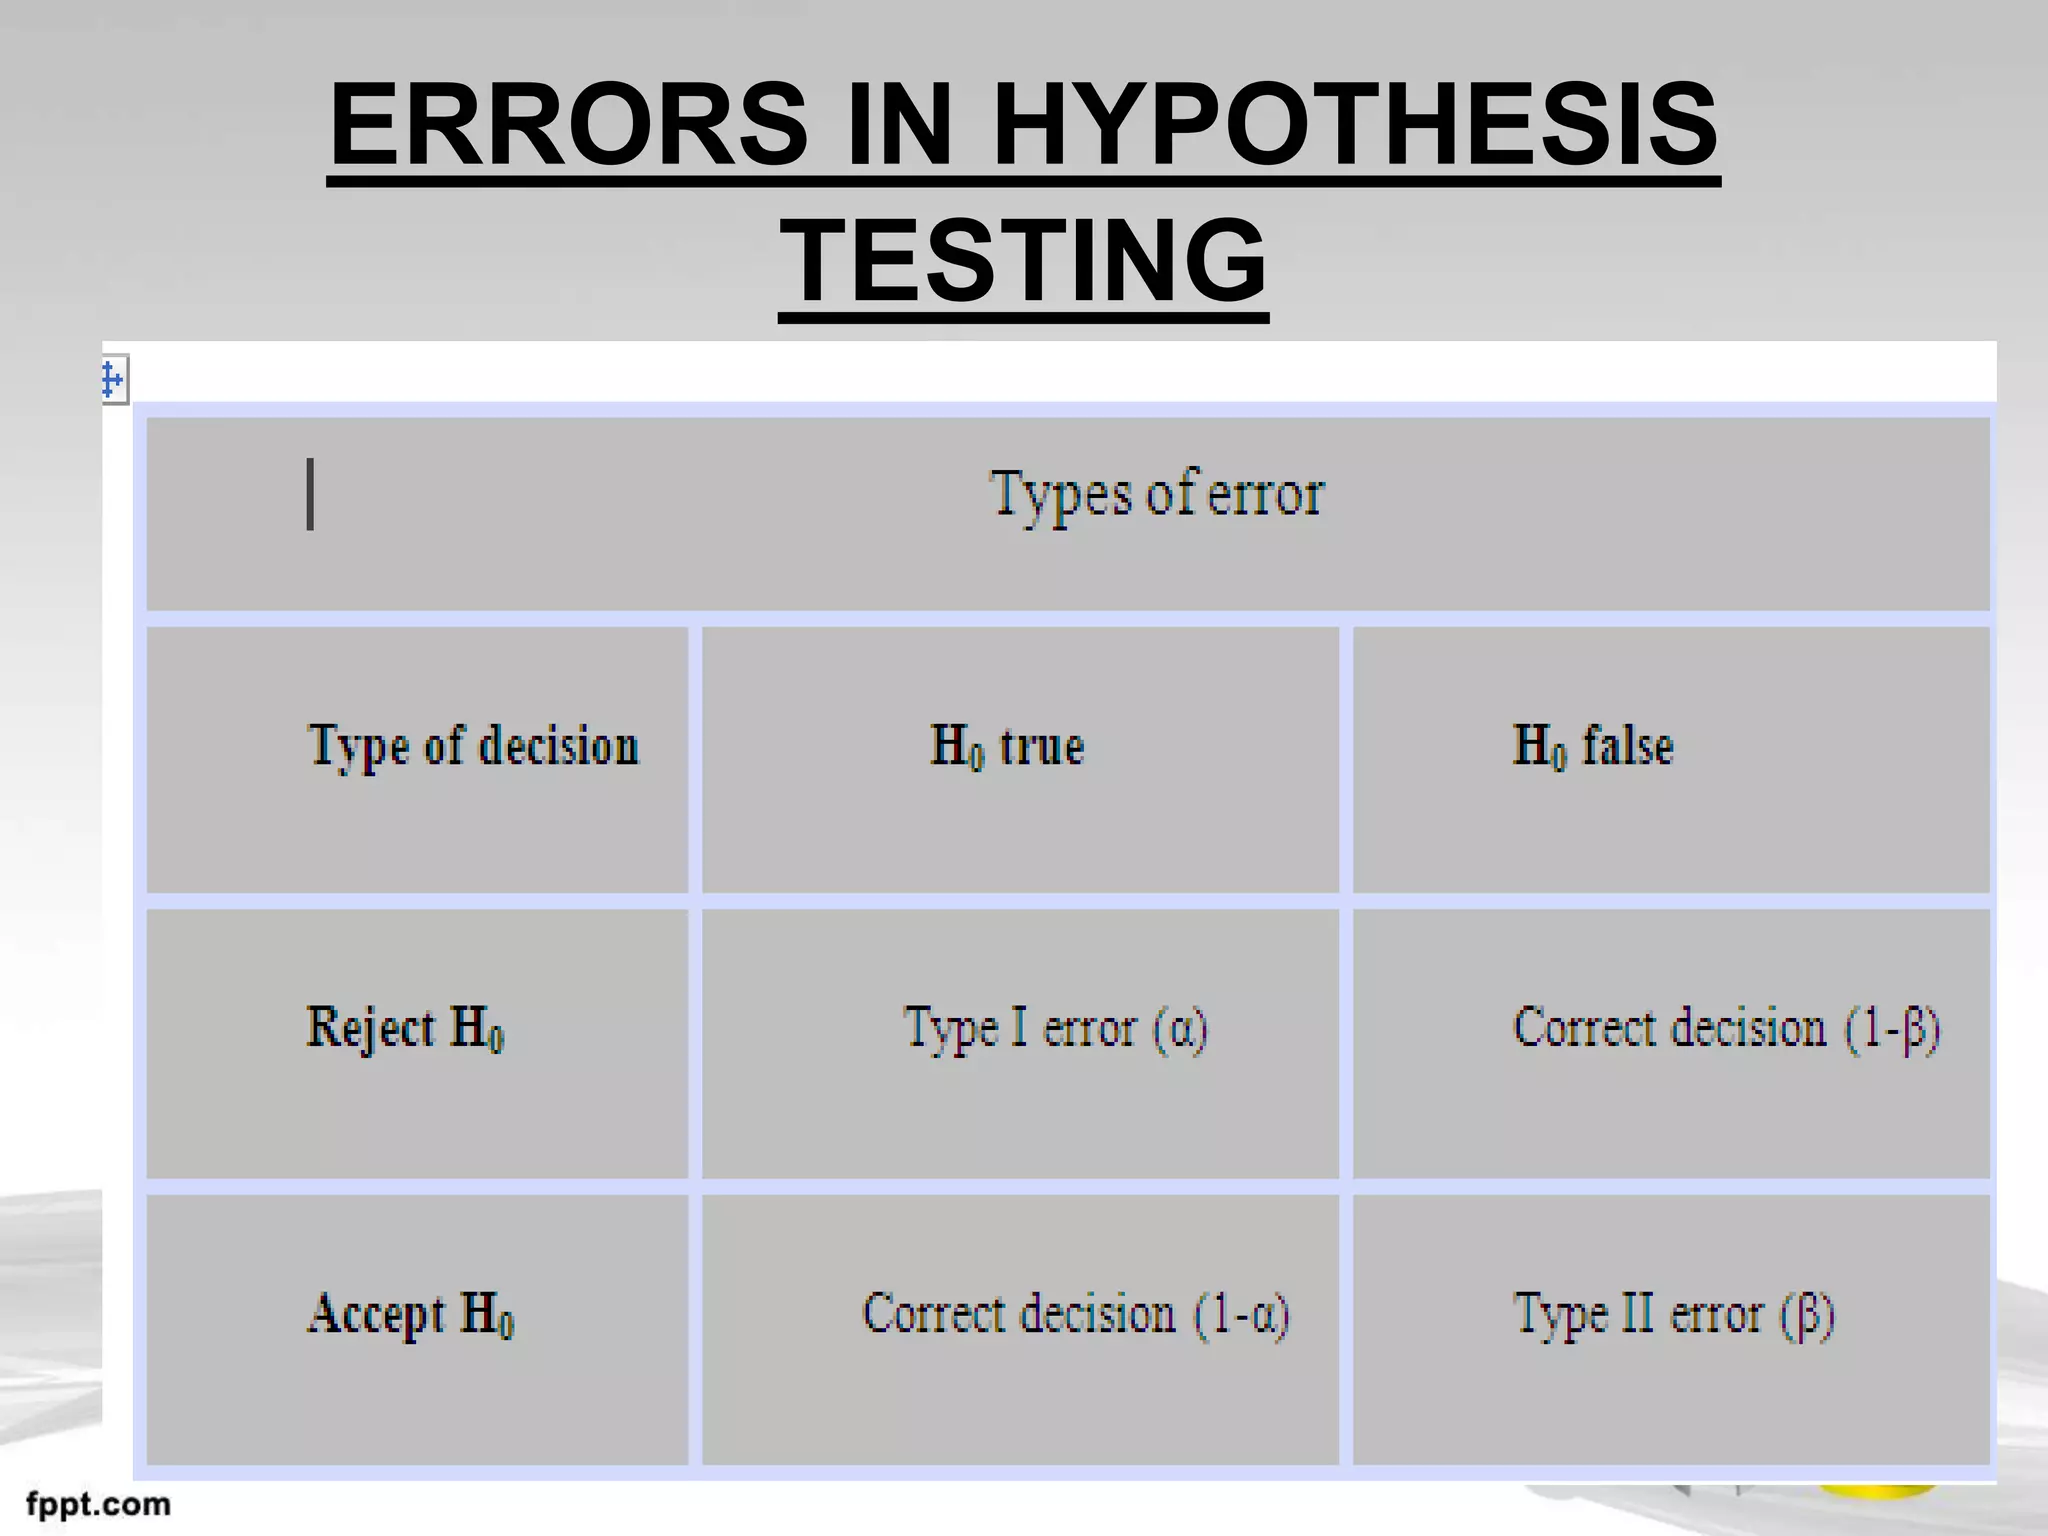
This document discusses hypothesis testing, which is a method in inferential statistics used to make judgments about the probability of observed differences between groups occurring by chance. There are two main steps in hypothesis testing: establishing a null hypothesis (H0) and an alternative hypothesis (Ha or H1), and selecting a suitable test of significance or test statistic based on factors like the number and independence of samples. The test statistic is then compared to a critical or rejection region determined beforehand to either accept or reject the null hypothesis. Types of errors that can occur in hypothesis testing are also discussed.
This is me Sonia Azam from university of the Punjab. this presentation is knowledgeable for all those students whose field related to Research, engineering or business. So enjoy my Presentation Dear fellows!
God Bless you All !!!!
This is me Sonia Azam from university of the Punjab. this presentation is knowledgeable for all those students whose field related to Research, engineering or business. So enjoy my Presentation Dear fellows!
God Bless you All !!!!
hypothesis-Meaning need for hypothesis qualities of good hypothesis type of hypothesis null and alternative hypothesis sources of hypothesis formulation of hypothesis, hypothesis testing
The error (or disturbance) of an observed value is the deviation of the observed value from the (unobservable) true value of a quantity of interest (for example, a population mean), and the residual of an observed value is the difference between the observed value and the estimated value of the quantity of interest (for example, a sample mean).
Suppose there is a series of observations from a univariate distribution and we want to estimate the mean of that distribution (the so-called location model). In this case, the errors are the deviations of the observations from the population mean, while the residuals are the deviations of the observations from the sample mean.
A statistical error (or disturbance) is the amount by which an observation differs from its expected value, the latter being based on the whole population from which the statistical unit was chosen randomly. For example, if the mean height in a population of 21-year-old men is 1.75 meters, and one randomly chosen man is 1.80 meters tall, then the "error" is 0.05 meters; if the randomly chosen man is 1.70 meters tall, then the "error" is −0.05 meters. The expected value, being the mean of the entire population, is typically not observable, and hence the statistical error cannot be observed either.
Hypothesis Testing. Inferential Statistics pt. 2John Labrador
A hypothesis test is a statistical test that is used to determine whether there is enough evidence in a sample of data to infer that a certain condition is true for the entire population. A hypothesis test examines two opposing hypotheses about a population: the null hypothesis and the alternative hypothesis.
Test statistic
General Formula for Test Statistic
Statistical Decision
Significance Level
p-values
Purpose of Hypothesis Testing
General Procedure of Testing a Hypothesis
tests of significance in periodontics aspect, tests of significance with common examples, tests in brief, null hypothesis, parametric vs non parametric tests, seminar by sai lakshmi
2. Inferential Statistics
• Inferential statistics to make judgments of
the probability that an observed difference
between groups is a dependable one or
one that might have happened by chance.
3. There are two main methods
used in inferential statistics:
• Estimation &
• Hypothesis testing
4. What is Hypothesis
• A Hypothesis is the statement or an
assumption about relationships between
variables.
or
• A Hypothesis is a tentative explanation for
certain behaviors, phenomenon or events
that have occurred or will occur.
5. Interesting Hypothesis
• Bankers assumed high-income earners
are more profitable than low-income
earners.
• Old clients were more likely to diminish CD
balances by large amounts compared to
younger clients.
This was nonintrusive because
conventional wisdom suggested that older
clients have a larger portfolio of assets
and seek less risky investments
6. Criteria for Hypothesis
Construction
• It should be empirically testable, whether it
is right or wrong.
• It should be specific and precise.
• The statements in the hypothesis should
not be contradictory.
• It should specify variables between which
the relationship is to be established.
• It should describe one issue only.
8. Types of Hypothesis
• Null Hypothesis (H0)
• Alternative Hypothesis (Ha or H1)
Each of the following statements is an example of a null
hypothesis and alternative hypothesis.
10. Select the Suitable Test of
significance or Test Statistic
• Whether the test involves one sample, two
samples, or samples?
• Whether two or more samples used are
independent or related?
• Is the measurement scale nominal,
ordinal, interval, or ratio?
11. The choice of a probability distribution of a sample
statistics is guided but the sample size n and the
value of population standard deviation as shown
in the table.
12.
13. Formulate a Decision Rule to
Accept Null Hypothesis
• Accept H0 if the test statistic value falls
within the area of acceptance.
• Reject otherwise.