The interim report summarizes the company's Q3 2011 results. Key points include:
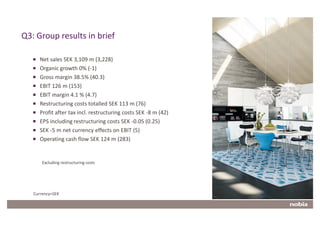
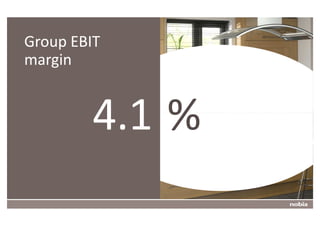
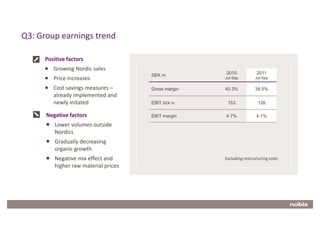
- Organic growth was flat at 0% compared to -1% in Q3 2010. EBIT margin declined to 4.1% from 4.7% due to restructuring costs and lower volumes outside Nordic regions.
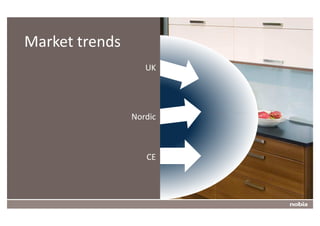
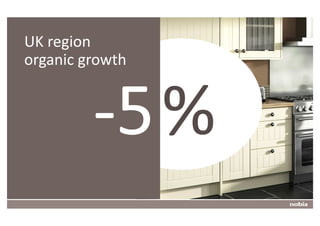
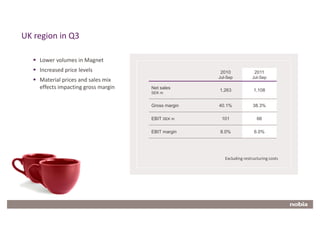
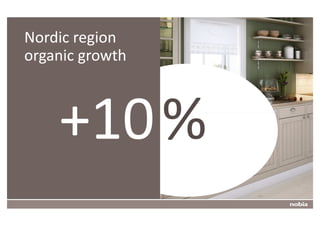
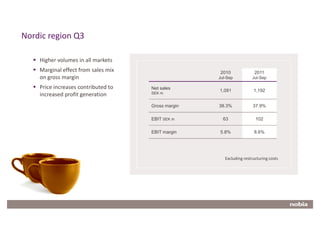
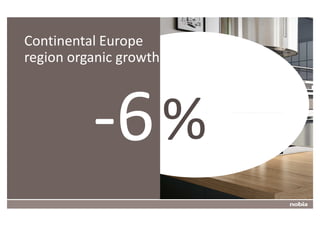
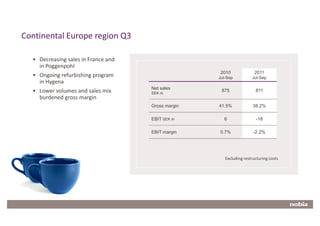
- The Nordic region saw 10% organic growth and increased profitability. However, the UK and Continental Europe regions experienced lower volumes and sales mix issues impacting margins.
- Restructuring costs totaled SEK 113m for the quarter. Excluding these, EBIT declined to SEK 126m from SEK 153m in Q3 2010.
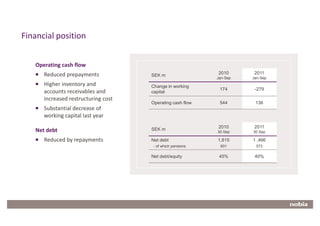
- Net debt


![q2_2010_en[1].pdf](https://cdn.slidesharecdn.com/ss_thumbnails/q2-2010-en-5b1-5d-120322141401-phpapp02-thumbnail.jpg?width=640&height=640&fit=bounds)


