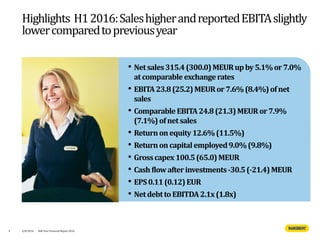
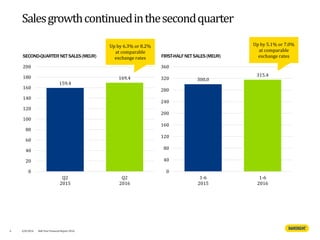
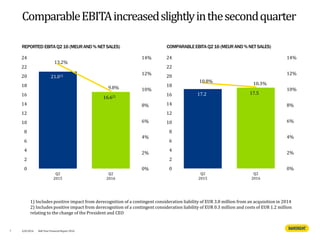
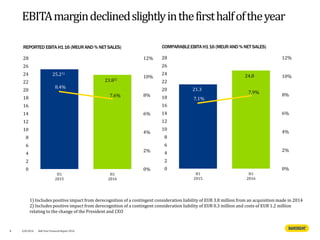
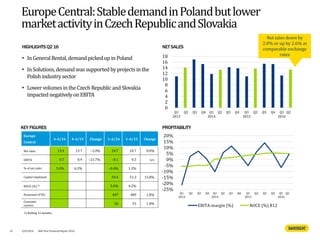
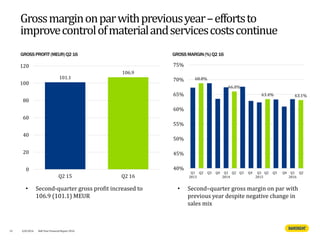
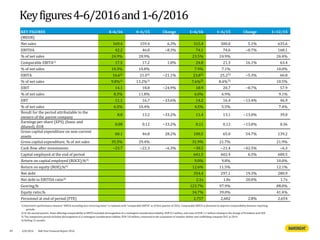
- Net sales and comparable EBITA increased slightly in the first half of 2016 compared to the previous year. Net sales grew by 5.1% to 315.4 MEUR and comparable EBITA grew by 3.5 MEUR to 24.8 MEUR.
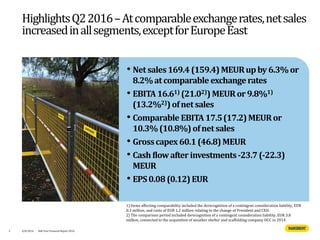
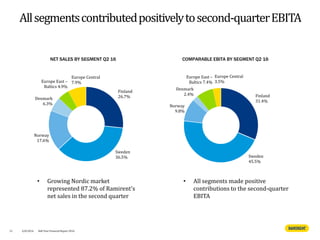
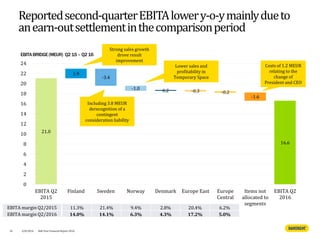
- Sales growth continued in the second quarter, with net sales up 6.3% to 169.4 MEUR compared to Q2 2015. Comparable EBITA increased slightly to 17.5 MEUR.
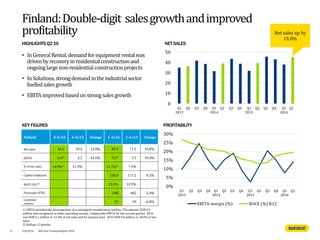
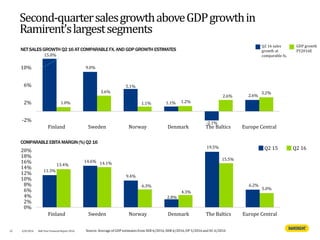
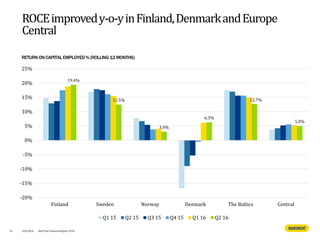
- By segment, Finland saw double-digit sales growth and improved profitability in Q2. Sweden had sales growth of 9.3% but lower comparable EBITA due to relocation costs and credit losses. Norway