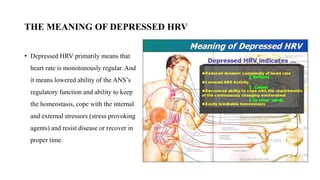
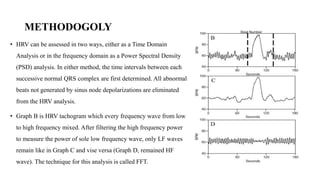
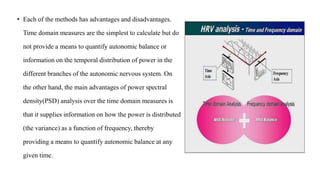
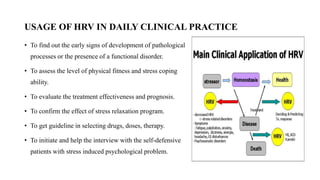
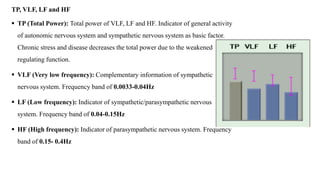
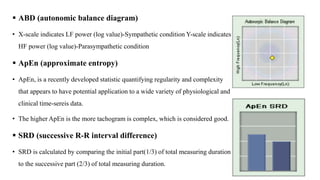
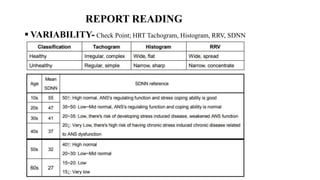
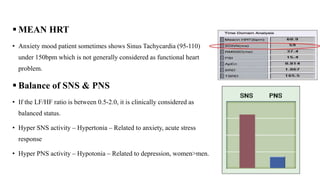
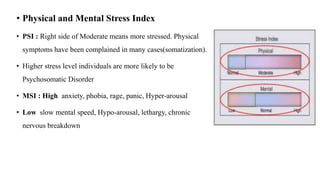
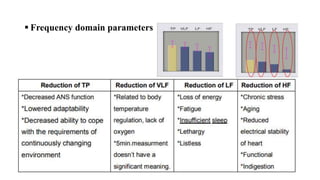
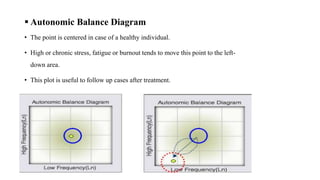
HEART RATE VARIABILITY
By:
Dr. Shailendra Kumar Tyagi
Postgraduate Student
Department of Physiology
Government Medical College Kota
Kota
Guide:
Dr. Umesh Kumar
Prof. and Head
Department of Physiology
Government Medical College Kota
Kota
DEFINITION
• HRV, heart rate variability is the degree of fluctuation in
the length of the intervals between heart beats. (Malik &
Camm, 1995)
• Regularity of heartbeats is derived from a quantity of
numbers; equal to the times elapsed between successive
heartbeats. They are named R - R intervals and are
measured in millisecond (ms).
• R-R intervals are obtained from ECG or plethysmogram.
GENERATION OF HRV
• The intrinsic heart rate (HR) generated by the sinoatrial
node (SA node) in the absence of any neural or
hormonal influence is about 100 to 120 beats per minute
(BPM).
• However in healthy individual resting HR would never
be that high. In a health individual(adult), the HR is
ranging between 60 and 90 beats per minute(BPM) and
the HR estimated at any given time represents the net
effect of the parasympathetic (vagus) nerves, which slow
HR, and the sympathetic nerves, which accelerate it.
• The physiological origins of HRV are the fluctuations of the activity of cardiovascular
vasoconstrictory and vasodilatatory centers in brain. Normally these fluctuations are a result of
blood pressure oscillation (baroreflex modulated); respiration; thermoregulation and circadian
biorhythm. All these factors can influence the length of beat-to-beat intervals, named R-R
intervals
• The variability in HR is due to the synergistic action of the two branches of the autonomic
nervous system which acts in balance through neural, mechanical, humoral and other
cardiovascular parameters in their optimal ranges and to react optimally to changing external
or internal conditions.
STRESS AND AUTOMNOMIC NERVOUS SYSTEM
• When the body is challenged by almost anything that happens to us, the brain activates the
autonomic nervous system (ANS), the involuntary system of nerves which controls and stimulates
the output of two hormones, cortisol from the adrenal cortex and adrenalin from the adrenal
medulla.
• These two hormones and the activity of the ANS help us cope: the ANS and the adrenalin keep us
alert by increasing our heart rate and blood pressure and quickly mobilizing energy reserves.
• In contrast, cortisol works more slowly, helps replenish energy supplies and, at the same time,
helps us to remember important things. For example, cortisol readies our immune system to handle
any threat -- bacterial/viral or injury.
THE MEANING OF DEPRESSED HRV
• Depressed HRV primarily means that
heart rate is monotonously regular. And
it means lowered ability of the ANS’s
regulatory function and ability to keep
the homeostasis, cope with the internal
and external stressors (stress provoking
agents) and resist disease or recover in
proper time.
METHODOLOGYAND TERMINOLOGY
OF HRV ANALYSIS
METHODOGOLY
• HRV can be assessed in two ways, either as a Time Domain
Analysis or in the frequency domain as a Power Spectral Density
(PSD) analysis. In either method, the time intervals between each
successive normal QRS complex are first determined. All abnormal
beats not generated by sinus node depolarizations are eliminated
from the HRV analysis.
• Graph B is HRV tachogram which every frequency wave from low
to high frequency mixed. After filtering the high frequency power
to measure the power of sole low frequency wave, only LF waves
remain like in Graph C and vise versa (Graph D, remained HF
wave). The technique for this analysis is called FFT.
• Each of the methods has advantages and disadvantages.
Time domain measures are the simplest to calculate but do
not provide a means to quantify autonomic balance or
information on the temporal distribution of power in the
different branches of the autonomic nervous system. On
the other hand, the main advantages of power spectral
density(PSD) analysis over the time domain measures is
that it supplies information on how the power is distributed
(the variance) as a function of frequency, thereby
providing a means to quantify autonomic balance at any
given time.
TIME DOMAIN PARAMETERS
• Time domain measures are the simplest to calculate and include the mean normal-to-normal (NN) intervals
during the entire recording and statistical measures of the variance between NN intervals.
• A Variance is mathematically equivalent to the total power of spectral analysis, so it reflects all cyclic
components `of the variability in recorded series of NN intervals.
 MEAN HRT (BPM) is the average heart rate during 5 minutes.
 SDNN (MS)
• SDNN is a standard deviation of the NN intervals, which is the square root of their variance. The actual values
of SDNN depend on the length of recording - the longer recording is, the higher SDNN values are.
 SDNN Index (MS)
• SSSDNN Index is the mean of the standard of all the normal RR intervals of the standard
deviations of all the normal RR intervals for each 5-minute segment of a 24- hour ECG recording.
• The Index is believed to be a measure primarily of autonomic influence on heart rate variability.
 RMS-SD (MS)
• RMS-SD is the square root of the mean squared differences of successive NN intervals. This
measure estimate high-frequency variations in heart rate in short-term NN recordings that reflects
an estimate of parasympathetic regulation of the heart.
 PSI (Physical Stress index ) NO SCALE
• PSI reflects the load and pressure to your heart based on SDNN and HRT at the same time.
 APEN (Approximate entropy ) NO SCALE
• A recently developed statistic quantifying regularity and complexity that appears to have potential
application to a wide variety of physiological and clinical time-sereis data. The higher ApEn is the more
tachogram is complex, which is considered good.
 SRD (Successive R-R interval Difference ) NO SCALE
• SRD is calculated by comparing the initial part (1/3) of total measuring duration to the successive part
(2/3) of total measuring duration. The value 1(full scale) is the ideal state that means the measurement was
done under constant status.
 TSRD (Total Successive RR interval Difference during 5min measurement)
• It is used when the same patient exam more than twice in different condition of the same condition to
compare the result influenced by the condition change or to confirm that the test condition was similar.
FREQUENCY DOMAIN PARAMETERS
 Total Power (TP) (MS 2) 0-0.4HZ
• Total Power is a short-term estimate of the total power of power spectral density .
• This measure reflects overall autonomic activity where sympathetic activity is a primary
contributor.
 Very Low Frequency (VLF) (MS 2) 0-0.04 HZ
• Very Low Frequency indicates overall activity of various slow mechanisms of sympathetic
function.
Low Frequency (LF) (MS 2) 0.04-0.15HZ
• Low Frequency reflects both sympathetic and para-sympathetic activity.
• Generally it is a strong indicator of sympathetic activity
 High Frequency (HF) (MS 2) 0.15-0.4 HZ
• High Frequency reflects parasympathetic (vagal) activity.
• HF is also known as a ‘respiratory’ band because it corresponds to the NN variations caused by
respiration (this phenomena is known as respiratory sinus arrhythmia (RSA)).
• Heart rate is increased during inhalation and dropped during exhalation.
 LF/HF Ratio
• This measure indicates overall balance between sympathetic and parasympathetic systems.
• Higher values reflect domination of the sympathetic system, while lower ones - domination of the
parasympathetic system.
Normalized Low Frequency (LF Norm) & High Frequency (HF Norm)
• Normalized Low Frequency is the ratio between absolute value of the Low Frequency and difference
between Total Power and Very Low Frequency. Normalized LF is calculated in percentile units.
• LF norm= LF/(TP-VLF)*100= LF/(LF+HF)*100
• Normalized High Frequency is the ratio between absolute value of the High Frequency and difference
between Total Power and Very Low Frequency. Normalized HF is calculated in percentile units.
• HF norm= HF/(TP-VLF)*100= HF/(LF+HF)*100
• This emphasizes the balance between the sympathetic and parasympathetic arms of the
ANS.
USAGE OF HRV IN DAILY CLINICAL PRACTICE
• To find out the early signs of development of pathological
processes or the presence of a functional disorder.
• To assess the level of physical fitness and stress coping
ability.
• To evaluate the treatment effectiveness and prognosis.
• To confirm the effect of stress relaxation program.
• To get guideline in selecting drugs, doses, therapy.
• To initiate and help the interview with the self-defensive
patients with stress induced psychological problem.
Cautions for accurate measurement & analysis
 Environmental requirement
• Please try to keep the measurement time since the HRV is known to have circadian rhythm due to changing of
ANS balance (morning/evening).
• The appropriate environment: Avoid too bright light or noise Maintain proper room temperature.
 Before the measurement
• Avoid caffeine, smoking at least 2 hours before the measurement.
• Avoid the measurement right after the meal (2 hours after the meal).
• Time for patient to adjust the new environment and resting state is needed.
• Remove the manicure while being measured with finger sensor.
 During the measurement
• Maintain comfortable sitting position.
• Don’t move or talk.
• Don’t close the eyes or fall asleep.
• Respiration: In normal and resting state. Don’t control the breathing intentionally.
HRV VIEWING SESSION
 HRV Tachogram
• The HRV tachogram presents the fluctuation of heart rate during 5 minutes influenced
by constant ANS regulation on heart.
 Histogram
• In histogram, X-scale indicates RR-interval(ms) while Y scale indicates the number of
heart rate (bpm) recorded. Lowered HRV is likely to draw a histogram with narrow
width and high peak while higher HRV accompanies that with flattish shape without
prominent peak.
 RRV
• RRV indicates RR variation which reflects the variability of the heart rate.
• The more variation that exist in the HRT, the wider the “cloud” (dotted shape) is
displayed. If the heart rate were monotonously regular, the “cloud” would be the shape
of a small and round ball with great density rather than long oval shape with lower
density.
 PSD
• PSD is power spectrum of a 5-minute heart rate variability waveform of
tachogram. PSD analysis information of how power is distributed in each
frequency- section, VLF, LF and HF. X scale indicates frequency (Hz) and Y
scale indicates power (msec2/Hz).
 SNS & PNS
• SNS&PNS reflects the balance of autonomic nervous system.
 Stress Index
• The upper one is physical pressure index reflecting the SDNN and HRT in time
domain.
• The lower one is emotional status comes from the balance between SNS and
PNS.
TP, VLF, LF and HF
 TP (Total Power): Total power of VLF, LF and HF. Indicator of general activity
of autonomic nervous system and sympathetic nervous system as basic factor.
Chronic stress and disease decreases the total power due to the weakened
regulating function.
 VLF (Very low frequency): Complementary information of sympathetic
nervous system. Frequency band of 0.0033-0.04Hz
 LF (Low frequency): Indicator of sympathetic/parasympathetic nervous
system. Frequency band of 0.04-0.15Hz
 HF (High frequency): Indicator of parasympathetic nervous system. Frequency
band of 0.15- 0.4Hz
 ABD (autonomic balance diagram)
• X-scale indicates LF power (log value)-Sympathetic condition Y-scale indicates
HF power (log value)-Parasympathetic condition
 ApEn (approximate entropy)
• ApEn, is a recently developed statistic quantifying regularity and complexity
that appears to have potential application to a wide variety of physiological and
clinical time-sereis data.
• The higher ApEn is the more tachogram is complex, which is considered good.
 SRD (successive R-R interval difference)
• SRD is calculated by comparing the initial part(1/3) of total measuring duration
to the successive part (2/3) of total measuring duration.
REPORT READING
 VARIABILITY- Check Point; HRT Tachogram, Histogram, RRV, SDNN
 MEAN HRT
• Anxiety mood patient sometimes shows Sinus Tachycardia (95-110)
under 150bpm which is not generally considered as functional heart
problem.
 Balance of SNS & PNS
• If the LF/HF ratio is between 0.5-2.0, it is clinically considered as
balanced status.
• Hyper SNS activity – Hypertonia – Related to anxiety, acute stress
response
• Hyper PNS activity – Hypotonia – Related to depression, women>men.
• Physical and Mental Stress Index
• PSI : Right side of Moderate means more stressed. Physical
symptoms have been complained in many cases(somatization).
• Higher stress level individuals are more likely to be
Psychosomatic Disorder
• MSI : High anxiety, phobia, rage, panic, Hyper-arousal
• Low slow mental speed, Hypo-arousal, lethargy, chronic
nervous breakdown
 Frequency domain parameters
 Autonomic Balance Diagram
• The point is centered in case of a healthy individual.
• High or chronic stress, fatigue or burnout tends to move this point to the left-
down area.
• This plot is useful to follow up cases after treatment.

HRV 23.01.2023.pptx

  • 1.
    HEART RATE VARIABILITY By: Dr.Shailendra Kumar Tyagi Postgraduate Student Department of Physiology Government Medical College Kota Kota Guide: Dr. Umesh Kumar Prof. and Head Department of Physiology Government Medical College Kota Kota
  • 2.
    DEFINITION • HRV, heartrate variability is the degree of fluctuation in the length of the intervals between heart beats. (Malik & Camm, 1995) • Regularity of heartbeats is derived from a quantity of numbers; equal to the times elapsed between successive heartbeats. They are named R - R intervals and are measured in millisecond (ms). • R-R intervals are obtained from ECG or plethysmogram.
  • 3.
    GENERATION OF HRV •The intrinsic heart rate (HR) generated by the sinoatrial node (SA node) in the absence of any neural or hormonal influence is about 100 to 120 beats per minute (BPM). • However in healthy individual resting HR would never be that high. In a health individual(adult), the HR is ranging between 60 and 90 beats per minute(BPM) and the HR estimated at any given time represents the net effect of the parasympathetic (vagus) nerves, which slow HR, and the sympathetic nerves, which accelerate it.
  • 4.
    • The physiologicalorigins of HRV are the fluctuations of the activity of cardiovascular vasoconstrictory and vasodilatatory centers in brain. Normally these fluctuations are a result of blood pressure oscillation (baroreflex modulated); respiration; thermoregulation and circadian biorhythm. All these factors can influence the length of beat-to-beat intervals, named R-R intervals • The variability in HR is due to the synergistic action of the two branches of the autonomic nervous system which acts in balance through neural, mechanical, humoral and other cardiovascular parameters in their optimal ranges and to react optimally to changing external or internal conditions.
  • 5.
    STRESS AND AUTOMNOMICNERVOUS SYSTEM • When the body is challenged by almost anything that happens to us, the brain activates the autonomic nervous system (ANS), the involuntary system of nerves which controls and stimulates the output of two hormones, cortisol from the adrenal cortex and adrenalin from the adrenal medulla. • These two hormones and the activity of the ANS help us cope: the ANS and the adrenalin keep us alert by increasing our heart rate and blood pressure and quickly mobilizing energy reserves. • In contrast, cortisol works more slowly, helps replenish energy supplies and, at the same time, helps us to remember important things. For example, cortisol readies our immune system to handle any threat -- bacterial/viral or injury.
  • 6.
    THE MEANING OFDEPRESSED HRV • Depressed HRV primarily means that heart rate is monotonously regular. And it means lowered ability of the ANS’s regulatory function and ability to keep the homeostasis, cope with the internal and external stressors (stress provoking agents) and resist disease or recover in proper time.
  • 7.
  • 8.
    METHODOGOLY • HRV canbe assessed in two ways, either as a Time Domain Analysis or in the frequency domain as a Power Spectral Density (PSD) analysis. In either method, the time intervals between each successive normal QRS complex are first determined. All abnormal beats not generated by sinus node depolarizations are eliminated from the HRV analysis. • Graph B is HRV tachogram which every frequency wave from low to high frequency mixed. After filtering the high frequency power to measure the power of sole low frequency wave, only LF waves remain like in Graph C and vise versa (Graph D, remained HF wave). The technique for this analysis is called FFT.
  • 9.
    • Each ofthe methods has advantages and disadvantages. Time domain measures are the simplest to calculate but do not provide a means to quantify autonomic balance or information on the temporal distribution of power in the different branches of the autonomic nervous system. On the other hand, the main advantages of power spectral density(PSD) analysis over the time domain measures is that it supplies information on how the power is distributed (the variance) as a function of frequency, thereby providing a means to quantify autonomic balance at any given time.
  • 10.
    TIME DOMAIN PARAMETERS •Time domain measures are the simplest to calculate and include the mean normal-to-normal (NN) intervals during the entire recording and statistical measures of the variance between NN intervals. • A Variance is mathematically equivalent to the total power of spectral analysis, so it reflects all cyclic components `of the variability in recorded series of NN intervals.  MEAN HRT (BPM) is the average heart rate during 5 minutes.  SDNN (MS) • SDNN is a standard deviation of the NN intervals, which is the square root of their variance. The actual values of SDNN depend on the length of recording - the longer recording is, the higher SDNN values are.
  • 11.
     SDNN Index(MS) • SSSDNN Index is the mean of the standard of all the normal RR intervals of the standard deviations of all the normal RR intervals for each 5-minute segment of a 24- hour ECG recording. • The Index is believed to be a measure primarily of autonomic influence on heart rate variability.  RMS-SD (MS) • RMS-SD is the square root of the mean squared differences of successive NN intervals. This measure estimate high-frequency variations in heart rate in short-term NN recordings that reflects an estimate of parasympathetic regulation of the heart.  PSI (Physical Stress index ) NO SCALE • PSI reflects the load and pressure to your heart based on SDNN and HRT at the same time.
  • 12.
     APEN (Approximateentropy ) NO SCALE • A recently developed statistic quantifying regularity and complexity that appears to have potential application to a wide variety of physiological and clinical time-sereis data. The higher ApEn is the more tachogram is complex, which is considered good.  SRD (Successive R-R interval Difference ) NO SCALE • SRD is calculated by comparing the initial part (1/3) of total measuring duration to the successive part (2/3) of total measuring duration. The value 1(full scale) is the ideal state that means the measurement was done under constant status.  TSRD (Total Successive RR interval Difference during 5min measurement) • It is used when the same patient exam more than twice in different condition of the same condition to compare the result influenced by the condition change or to confirm that the test condition was similar.
  • 13.
  • 14.
     Total Power(TP) (MS 2) 0-0.4HZ • Total Power is a short-term estimate of the total power of power spectral density . • This measure reflects overall autonomic activity where sympathetic activity is a primary contributor.  Very Low Frequency (VLF) (MS 2) 0-0.04 HZ • Very Low Frequency indicates overall activity of various slow mechanisms of sympathetic function. Low Frequency (LF) (MS 2) 0.04-0.15HZ • Low Frequency reflects both sympathetic and para-sympathetic activity. • Generally it is a strong indicator of sympathetic activity
  • 15.
     High Frequency(HF) (MS 2) 0.15-0.4 HZ • High Frequency reflects parasympathetic (vagal) activity. • HF is also known as a ‘respiratory’ band because it corresponds to the NN variations caused by respiration (this phenomena is known as respiratory sinus arrhythmia (RSA)). • Heart rate is increased during inhalation and dropped during exhalation.  LF/HF Ratio • This measure indicates overall balance between sympathetic and parasympathetic systems. • Higher values reflect domination of the sympathetic system, while lower ones - domination of the parasympathetic system.
  • 16.
    Normalized Low Frequency(LF Norm) & High Frequency (HF Norm) • Normalized Low Frequency is the ratio between absolute value of the Low Frequency and difference between Total Power and Very Low Frequency. Normalized LF is calculated in percentile units. • LF norm= LF/(TP-VLF)*100= LF/(LF+HF)*100 • Normalized High Frequency is the ratio between absolute value of the High Frequency and difference between Total Power and Very Low Frequency. Normalized HF is calculated in percentile units. • HF norm= HF/(TP-VLF)*100= HF/(LF+HF)*100 • This emphasizes the balance between the sympathetic and parasympathetic arms of the ANS.
  • 17.
    USAGE OF HRVIN DAILY CLINICAL PRACTICE • To find out the early signs of development of pathological processes or the presence of a functional disorder. • To assess the level of physical fitness and stress coping ability. • To evaluate the treatment effectiveness and prognosis. • To confirm the effect of stress relaxation program. • To get guideline in selecting drugs, doses, therapy. • To initiate and help the interview with the self-defensive patients with stress induced psychological problem.
  • 18.
    Cautions for accuratemeasurement & analysis  Environmental requirement • Please try to keep the measurement time since the HRV is known to have circadian rhythm due to changing of ANS balance (morning/evening). • The appropriate environment: Avoid too bright light or noise Maintain proper room temperature.  Before the measurement • Avoid caffeine, smoking at least 2 hours before the measurement. • Avoid the measurement right after the meal (2 hours after the meal). • Time for patient to adjust the new environment and resting state is needed. • Remove the manicure while being measured with finger sensor.  During the measurement • Maintain comfortable sitting position. • Don’t move or talk. • Don’t close the eyes or fall asleep. • Respiration: In normal and resting state. Don’t control the breathing intentionally.
  • 19.
  • 20.
     HRV Tachogram •The HRV tachogram presents the fluctuation of heart rate during 5 minutes influenced by constant ANS regulation on heart.  Histogram • In histogram, X-scale indicates RR-interval(ms) while Y scale indicates the number of heart rate (bpm) recorded. Lowered HRV is likely to draw a histogram with narrow width and high peak while higher HRV accompanies that with flattish shape without prominent peak.  RRV • RRV indicates RR variation which reflects the variability of the heart rate. • The more variation that exist in the HRT, the wider the “cloud” (dotted shape) is displayed. If the heart rate were monotonously regular, the “cloud” would be the shape of a small and round ball with great density rather than long oval shape with lower density.
  • 21.
     PSD • PSDis power spectrum of a 5-minute heart rate variability waveform of tachogram. PSD analysis information of how power is distributed in each frequency- section, VLF, LF and HF. X scale indicates frequency (Hz) and Y scale indicates power (msec2/Hz).  SNS & PNS • SNS&PNS reflects the balance of autonomic nervous system.  Stress Index • The upper one is physical pressure index reflecting the SDNN and HRT in time domain. • The lower one is emotional status comes from the balance between SNS and PNS.
  • 22.
    TP, VLF, LFand HF  TP (Total Power): Total power of VLF, LF and HF. Indicator of general activity of autonomic nervous system and sympathetic nervous system as basic factor. Chronic stress and disease decreases the total power due to the weakened regulating function.  VLF (Very low frequency): Complementary information of sympathetic nervous system. Frequency band of 0.0033-0.04Hz  LF (Low frequency): Indicator of sympathetic/parasympathetic nervous system. Frequency band of 0.04-0.15Hz  HF (High frequency): Indicator of parasympathetic nervous system. Frequency band of 0.15- 0.4Hz
  • 23.
     ABD (autonomicbalance diagram) • X-scale indicates LF power (log value)-Sympathetic condition Y-scale indicates HF power (log value)-Parasympathetic condition  ApEn (approximate entropy) • ApEn, is a recently developed statistic quantifying regularity and complexity that appears to have potential application to a wide variety of physiological and clinical time-sereis data. • The higher ApEn is the more tachogram is complex, which is considered good.  SRD (successive R-R interval difference) • SRD is calculated by comparing the initial part(1/3) of total measuring duration to the successive part (2/3) of total measuring duration.
  • 24.
    REPORT READING  VARIABILITY-Check Point; HRT Tachogram, Histogram, RRV, SDNN
  • 25.
     MEAN HRT •Anxiety mood patient sometimes shows Sinus Tachycardia (95-110) under 150bpm which is not generally considered as functional heart problem.  Balance of SNS & PNS • If the LF/HF ratio is between 0.5-2.0, it is clinically considered as balanced status. • Hyper SNS activity – Hypertonia – Related to anxiety, acute stress response • Hyper PNS activity – Hypotonia – Related to depression, women>men.
  • 26.
    • Physical andMental Stress Index • PSI : Right side of Moderate means more stressed. Physical symptoms have been complained in many cases(somatization). • Higher stress level individuals are more likely to be Psychosomatic Disorder • MSI : High anxiety, phobia, rage, panic, Hyper-arousal • Low slow mental speed, Hypo-arousal, lethargy, chronic nervous breakdown
  • 27.
  • 28.
     Autonomic BalanceDiagram • The point is centered in case of a healthy individual. • High or chronic stress, fatigue or burnout tends to move this point to the left- down area. • This plot is useful to follow up cases after treatment.