Download as PDF, PPTX


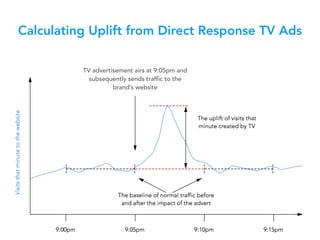


This document discusses how to optimize TV ad campaigns using web analytics data. It explains that minute-by-minute web traffic data can help determine which individual TV ads are most effective at driving people to a website. Comparing website traffic during and after a TV ad airs to a baseline level can quantify the ad's uplift. This allows optimizing spending on the most impactful TV channels, programs and timeslots for direct response ads designed to prompt immediate online action.


