Download to read offline

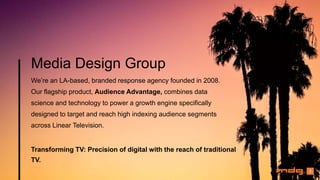


Audience Advantage Media Design Group, established in 2008, specializes in targeted advertising by combining data science with traditional media channels. Despite challenges like audience fragmentation, they leverage advanced technology and data-driven strategies to enhance media buying and audience targeting for clients. The success story highlighted shows substantial retail sales achieved through strategic media placements and dynamic budget allocation during key promotional periods.


