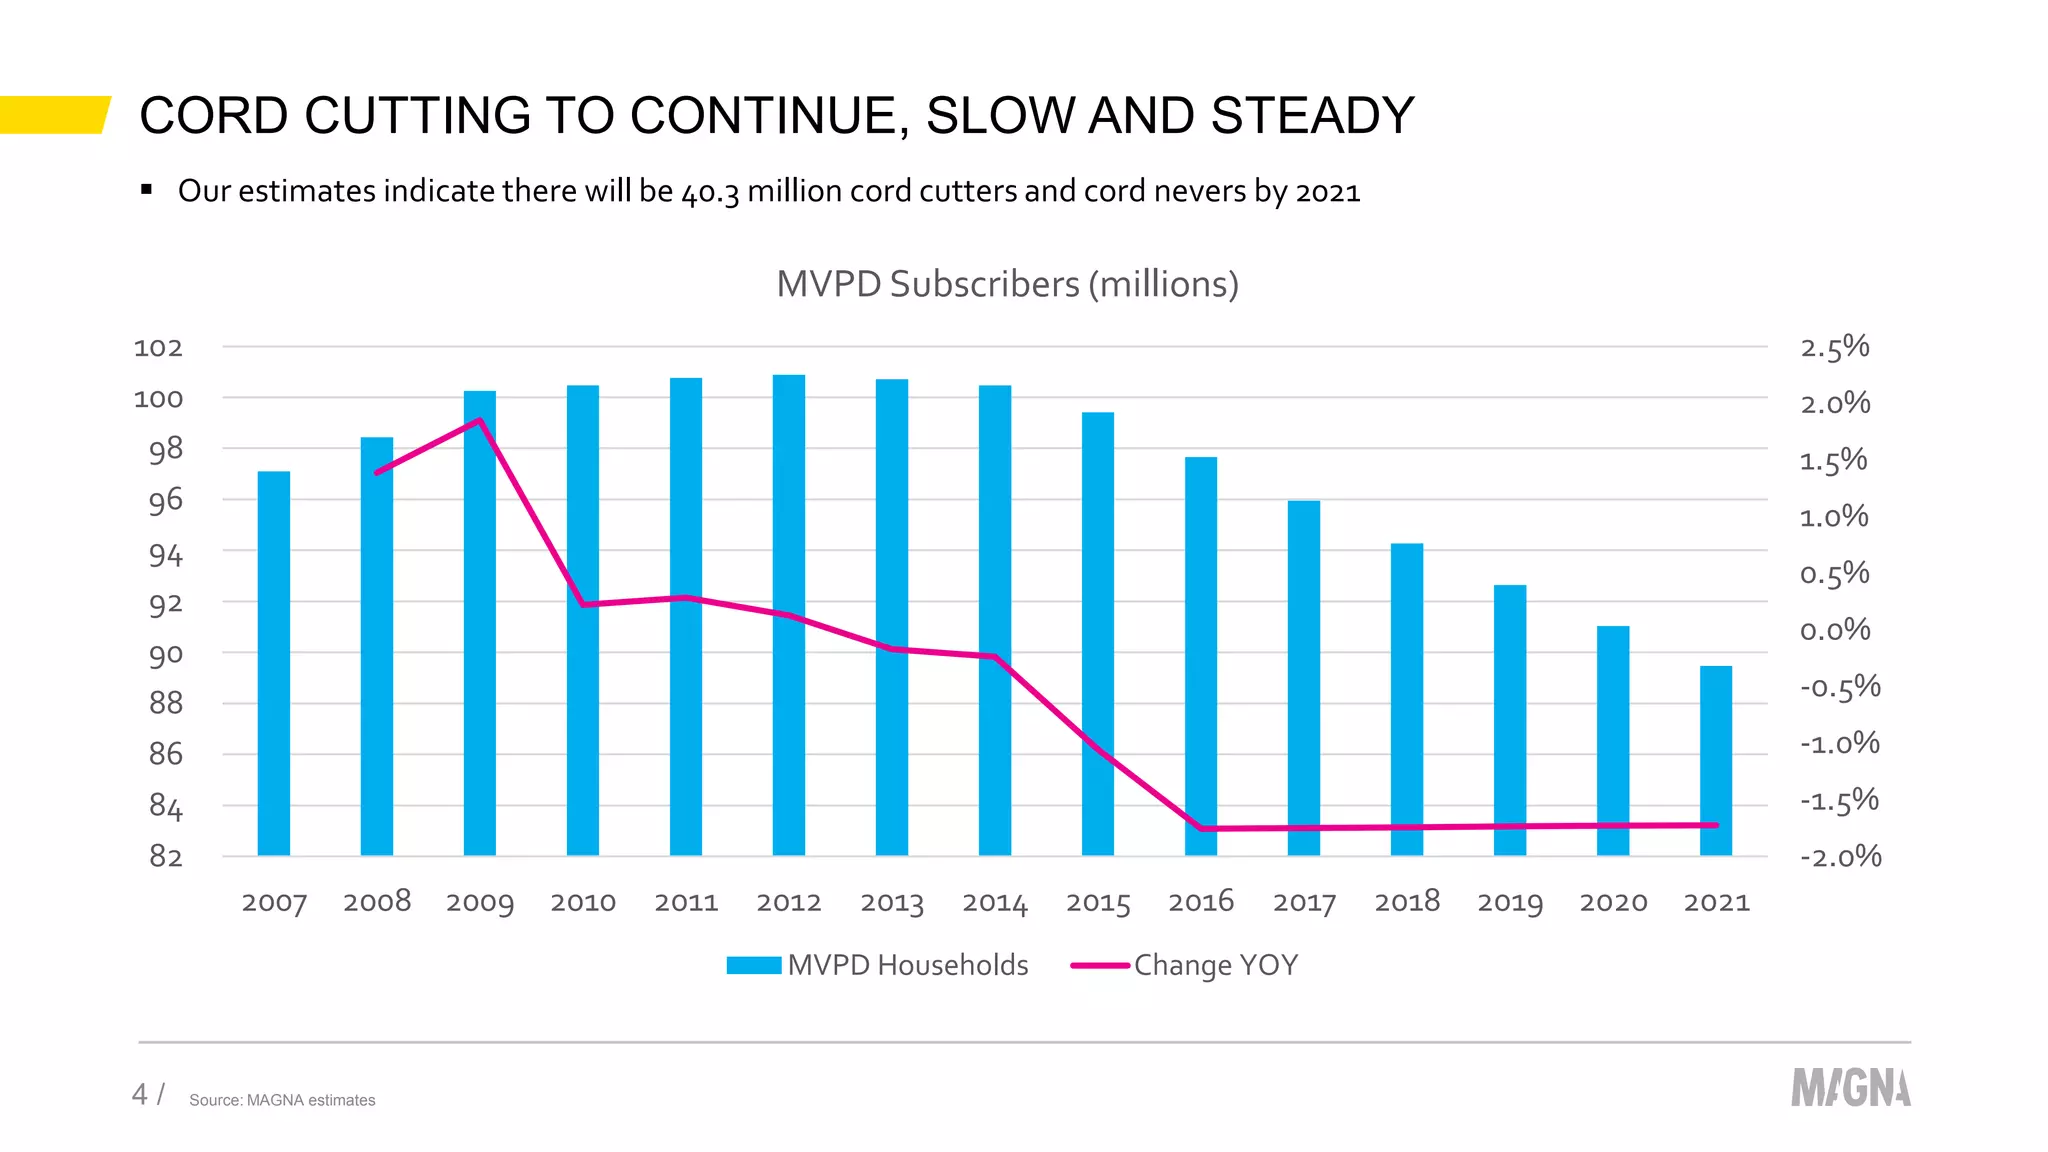
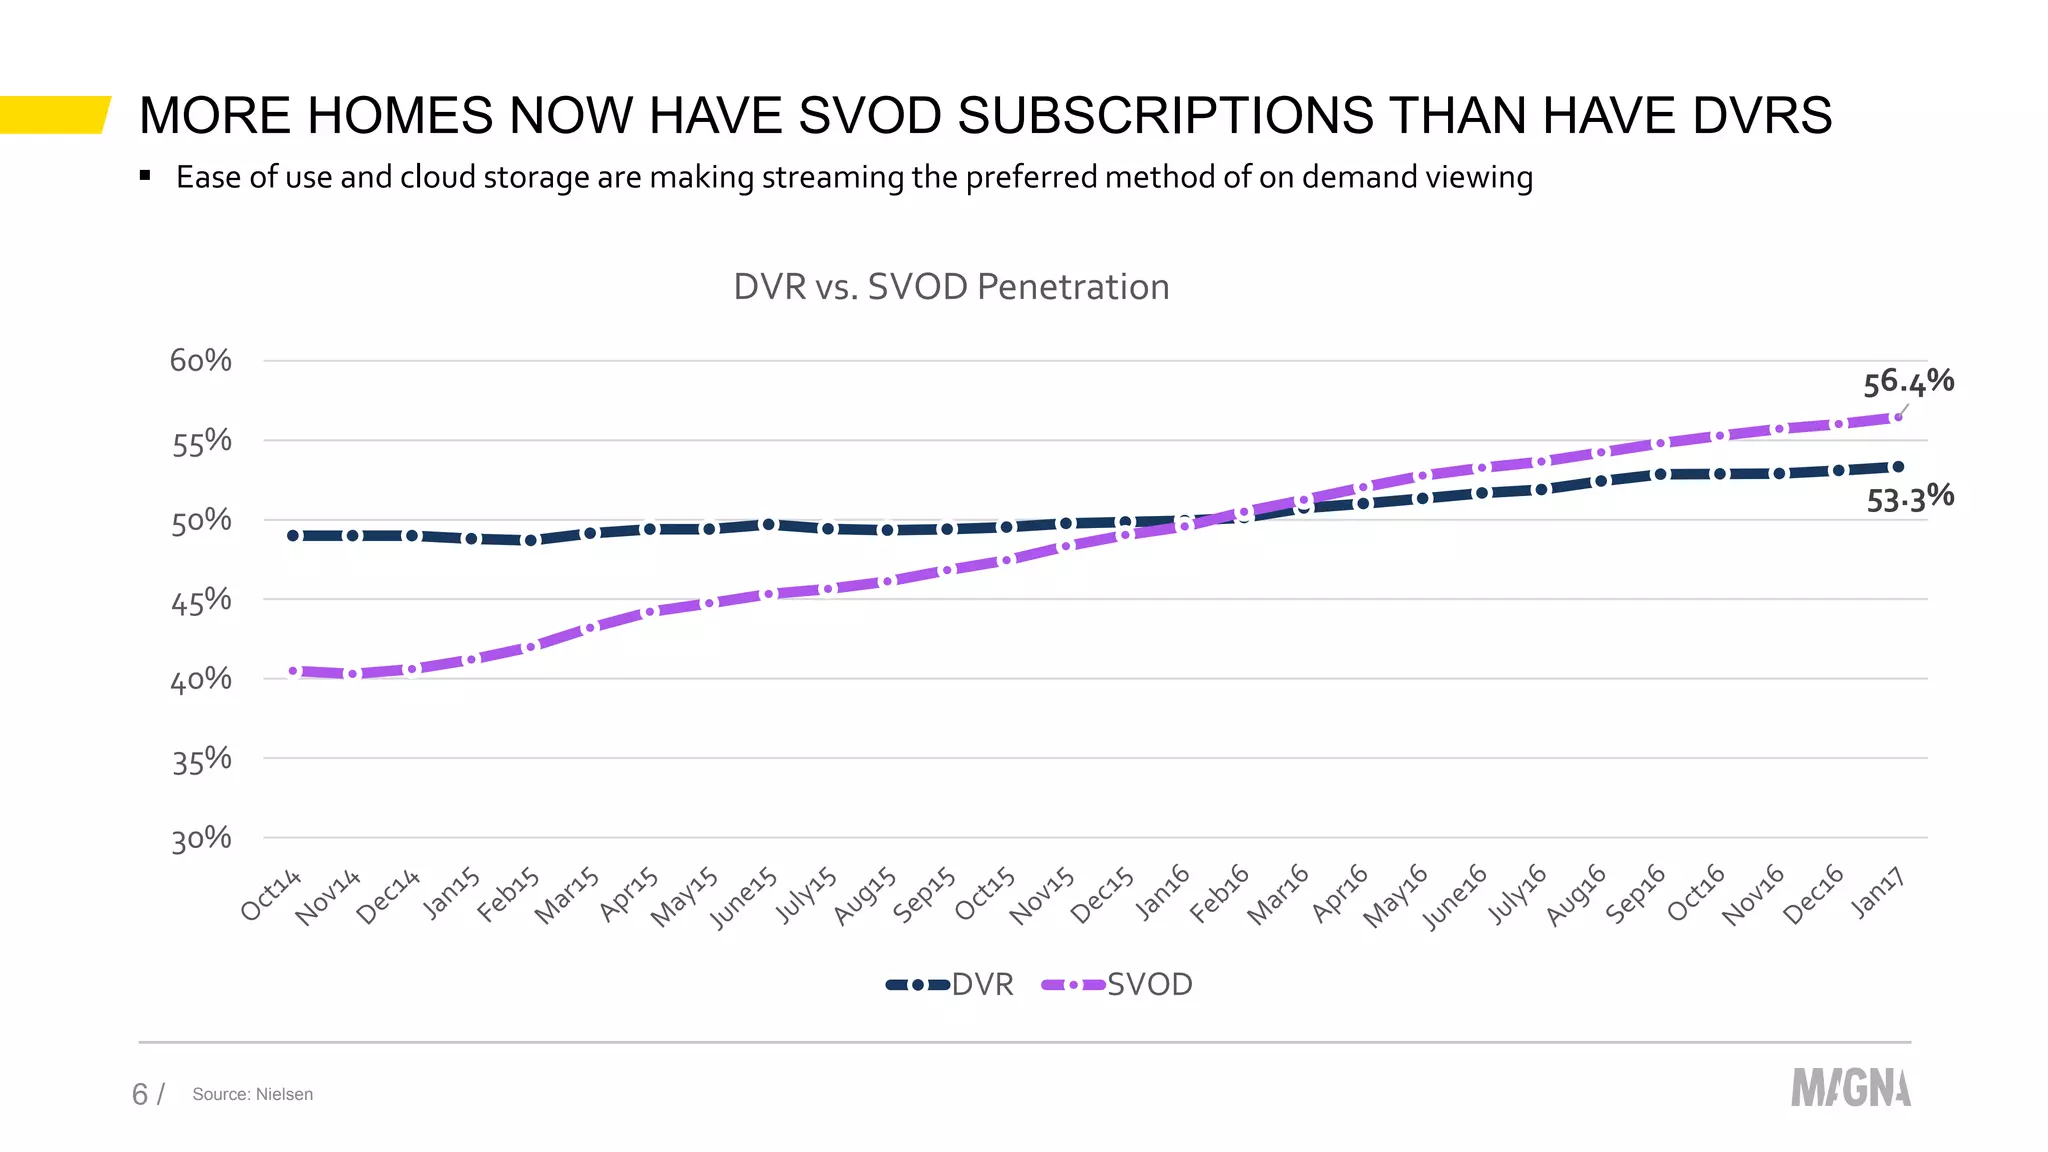
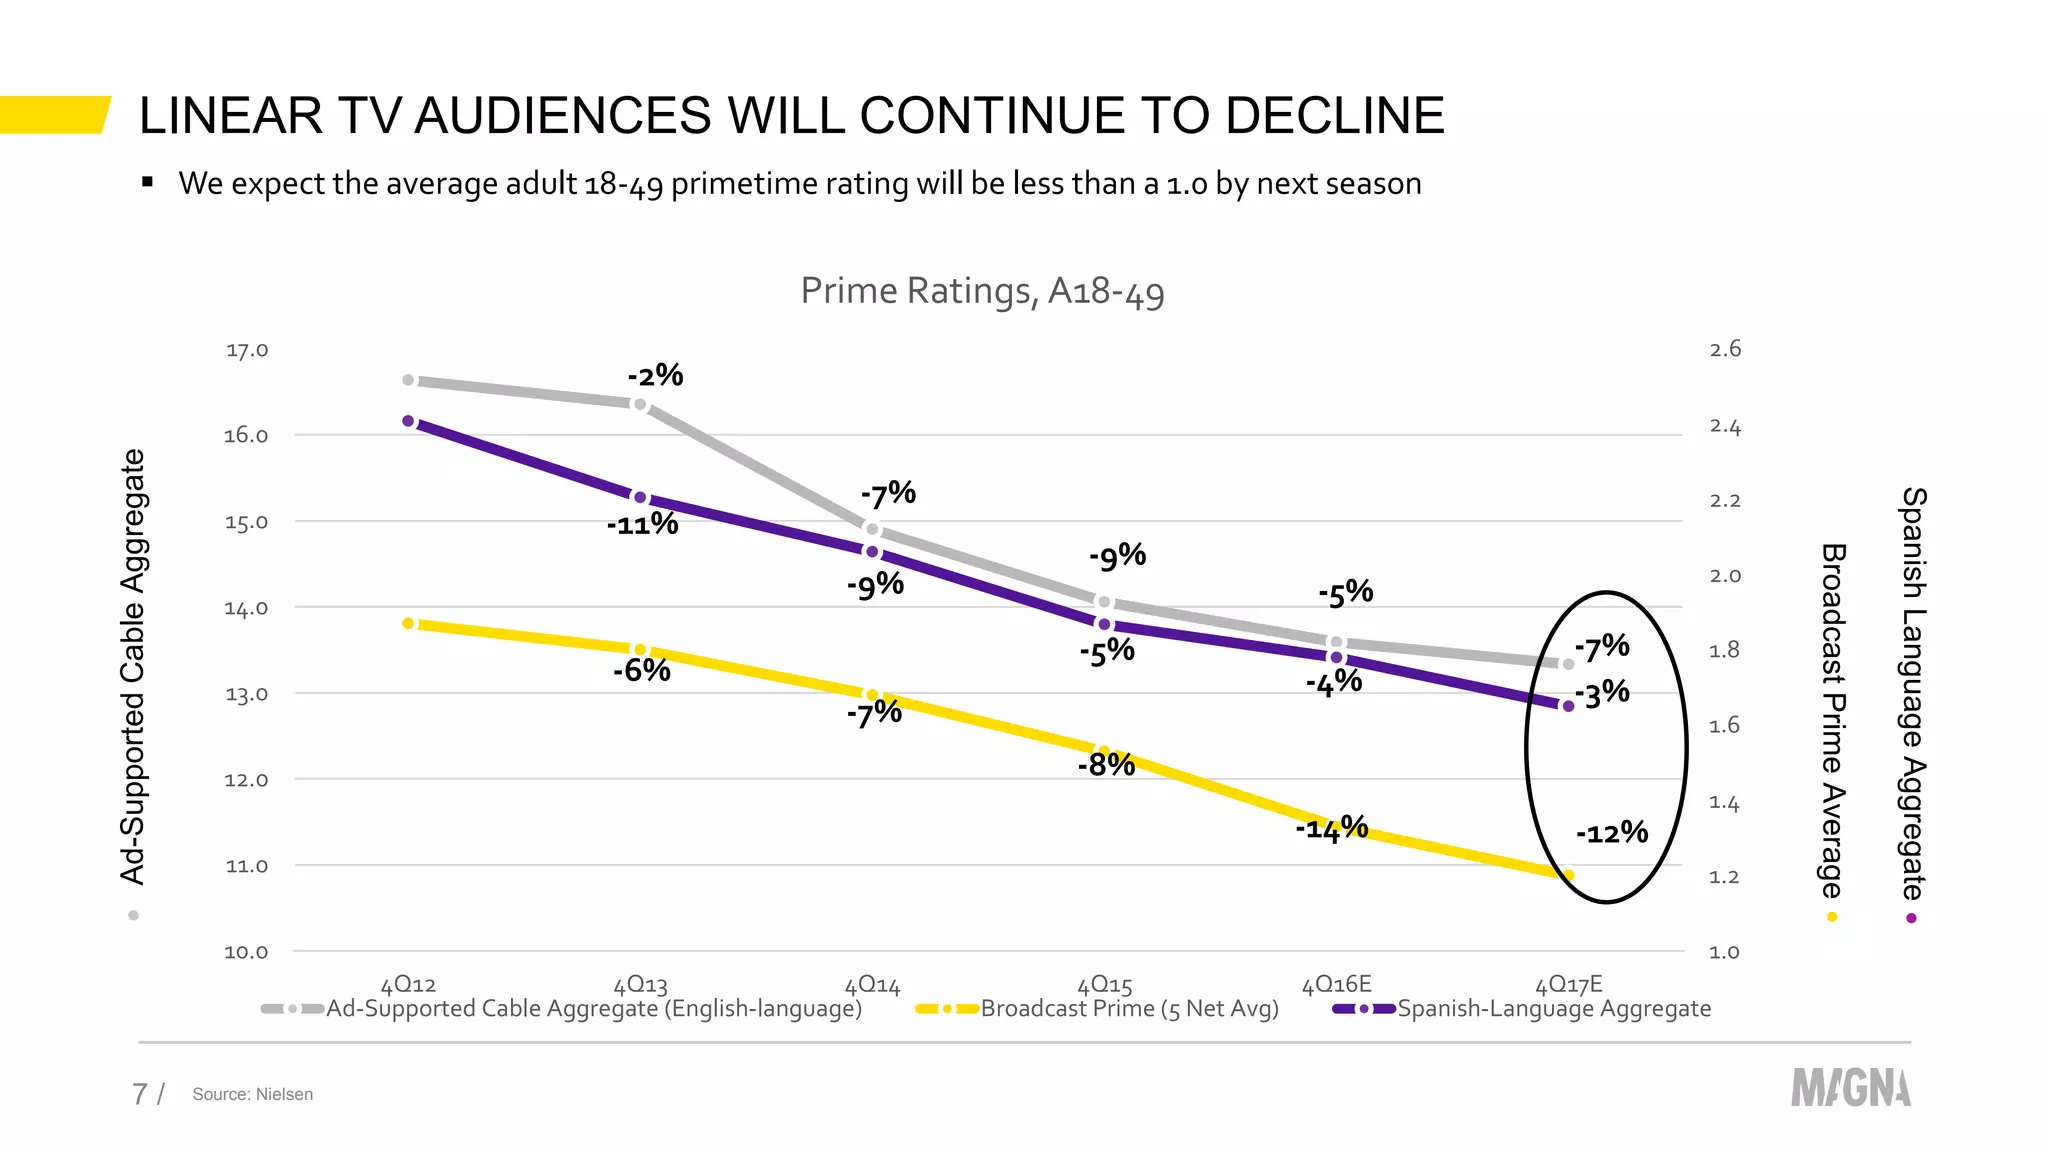
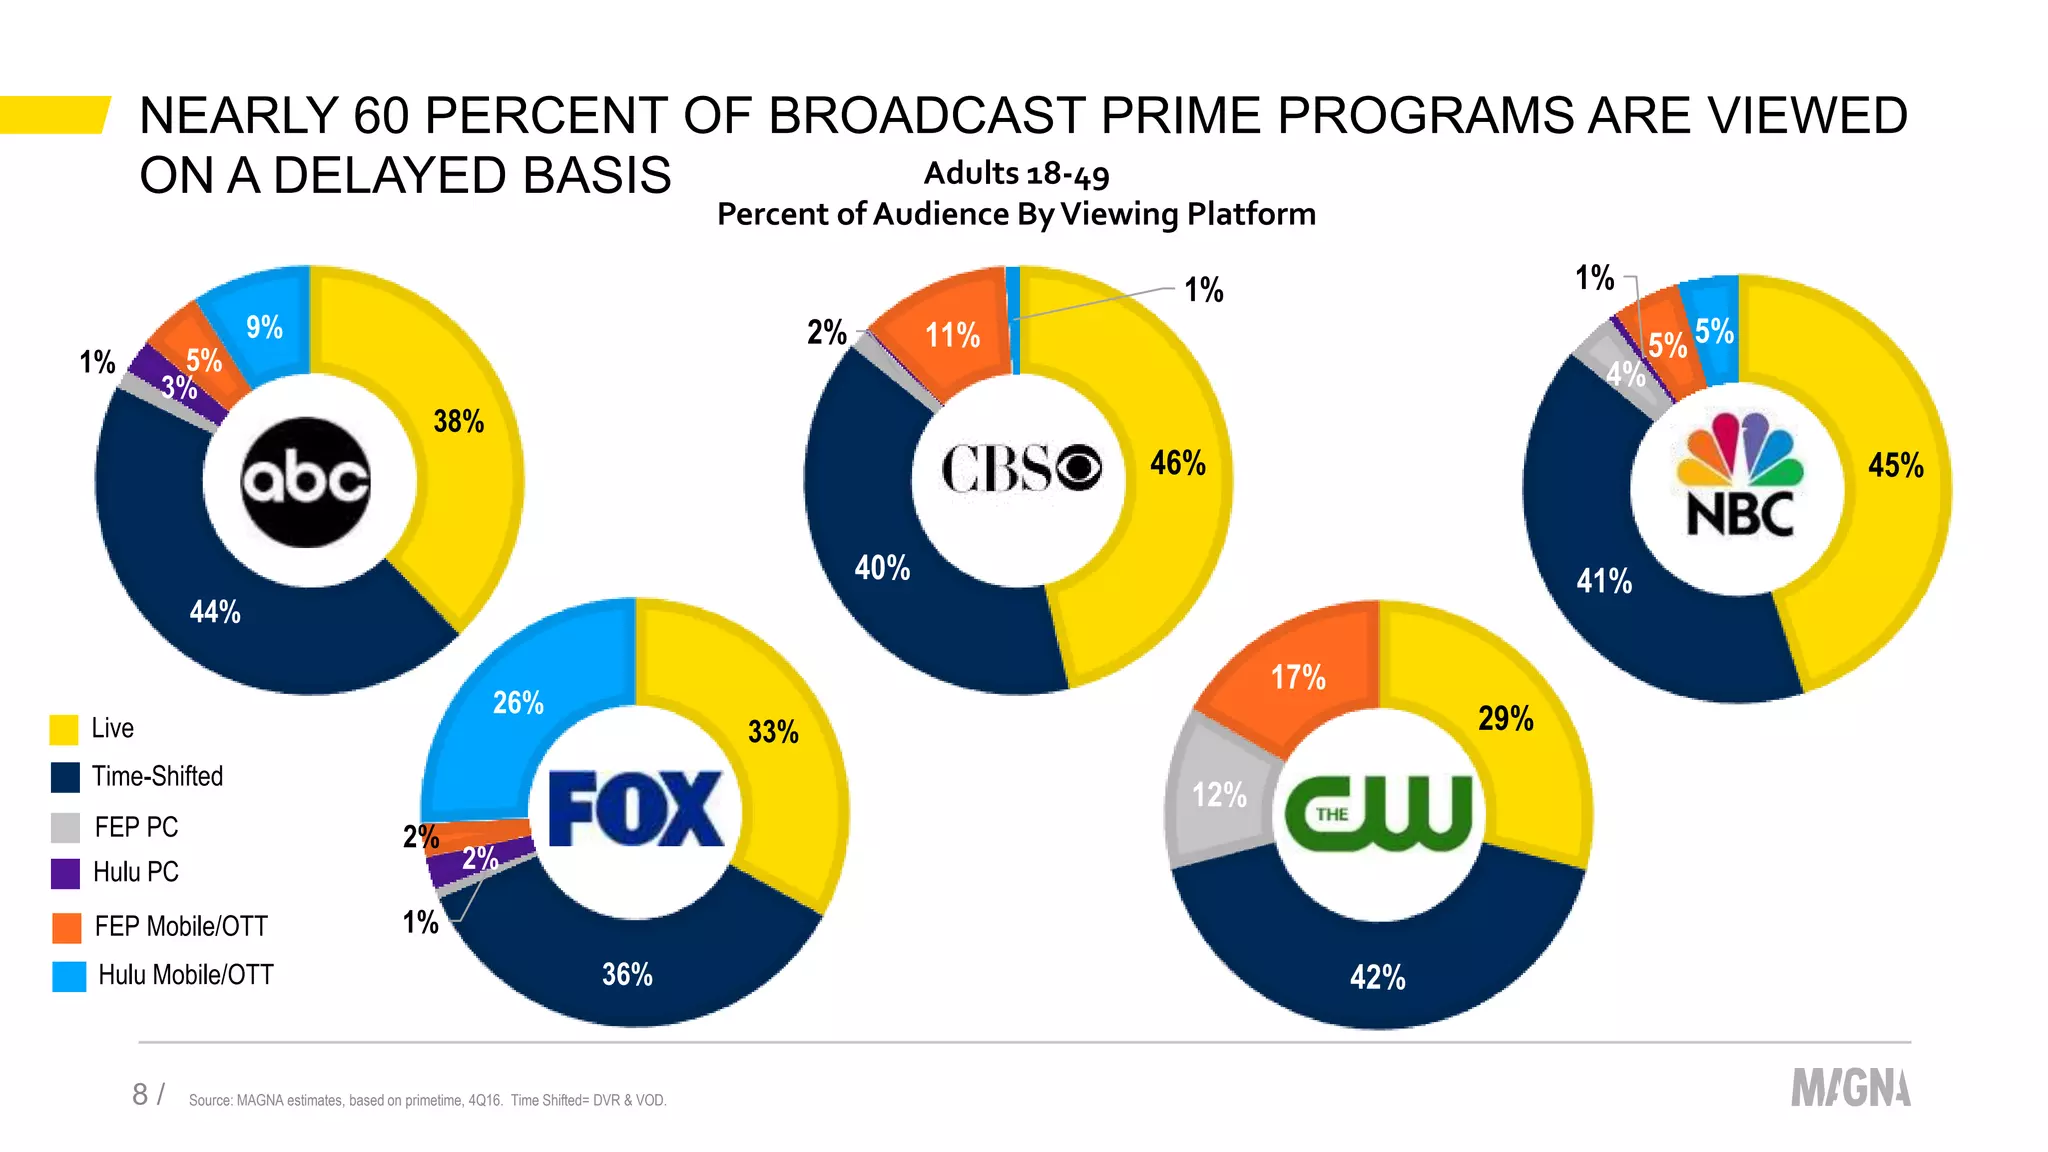
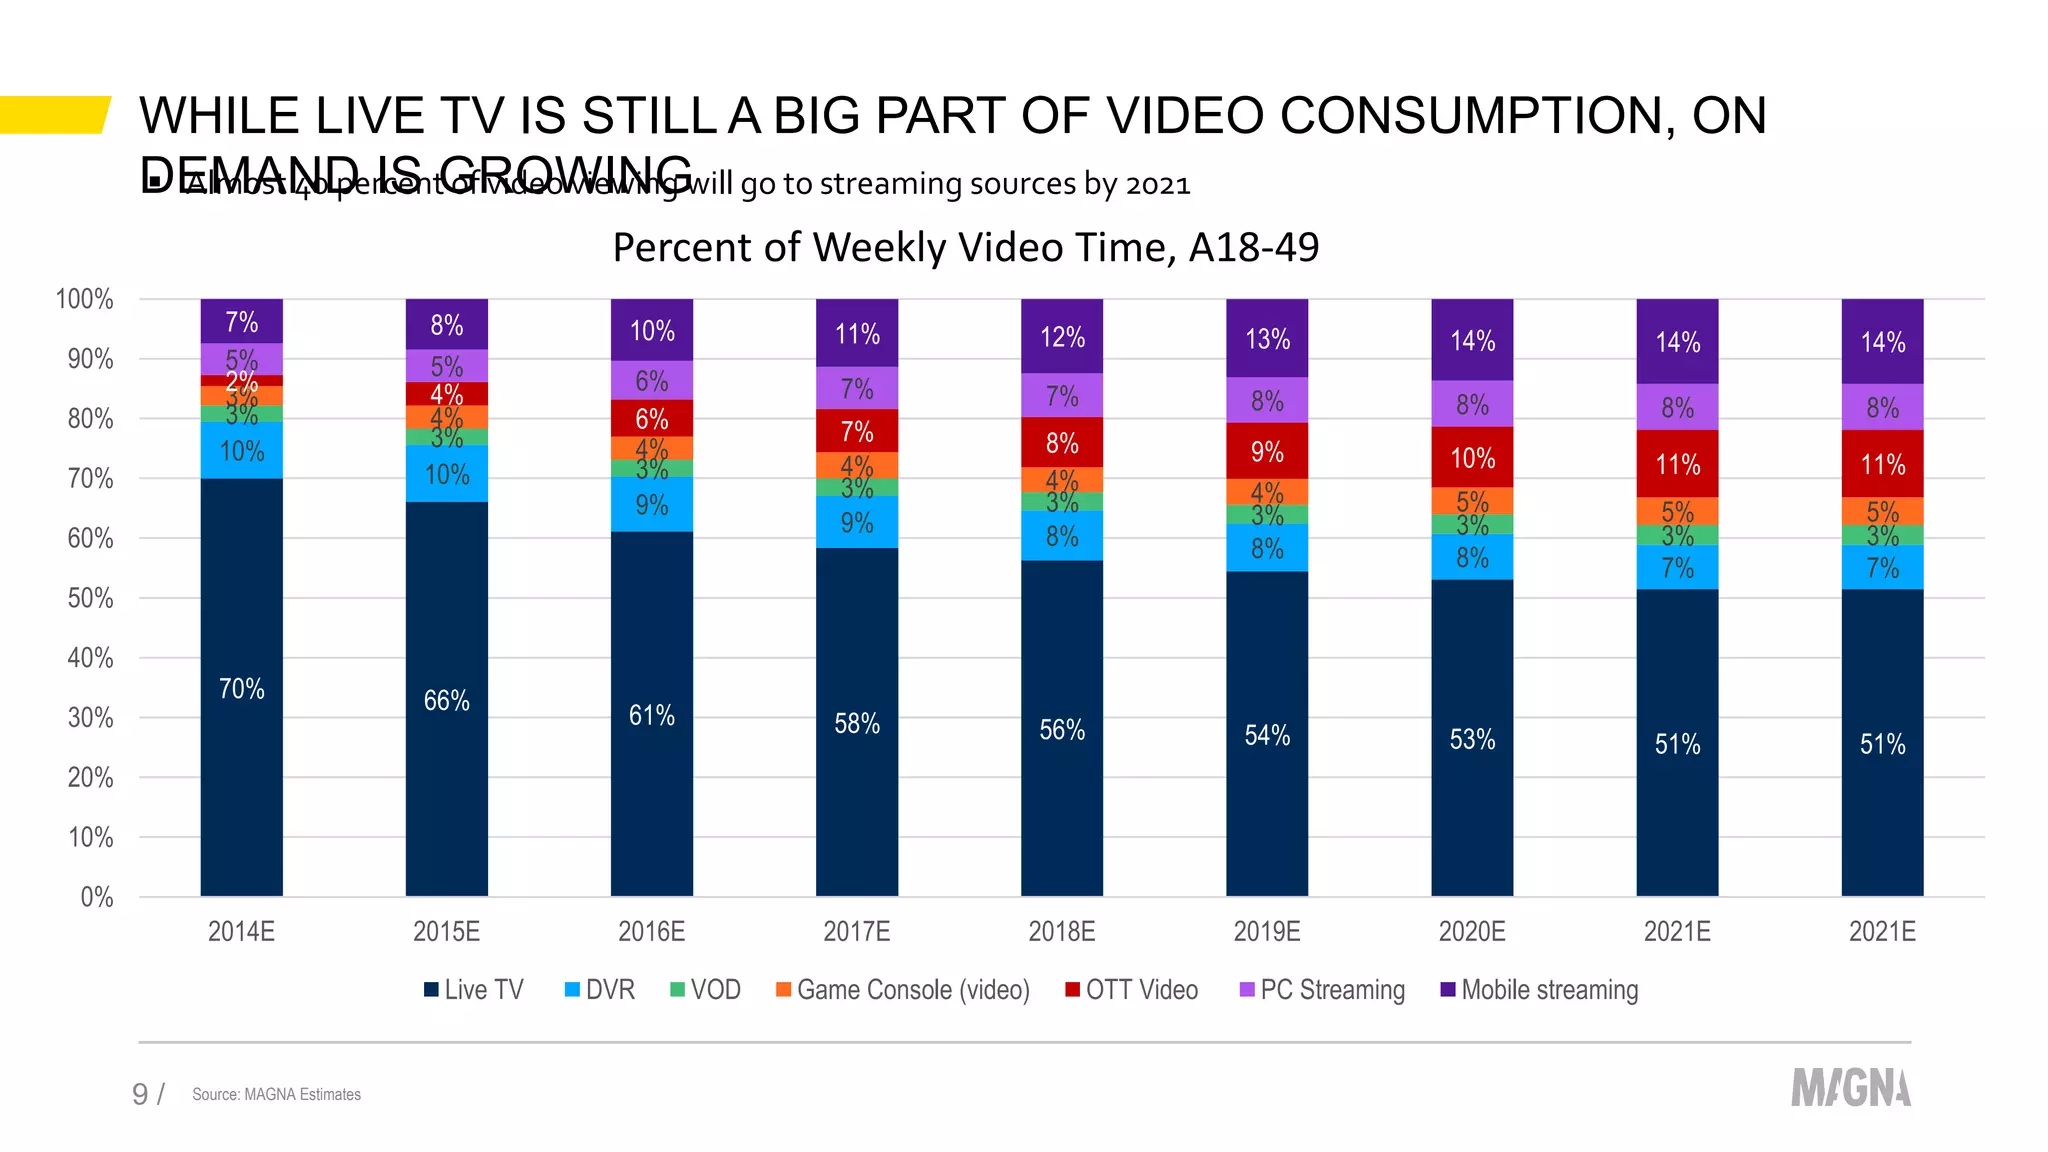
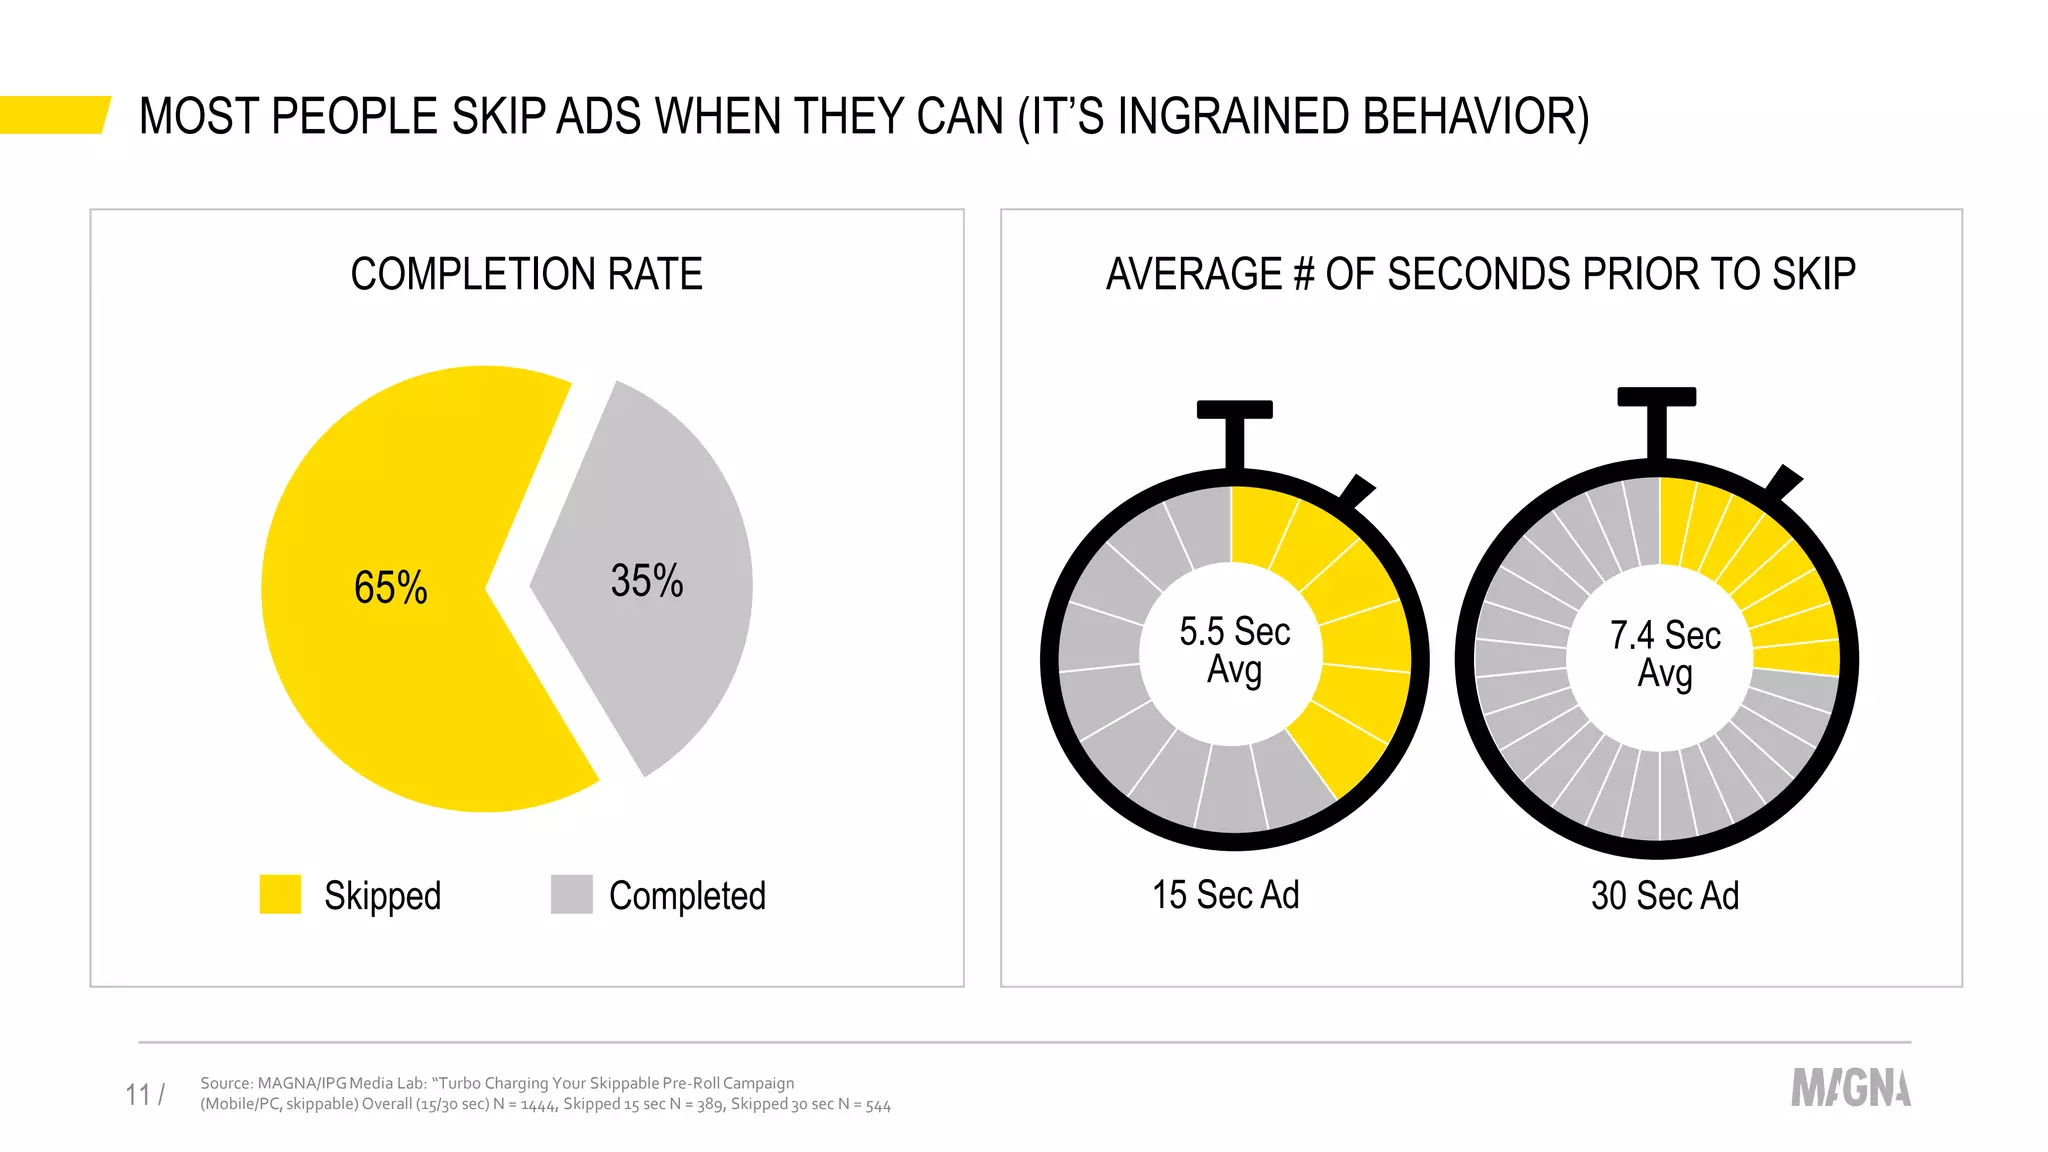
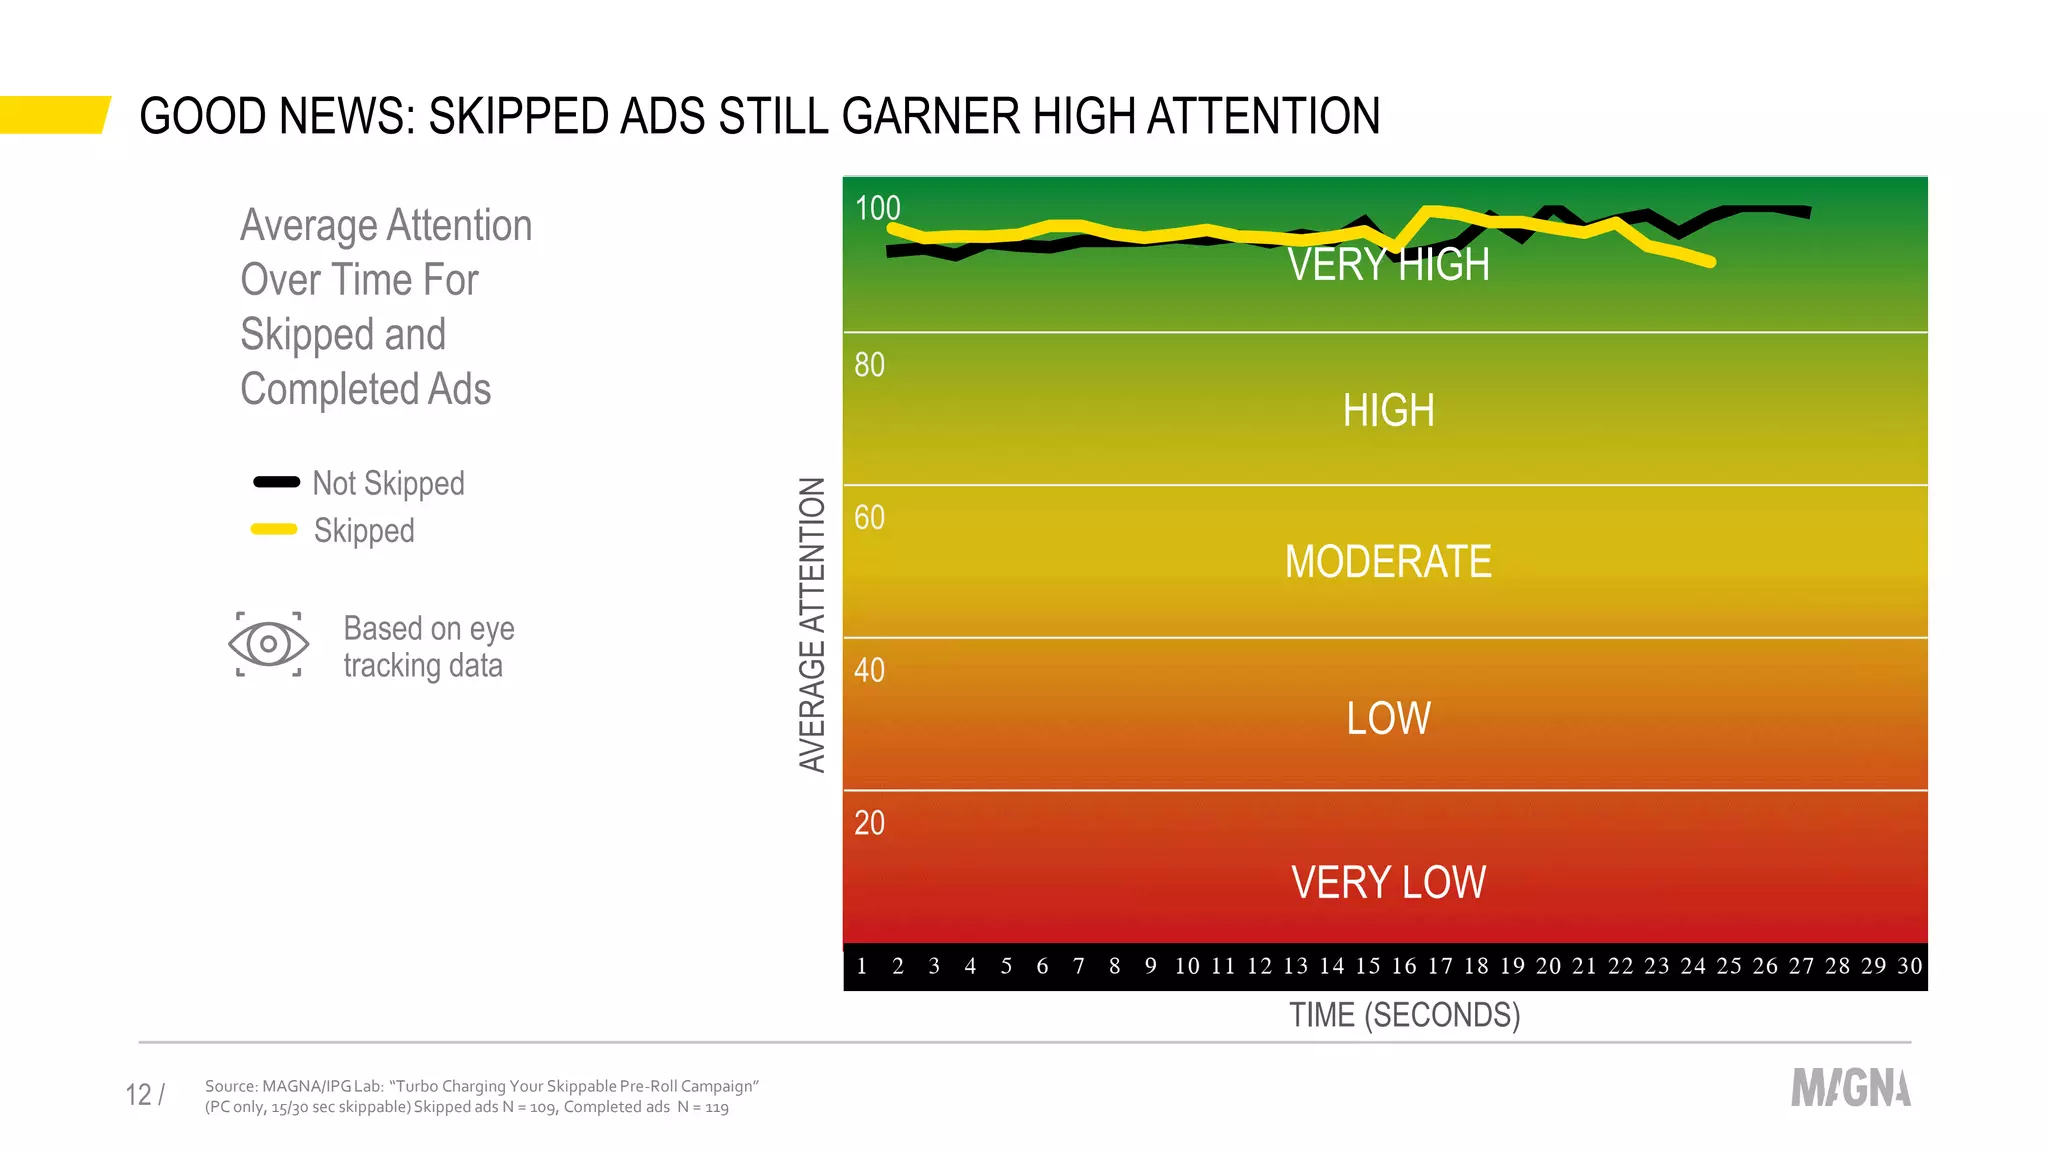
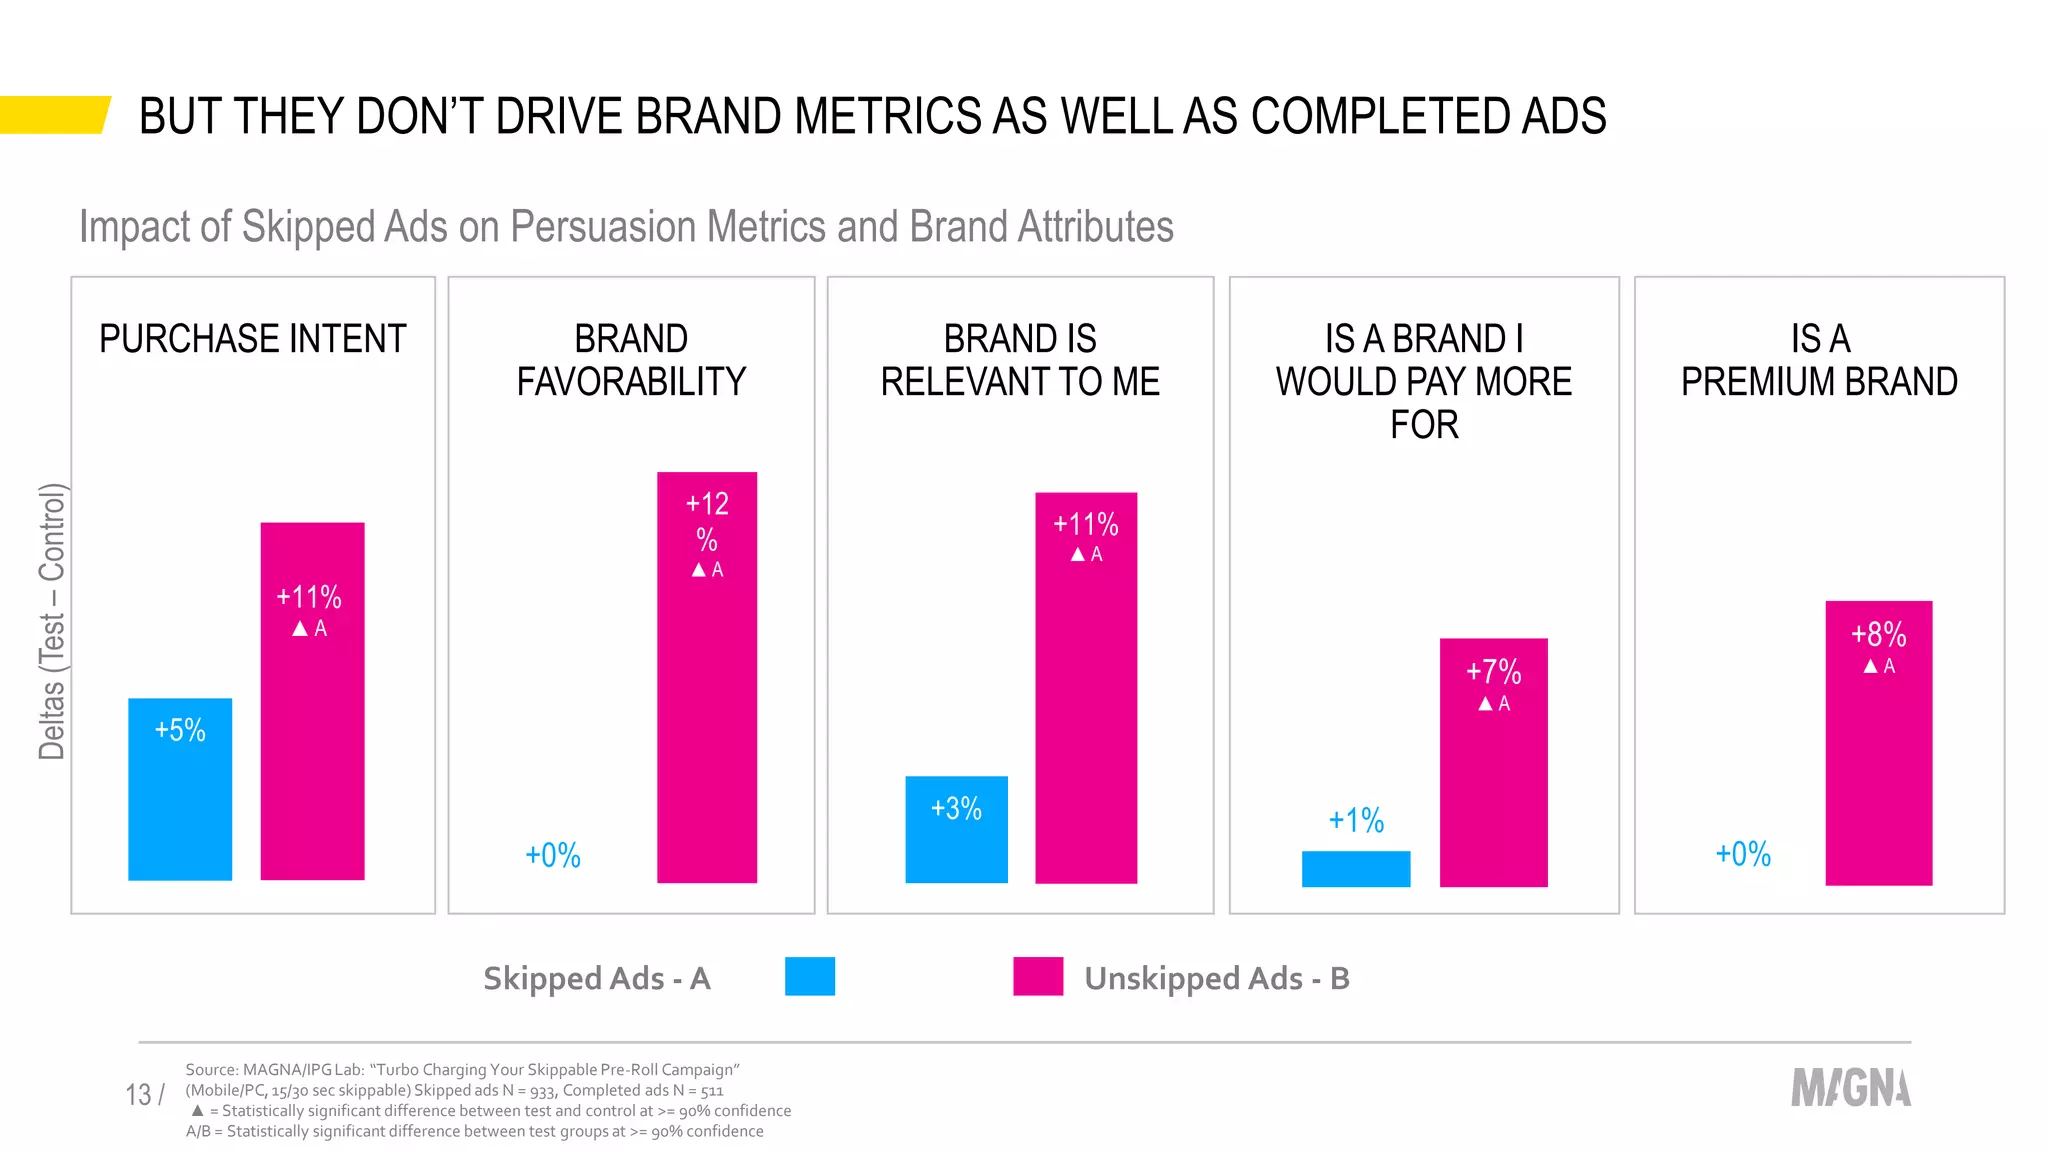
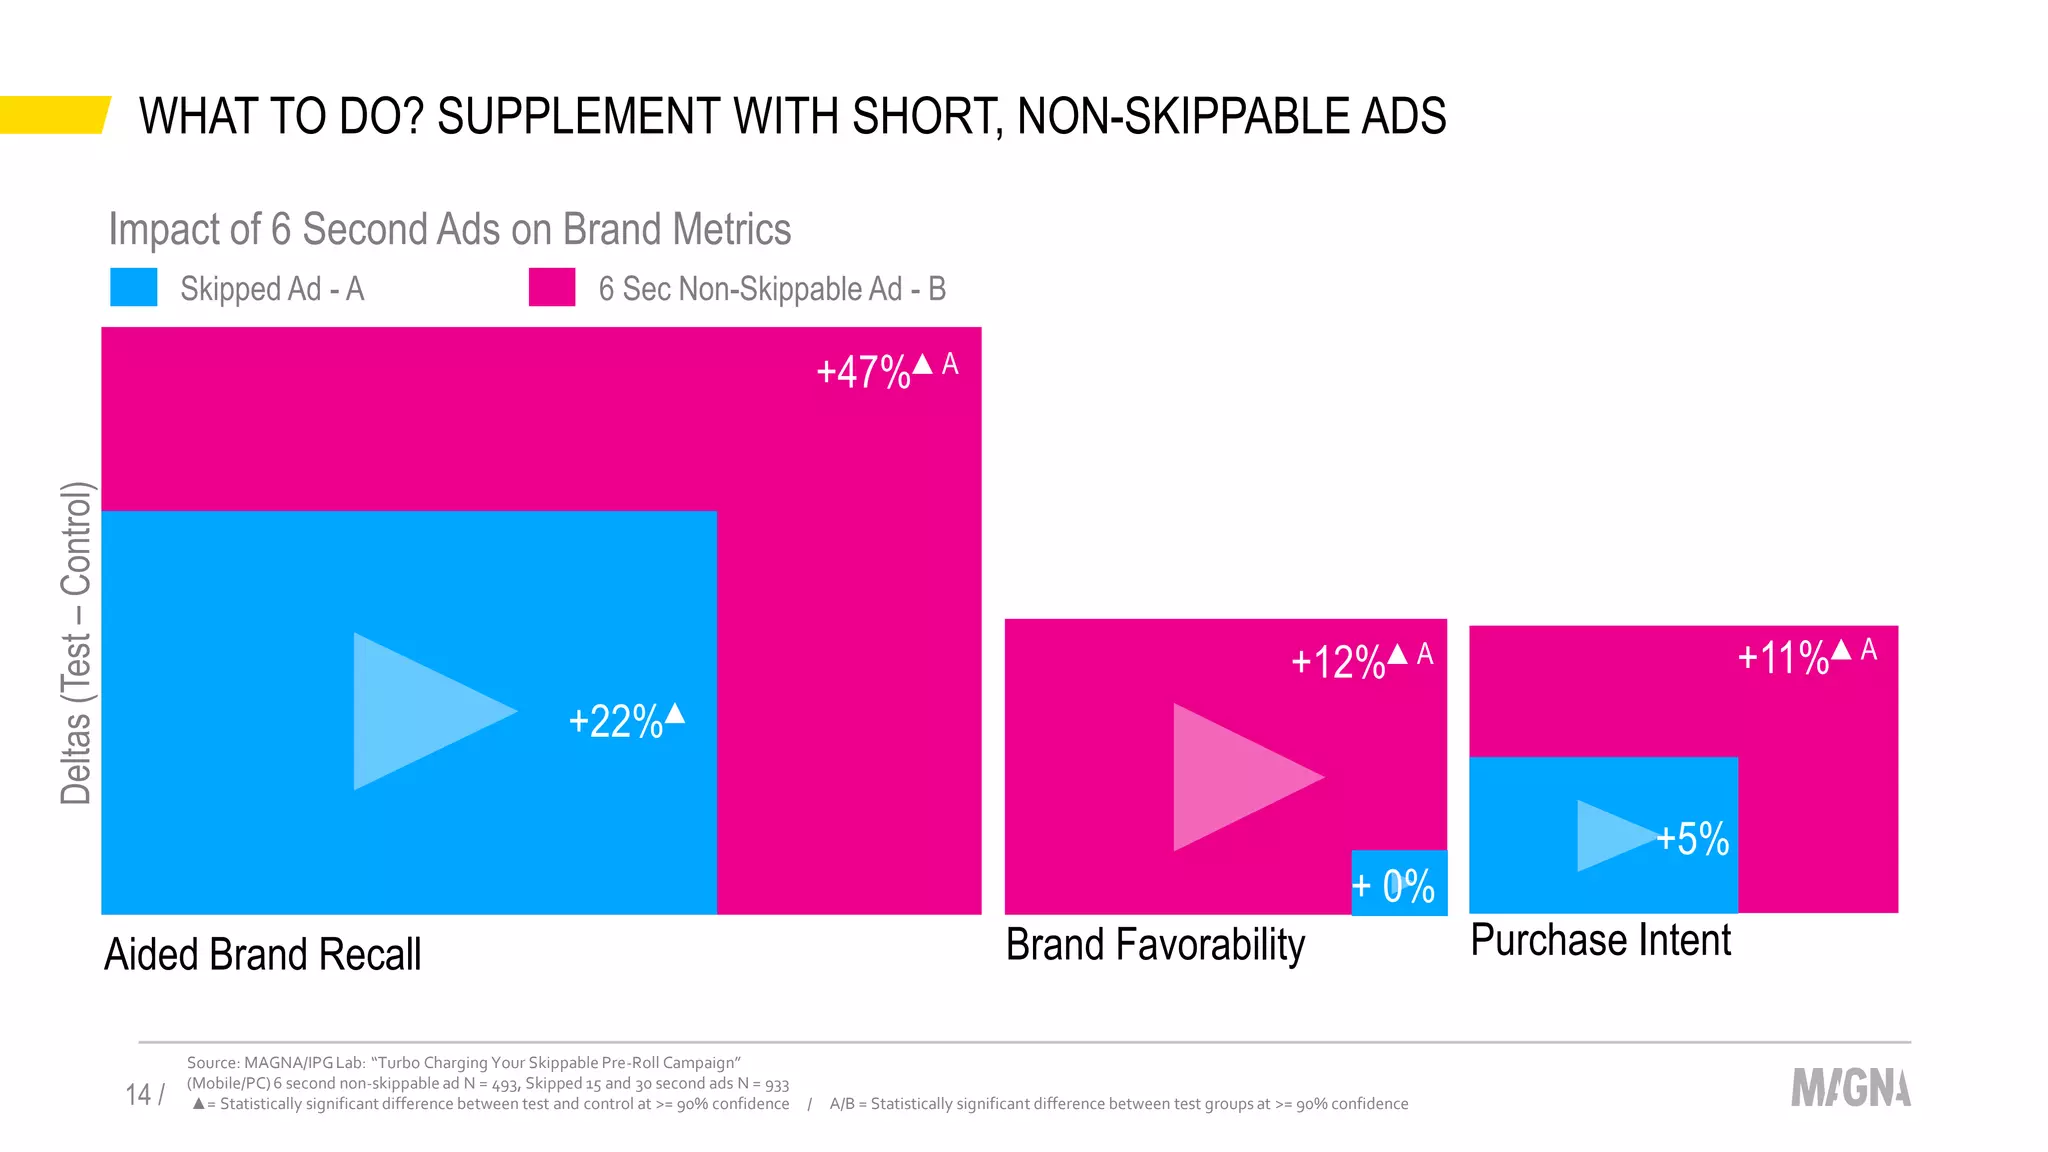
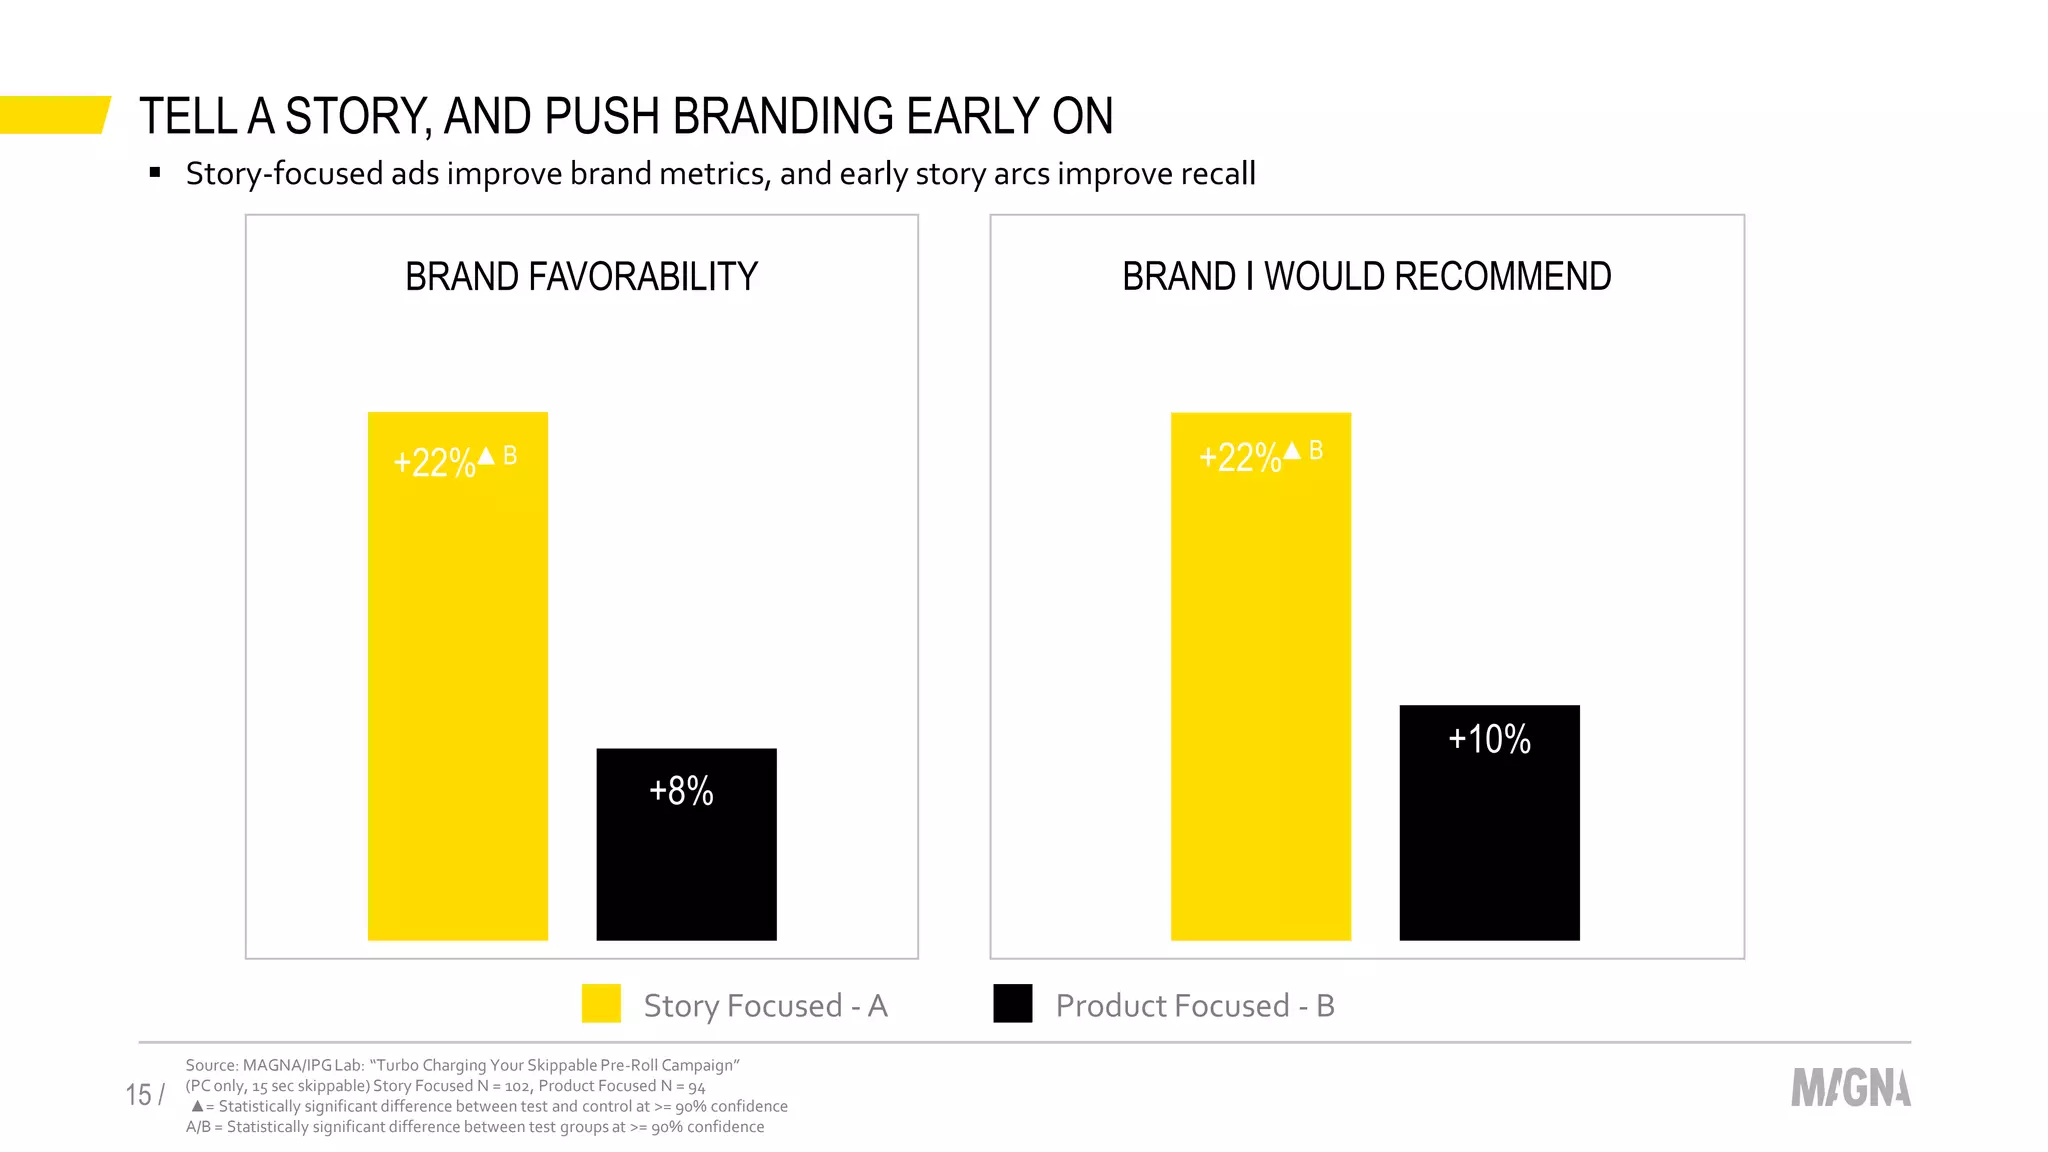
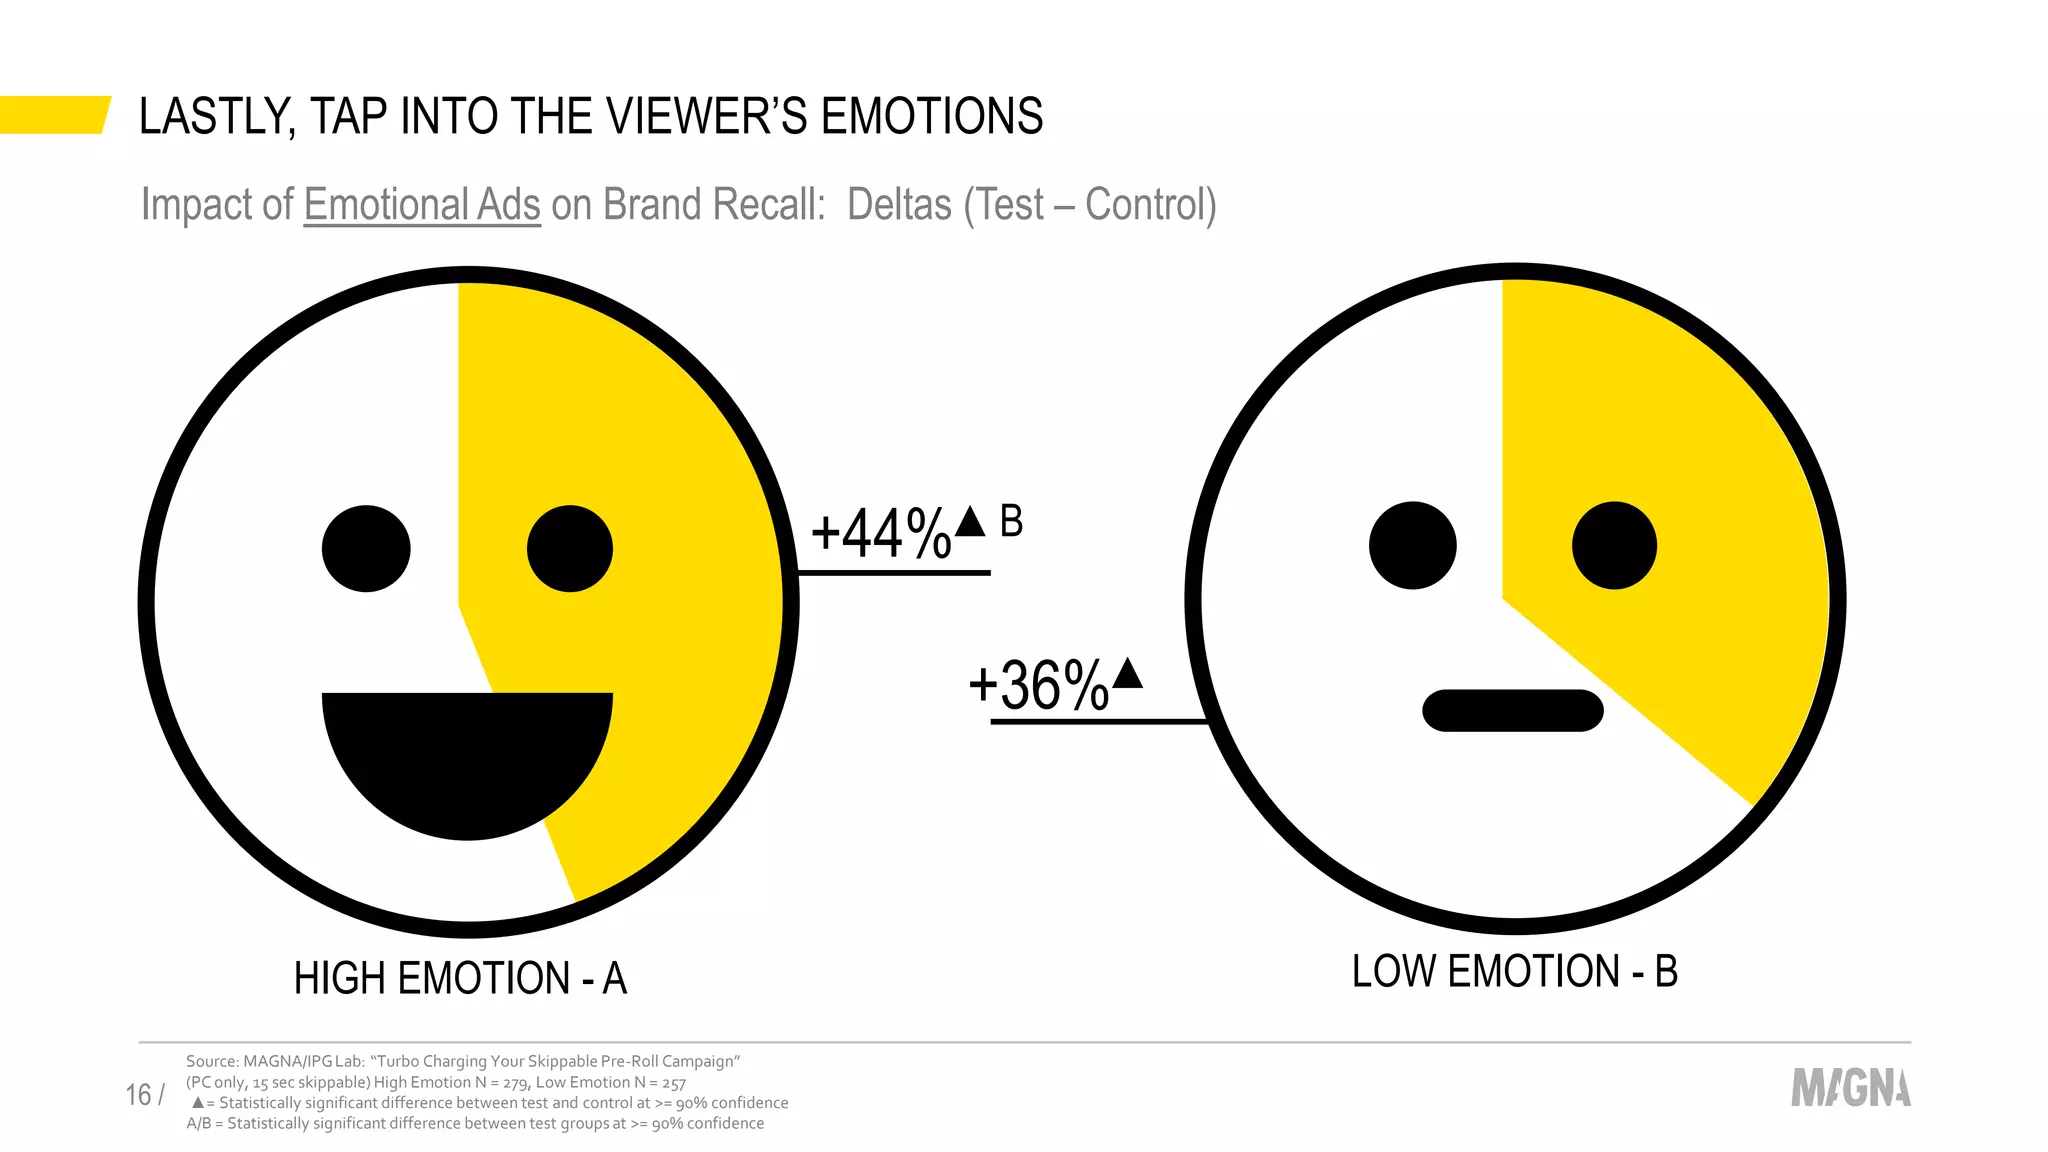
With video viewing steadily shifting toward on demand, a holistic strategy that includes OTT and other platforms will be critical to aligning with consumer behavior. This presentation will start with the new realities of video viewing and cite custom research and real campaign results to suggest winning strategies in this new world.
4. CORD CUTTING TO CONTINUE, SLOW AND STEADY
4 /
-2.0%
-1.5%
-1.0%
-0.5%
0.0%
0.5%
1.0%
1.5%
2.0%
2.5%
82
84
86
88
90
92
94
96
98
100
102
2007 2008 2009 2010 2011 2012 2013 2014 2015 2016 2017 2018 2019 2020 2021
MVPD Subscribers (millions)
MVPD Households Change YOY
Source: MAGNA estimates
Our estimates indicate there will be 40.3 million cord cutters and cord nevers by 2021
5. TV AUDIENCES ARE WATCHING (AND RECEIVING) FEWER CHANNELS
5 / Source: Nielsen
Virtual MVPDs and skinny bundles have actually reduced the average number of channels receivable after many years of
growth
6. MORE HOMES NOW HAVE SVOD SUBSCRIPTIONS THAN HAVE DVRS
Source: Nielsen6 /
Ease of use and cloud storage are making streaming the preferred method of on demand viewing
53.3%
56.4%
30%
35%
40%
45%
50%
55%
60%
DVR vs. SVOD Penetration
DVR SVOD
7. 1.0
1.2
1.4
1.6
1.8
2.0
2.2
2.4
2.6
10.0
11.0
12.0
13.0
14.0
15.0
16.0
17.0
4Q12 4Q13 4Q14 4Q15 4Q16E 4Q17E
Prime Ratings,A18-49
Ad-Supported Cable Aggregate (English-language) Broadcast Prime (5 Net Avg) Spanish-Language Aggregate
LINEAR TV AUDIENCES WILL CONTINUE TO DECLINE
Source: Nielsen7 /
-11%
-7%
-9%
-2%
-6%
-9%
-3%
We expect the average adult 18-49 primetime rating will be less than a 1.0 by next season
-7%
-8%
-5%
-14%
-4%
-5%
-12%
-7%
Ad-SupportedCableAggregate
BroadcastPrimeAverage
SpanishLanguageAggregate
9. WHILE LIVE TV IS STILL A BIG PART OF VIDEO CONSUMPTION, ON
DEMAND IS GROWING
9 / Source: MAGNA Estimates
Almost 40 percent of video viewing will go to streaming sources by 2021
70% 66%
61% 58% 56% 54% 53% 51% 51%
10%
10%
9%
9% 8% 8% 8% 7% 7%
3%
3%
3%
3%
3% 3% 3% 3% 3%
3%
4%
4%
4%
4% 4% 5% 5% 5%
2% 4%
6% 7% 8% 9% 10% 11% 11%
5% 5%
6% 7% 7% 8% 8% 8% 8%
7% 8% 10% 11% 12% 13% 14% 14% 14%
0%
10%
20%
30%
40%
50%
60%
70%
80%
90%
100%
2014E 2015E 2016E 2017E 2018E 2019E 2020E 2021E 2021E
Live TV DVR VOD Game Console (video) OTT Video PC Streaming Mobile streaming
Percent of Weekly Video Time, A18-49
11. MOST PEOPLE SKIP ADS WHEN THEY CAN (IT’S INGRAINED BEHAVIOR)
11 /
Source: MAGNA/IPGMedia Lab: “Turbo Charging Your Skippable Pre-RollCampaign
(Mobile/PC, skippable) Overall (15/30 sec) N = 1444, Skipped 15 sec N = 389, Skipped30 sec N = 544
65% 35%
AVERAGE # OF SECONDS PRIOR TO SKIPCOMPLETION RATE
15 Sec Ad 30 Sec Ad
5.5 Sec
Avg
7.4 Sec
Avg
Skipped Completed
12. GOOD NEWS: SKIPPED ADS STILL GARNER HIGH ATTENTION
12 / Source: MAGNA/IPGLab: “Turbo Charging Your Skippable Pre-Roll Campaign”
(PC only, 15/30 sec skippable)Skipped ads N = 109, Completed ads N = 119
100
80
60
40
20
1 2 3 4 5 6 7 8 9 10 11 12 13 14 15 16 17 18 19 20 21 22 23 24 25 26 27 28 29 30
VERY HIGH
HIGH
MODERATE
LOW
VERY LOW
AVERAGEATTENTION
Average Attention
Over Time For
Skipped and
Completed Ads
Skipped
Not Skipped
Based on eye
tracking data
TIME (SECONDS)
13. BUT THEY DON’T DRIVE BRAND METRICS AS WELL AS COMPLETED ADS
13 /
Source: MAGNA/IPGLab: “Turbo Charging Your Skippable Pre-Roll Campaign”
(Mobile/PC, 15/30 sec skippable) Skipped ads N = 933, Completed ads N = 511
▲ = Statistically significant difference between test and control at >= 90% confidence
A/B = Statistically significant difference between test groups at >= 90% confidence
PURCHASE INTENT BRAND
FAVORABILITY
BRAND IS
RELEVANT TO ME
IS A BRAND I
WOULD PAY MORE
FOR
IS A
PREMIUM BRAND
Skipped Ads - A Unskipped Ads - B
+0%
+12
%
▲A
+3%
+11%
▲A
+1%
+7%
▲A
+0%
+8%
▲A
+5%
+11%
▲A
Deltas(Test–Control)
Impact of Skipped Ads on Persuasion Metrics and Brand Attributes
14. WHAT TO DO? SUPPLEMENT WITH SHORT, NON-SKIPPABLE ADS
14 /
Source: MAGNA/IPGLab: “Turbo Charging Your Skippable Pre-Roll Campaign”
(Mobile/PC)6 second non-skippable ad N = 493, Skipped 15 and 30 second ads N = 933
▲= Statistically significant difference between test and control at >= 90% confidence / A/B = Statistically significant difference between test groups at >= 90% confidence
+47%▲A
+11%▲A
Impact of 6 Second Ads on Brand Metrics
Skipped Ad - A 6 Sec Non-Skippable Ad - B
+22%▲
+12%▲A
+5%
Aided Brand Recall Brand Favorability Purchase Intent
Deltas(Test–Control)
+ 0%
15. TELL A STORY, AND PUSH BRANDING EARLY ON
15 /
Source: MAGNA/IPGLab: “Turbo Charging Your Skippable Pre-Roll Campaign”
(PC only, 15 sec skippable) Story Focused N = 102, Product Focused N = 94
▲= Statistically significant difference between test and control at >= 90% confidence
A/B = Statistically significant difference between test groups at >= 90% confidence
Story Focused - A Product Focused - B
+22%▲B +22%▲B
+8%
+10%
BRAND FAVORABILITY BRAND I WOULD RECOMMEND
Story-focused ads improve brand metrics, and early story arcs improve recall
16. LASTLY, TAP INTO THE VIEWER’S EMOTIONS
16 /
Source: MAGNA/IPGLab: “Turbo Charging Your Skippable Pre-Roll Campaign”
(PC only, 15 sec skippable) High Emotion N = 279, Low Emotion N = 257
▲= Statistically significant difference between test and control at >= 90% confidence
A/B = Statistically significant difference between test groups at >= 90% confidence
HIGH EMOTION - A
+44%▲B
LOW EMOTION - B
+36%▲
Impact of Emotional Ads on Brand Recall: Deltas (Test – Control)
18. HULU AUDIENCE CHARACTERISTICS
Sources: Hulu, Nielsen, ComScore, Simmons18 /
MedianAge
Hulu: 33
Broadcast Prime: 56
Cable Prime: 50
Median Income
Hulu: $84,000
Broadcast Prime: $61,300
Cable Prime: $56,200
Marital Status
Hulu: 53% Married
Broadcast Prime: 72% Married
Cable Prime: 83% Married
Presence of Children
Hulu: 50% HaveChildren
Broadcast Prime: 25% Have Children
Cable Prime: 34% HaveChildren
Employment Status
Hulu: 60% FullTime
Broadcast Prime: 69% FullTime
Cable Prime: 82% FullTime
Live in or Around Cities
Hulu: 75%
Broadcast Prime: 71% Cable
Prime: 67%
19. THE TV SET IS FAR AND AWAY THE PREFERRED EXPERIENCE FOR HULU VIEWERS
19 /
NOW
9%
16%
75%
+233%
LIVING ROOM
GROWTH
7.9
AVERAGE DEVICES
A HULU VIEWER
OWNS
4.6
AVERAGE DEVICES
ON WHICH A HULU
VIEWER STREAMS
2014
18%
28%
54%
living room
PC
mobile
42%
34%
19%
5%
SET TOP
BOX (E.G.
ROKU)
GAME
CONSOLE
SMART TV
BLU RAY
SOURCE: HULU INTERNAL DATA, DECEMBER 2016; HULU VIEWER SURVEY, EPOLL, JAN 2017
Mobile usage has remained fairly steady for those on the go
20. HULU CASE STUDY: QSR CLIENT
20 / Source: Hulu/MAGNACross Platform Study
PC Studies Cross Platform Study
Brand Metrics PC Overall PC OTT Mobile
AidedAwareness -0.1% 13.1% 12.8% 15.0% 8.6%
Online AdAwareness 10.8% 8.8% 9.9% 9.0% 7.5%
Brand Favorability -6.7% 10.6% -1.1% 13.1% 12.1%
Purchase Intent -6.4% 8.9% 7.0% 8.0% 12.7%
*All values are expressed as percentage lifts when comparing exposed against control
OTT proven better at driving awareness and favorability than other platforms
21. ROKU AUDIENCE CHARACTERISTICS
21 /
Household Income
Education
Marital Status
Age Breakout
84% 88%
16% 12%
Roku Linear TV
Married Single 18-20 21-24 25-29 30-34 35-39 40-44 45-49 50-54 55-64 65+
Roku Linear TV
31%
37%
32%
HS
Some College
4+ years College
Roku Linear TV
30%
37%
32%
$15K - $25K
$25K - $35K
$35K - $50K
$50K - $75K
$75K - $100K
$100K - $125K
$125K - $150K
$150K - $175K
$175K - $200K
$200K - $250K
$250K+
Linear TV Roku
Sources: Roku, Nielsen, Simmons
22. CONNECTED TV = TV WITHOUT THE CLUTTER
22 /
9+B
Hours
40+%YoY
growth
Source: IPG Media Lab/YuMe, 2012
23. ROKU CASE STUDIES
Source: Roku/Millward Brown Digital, Roku/Interpret
23 /
Casual Dining Restaurant,A25-54Target
43% lift in awareness about special
Halloween promotion
19%
lift in brand favorability
17%
lift in visitation intent
3X increase in unaided awareness
2 in 3
Exposed respondents considered
brand “very good” or “excellent”
3X lift in recent purchase
Beverage (Non-Alcoholic), Multicultural
MillennialTarget
25. WE STILL DON’T HAVE CONSISTENT, COMPLETE CROSS PLATFORM MEASUREMENT
25 /
Mobile and OTT are the areas where the industry is lacking, especially when it
comes to de-duplication
Publishers and networks are fatigued by all the different tags, SDKs, and
watermarks required to measure their content
We NEED a single, open source, industry standard identifier to both recognize ads
and content, and capture duration of viewing
CIMM has gone a long way toward solving this with theirTAXI initiative, but some
additional features are needed