Downloaded 52 times

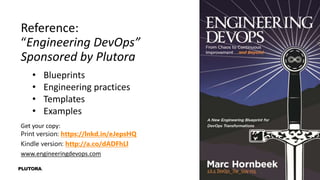
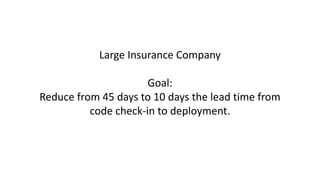
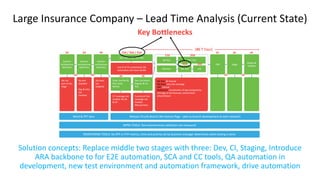
![Large Insurance Company – Lead Time (Current State)
Goal: 10 days lead time check-in to deploy.
[45 ? Days]
Word & PPT docs
INFRA TOOLS: Test environments utilization not measured
MONITORING TOOLS: No RTP or PTP metrics, time and priority set by business manager determines when testing is done
Solution
Architecture
Definition
5d
QA not
part of this
stage
Solution
Architecture
Definition
4h
QA tasks
not
assigned
2d
Release (Trunk) Branch (No feature flags – plan to branch development at each release!)
Deploy &
Validate
xh
Manual
Stage
xh
Manual
CRB
xh
Manual
Solution
Architecture
Definition
2d
No test
checklist
Ops & Infra
not
involved
4d xh xh
QA / UAT / Perf Test Plan
10d / 20d / 55d
Low % of TCs automated, QA
automation test team decide
Code, DevTest &
Peer Code
Review
Dev Functional,
Regress & Int.
Test
UT coverage not
tracked. No SA
& CR
Functional Test
coverage not
tracked.
Manual tests.
xh xh
QA Test
QA Auto
Perf Test
E2E Test UAT
QA Test: all manual
QA Auto: very low coverage
UAT: manual
Bottleneck: coordination of app components,
shortage of tool licenses, environment
setup/release
15d 20d
40d 20d](https://image.slidesharecdn.com/valuestreammappingwebinar2v1-191206182003/85/Secrets-of-Value-Stream-Mapping-for-Future-State-14-320.jpg)
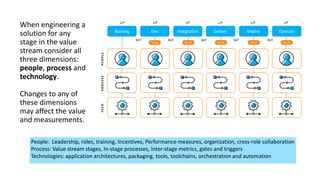
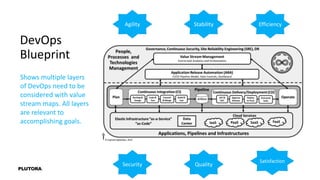
![Large Insurance Company – Lead Time (Future State)
[10 days]
4h
Jira, Slack
Backlog
Include infra &
tests and
assignments
Dev
Feature flags, TDD,
100% UT, 100%
SCA, Create
automated smoke
& regress tests,
test environment
orchestration
CI
Trigger integration
builds from
commit, automate
smoke tests and
regression
Acceptance
Automate 85%
UAT, Performance,
& E2E system
regression, test
environment
orchestration
Delivery
Delivery & CRB:
Automate deployment tests and release criterion
Deploy:
Containers and cluster management, use APM, Green/Blue & A/B
testing
CRB Deploy
Release (Trunk) Branch (with feature flags)
INFRA TOOLS: Slack and Jira for communication flow, Application Release Automation tool, test automation/test environment orchestration and
containers tools, VRA
MONITORING TOOLS: Jira, ARA, Splunk, APT, SLIs, SLOs
10d 3d 5d 1d 1d 4h
1d 2h 2h 2h 2h 2h
Product Activity](https://image.slidesharecdn.com/valuestreammappingwebinar2v1-191206182003/85/Secrets-of-Value-Stream-Mapping-for-Future-State-20-320.jpg)
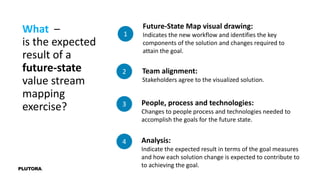


The document discusses the use of future-state value stream mapping (FSVSM) in improving DevOps and software delivery processes. It outlines the importance of FSVSM, the steps to create one, and various strategies for identifying solutions to bottlenecks in value streams. Additionally, it emphasizes the need to consider people, processes, and technology when implementing improvements and highlights a case study from a large insurance company aiming to reduce lead time from 45 days to 10 days.


![5G Explained! A High Level Overview [Introduction]](https://cdn.slidesharecdn.com/ss_thumbnails/5gexplainedahighleveloverview-260119165306-cc137a3e-thumbnail.jpg?width=640&height=640&fit=bounds)


