Introduction to Flowcharts
●Aflowchart is a visual
representation of a process.
●It helps to make complex processes
easier to understand.
●We use different shapes to
represent different steps.
4.
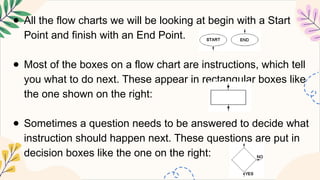
● All theflow charts we will be looking at begin with a Start
Point and finish with an End Point.
● Most of the boxes on a flow chart are instructions, which tell
you what to do next. These appear in rectangular boxes like
the one shown on the right:
● Sometimes a question needs to be answered to decide what
instruction should happen next. These questions are put in
decision boxes like the one on the right:
5.
Why Use Flowcharts?
●Flowcharts simplify
complex tasks.
● They help everyone
understand the process
the same way.
● They make it easier to
spot mistakes or
improvements.
6.
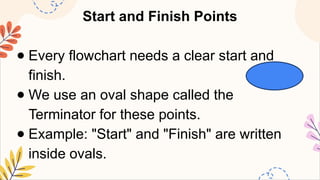
Start and FinishPoints
● Every flowchart needs a clear start and
finish.
● We use an oval shape called the
Terminator for these points.
● Example: "Start" and "Finish" are written
inside ovals.
7.
Input and Output
●Input is information we get to solve the
problem.
● Output is the result or information we give
out.
● We use a parallelogram to show input and
output.
8.
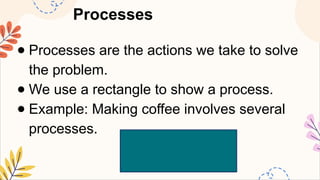
Processes
● Processes arethe actions we take to solve
the problem.
● We use a rectangle to show a process.
● Example: Making coffee involves several
processes.
9.
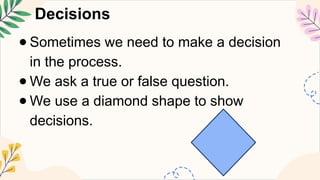
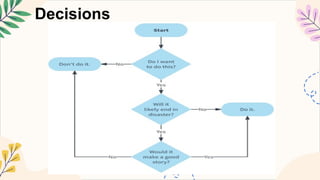
Decisions
● Sometimes weneed to make a decision
in the process.
● We ask a true or false question.
● We use a diamond shape to show
decisions.
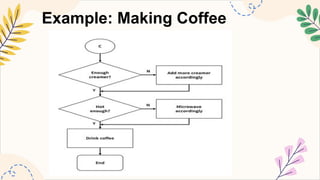
Example: Making Coffee
●Start: Ask mom how she likes her coffee.
● Input: Get the coffee ingredients.
● Process: Make the coffee.
● Decision: Does mom want milk?
● Output: Serve the coffee.
● Finish: Say "Coffee is ready!"
● Create aflowchart based on the following
situation
a. Safely crossing the street.
b. Stop working on a computer and shutting it
down.
c. Steps for working out 4.72 divided by 1.18
on a calculator.
d. Playing snake and ladder.
18.
Review and Practice
●Whyare flowcharts useful?
●What shapes do we use for start
and finish?
●How do we show input and
output?
19.
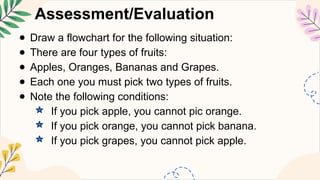
Assessment/Evaluation
● Draw aflowchart for the following situation:
● There are four types of fruits:
● Apples, Oranges, Bananas and Grapes.
● Each one you must pick two types of fruits.
● Note the following conditions:
If you pick apple, you cannot pic orange.
If you pick orange, you cannot pick banana.
If you pick grapes, you cannot pick apple.
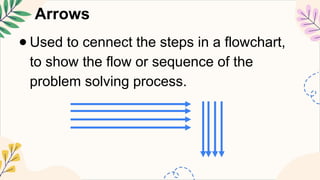
Editor's Notes
#1 Created from: https://www.youtube.com/watch?v=KOiISYSt7xE