Download to read offline
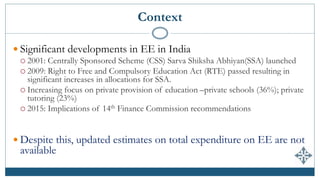
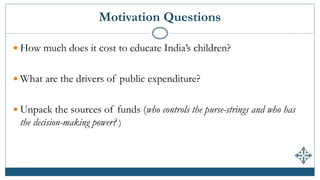
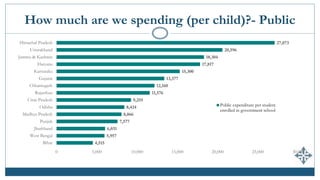
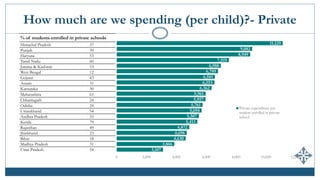
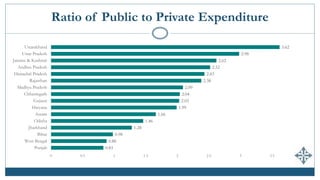
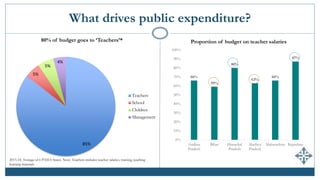
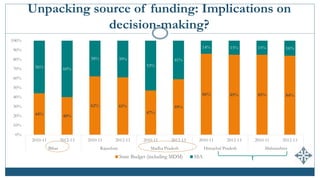

The document discusses India's expenditures on elementary education, highlighting significant policy developments such as the Sarva Shiksha Abhiyan in 2001 and the Right to Education Act in 2009 that increased funding. It provides insights into public and private spending per child, enrollment in private schools, and emphasizes the predominance of teacher salaries within educational budgets. Despite substantial allocations, updated comprehensive estimates of total expenditure on elementary education in India remain unavailable.