Download as PDF, PPTX

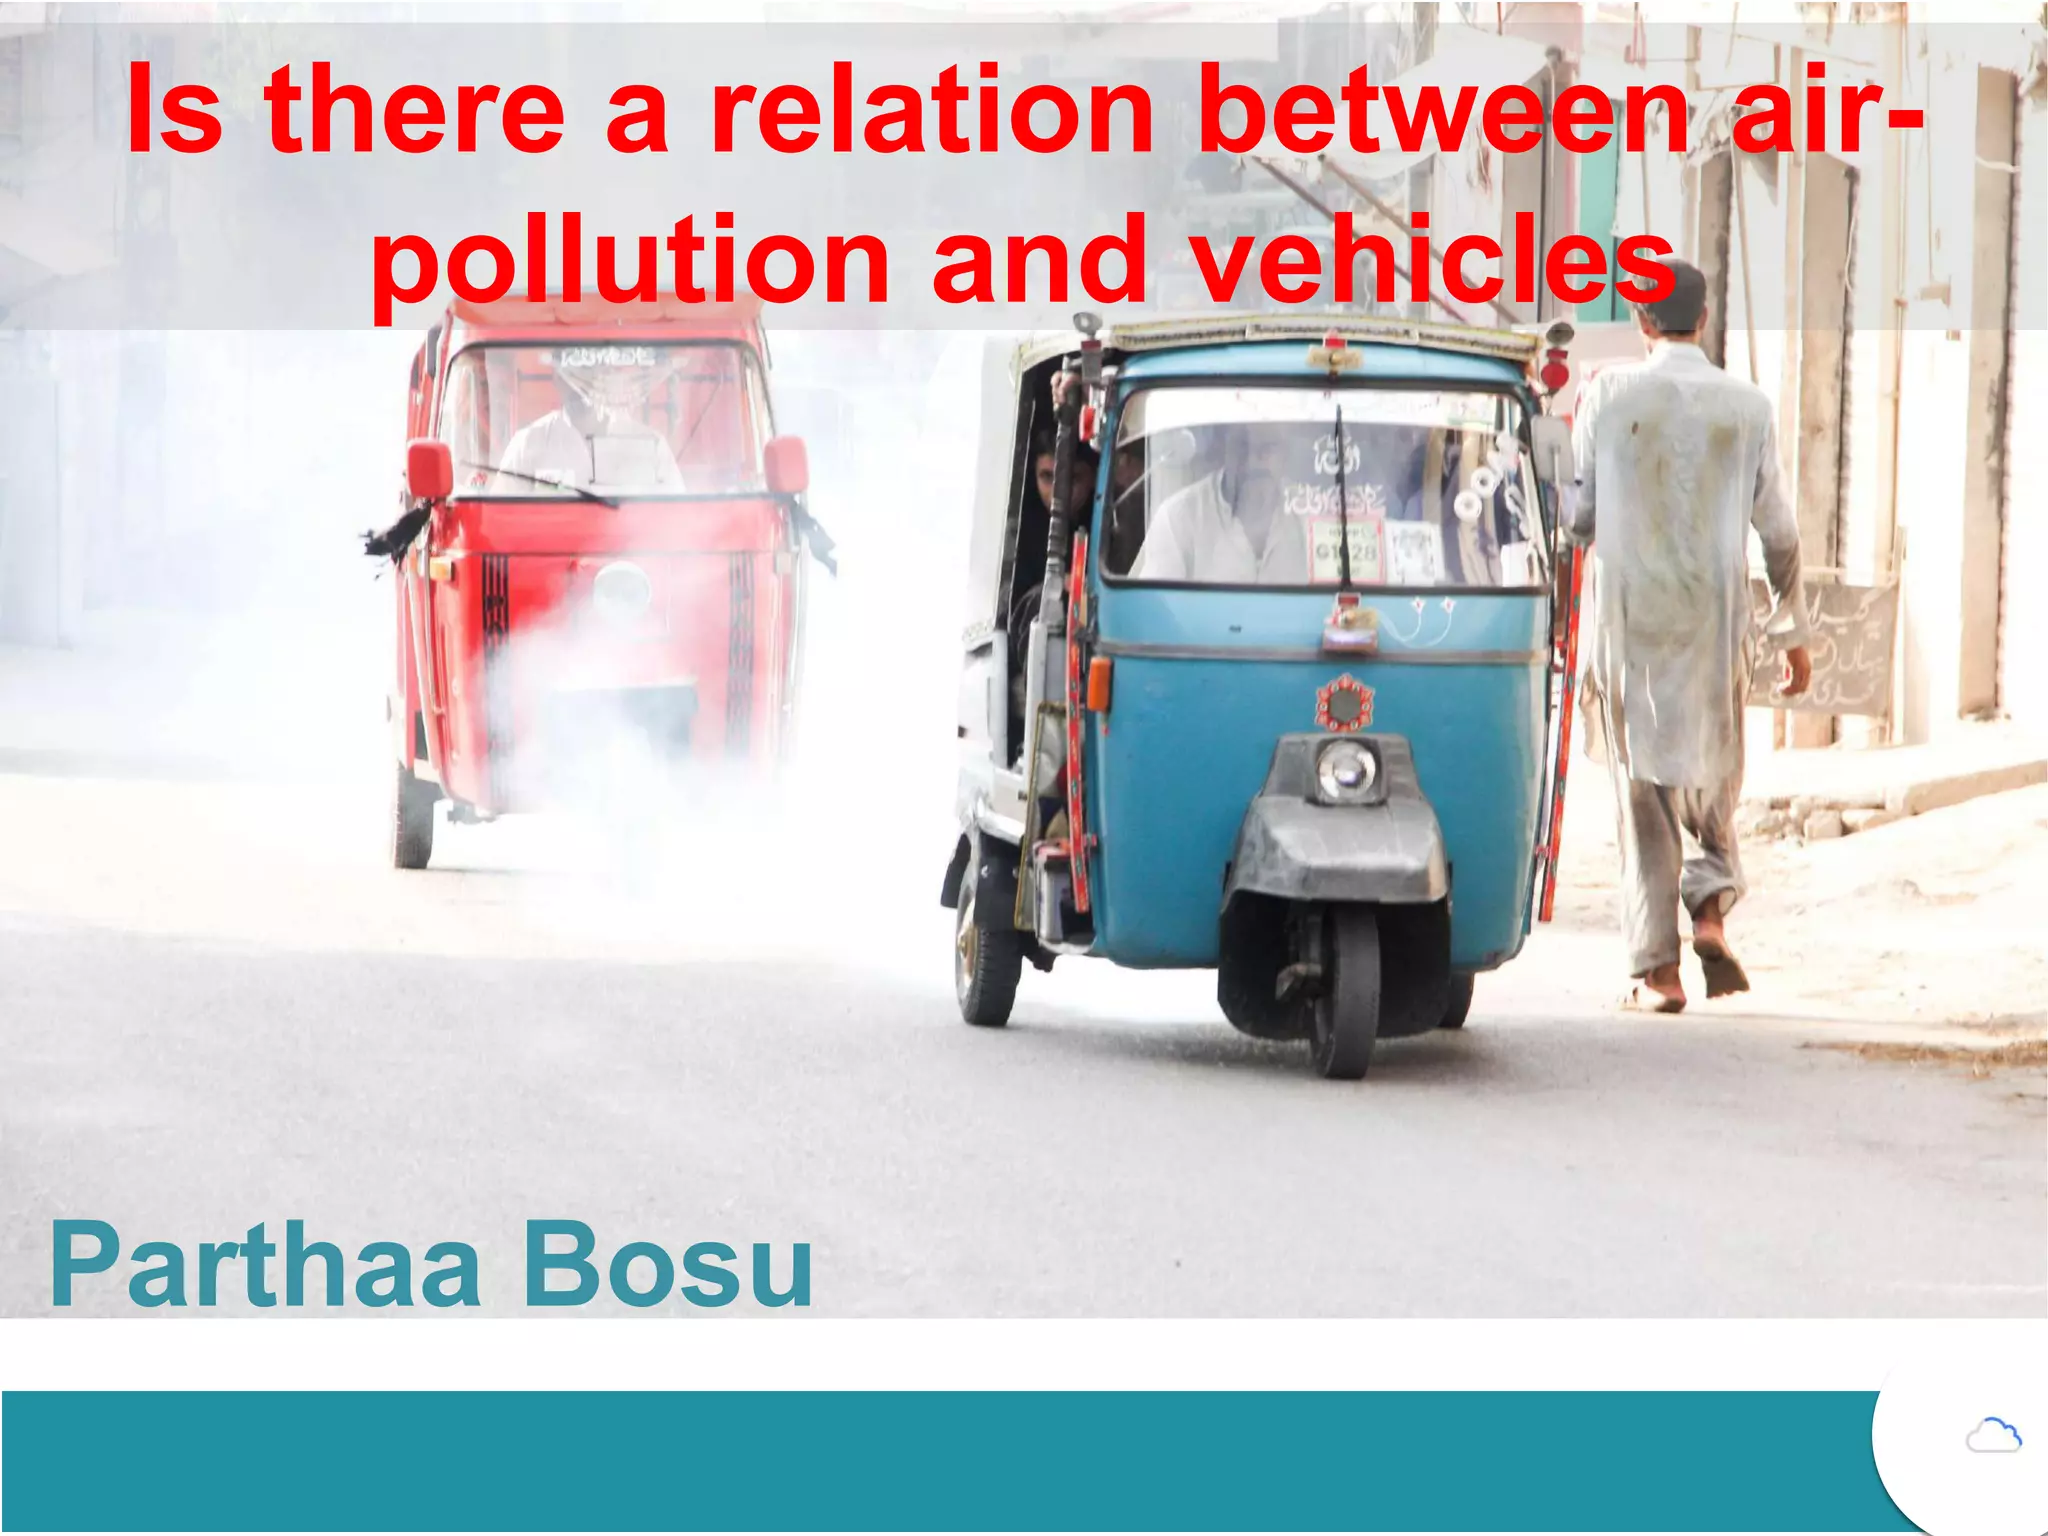
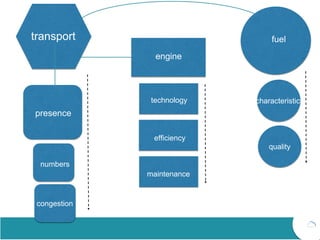
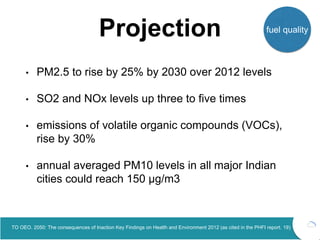

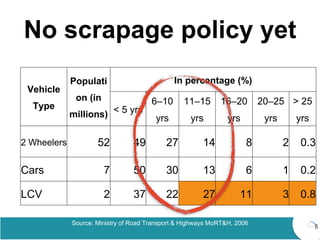

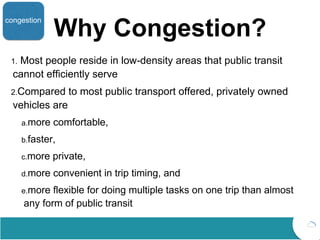

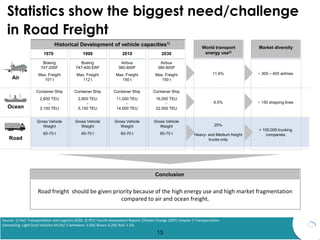
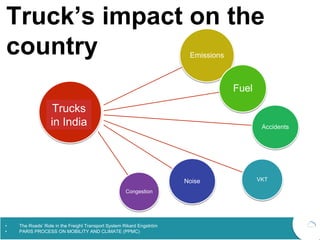

This document discusses the relationship between air pollution and vehicles in India. It finds that vehicle emissions are projected to significantly increase levels of particulate matter and other pollutants by 2030 without intervention. Current challenges include outdated vehicle standards, use of dirty fuels, lack of effective inspections, and real-world emissions exceeding lab tests. Road congestion is exacerbated by low-density development patterns and limitations of public transit compared to private vehicles. Shifting more freight transport from road to rail could help reduce energy use and emissions given road freight's high fragmentation in India.


