Download as PDF, PPTX


![Multiple paste buffers
$ tmux list-buffers
C-b #
!
$ tmux paste-buffer
C-b ]](https://image.slidesharecdn.com/tmux-20rocks-140114084317-phpapp02/85/TMUX-Rocks-39-320.jpg)

![Powerful mouse mode support
Resize Pane
Select Pane[1]
Select Window
1. screen can do “select pane” only](https://image.slidesharecdn.com/tmux-20rocks-140114084317-phpapp02/85/TMUX-Rocks-41-320.jpg)

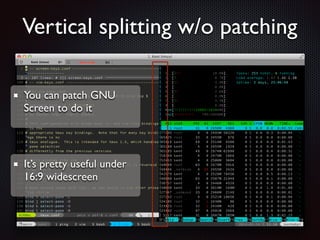


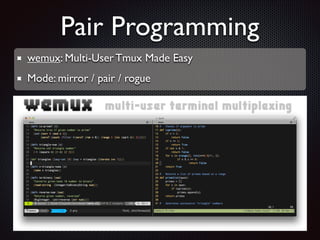
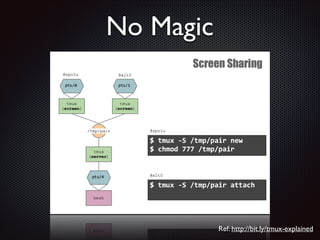

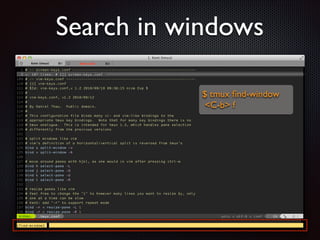

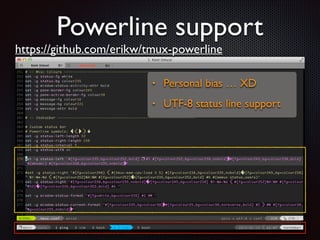


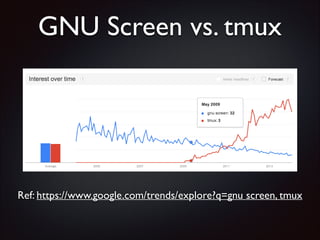
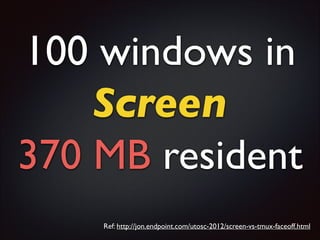
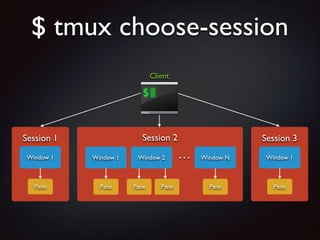
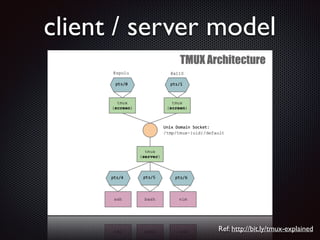
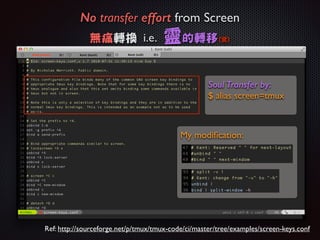
The document discusses the advantages of using tmux over gnu screen, highlighting several significant limitations of screen such as high memory usage and lack of active development. It showcases tmux's features, including flexible session management, multiple paste buffers, and support for shared sessions, which enhance user productivity. Additionally, it includes various tips and tricks for optimizing the use of tmux in terminal environments.