This document defines key hospital and statistical terms and outlines how hospital statistics are calculated and reported. It discusses that hospital statistics are collected data on hospital utilization and patient morbidity and mortality that provide important information for health planning and management. It describes the two main categories of hospital statistics as administrative statistics, which include data on hospital resources, services, and surgical procedures, and morbidity and mortality statistics, which analyze leading causes of patient illness and death. Required data sources and examples of specific hospital indicators that can be calculated are also provided.


![ Hospital report forms
1. Form I [Monthly hospital return (administrative)]
2. Form II (Monthly general inpatient summary)
3. Form III [Hospital daily record (inpatient)]
4. Outpatient report form](https://image.slidesharecdn.com/hospstat-170623040509/85/Hosp-stat-14-320.jpg)
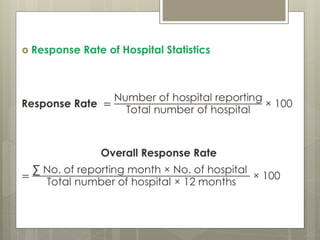
![Some required data to calculate Hospital Statistics
1. Population (in catchment area)
2. Total No. of hospital
3. Sanctioned bed
4. Available bed
5. Out patient attendance
6. Admission
7. Discharge
8. Death
9. Patient day [The unit of measure which denotes
in days the service given to in-patient(s)]
(ie. Patient × day)](https://image.slidesharecdn.com/hospstat-170623040509/85/Hosp-stat-23-320.jpg)

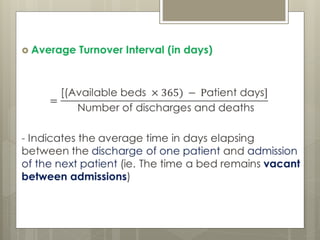
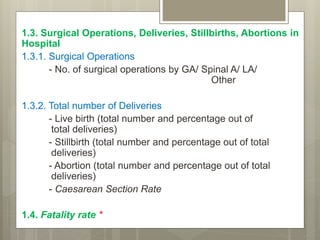
![ Example:
- In a 300 bedded hospital, potential hospitalization days in
a year are 300 × 365 = 109,500
- If actual totaled-up hospitalization days are 98,200 and
number of discharges including deaths in that year are
5,680
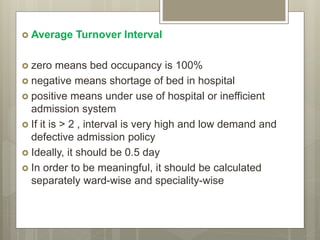
Average Turnover Interval
=
[(Available beds × 365) − Patient days]
Number of discharges and deaths
=
109500 − 98200
5680
= 1.989 days
It means each bed remained vacant for 2 days in that year
bet. one discharge and next admission.](https://image.slidesharecdn.com/hospstat-170623040509/85/Hosp-stat-33-320.jpg)