Download to read offline
![[Price for scheduled purchasing]
Arbitrarily made
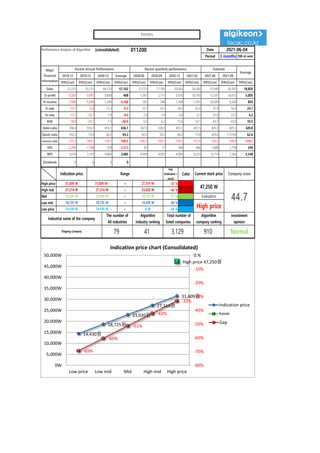
Algorithm stocks Trading Strategies (consolidated) 011200 Date
Period
Gap
(Indication /
stock)
Color
2021-06-04
3 months
Current stock price Evaluation
Stock price rise
probability score
Investment opinion Prospective purchase amount
47,250 W High price 37.9 Normal 4,000,000 W
Suggested Purchase
Amount 1,191,358 W
Number of stocks
purchased 25
Indication price Range Buying / Selling Buying / Selling [Stocks]
High price 31,609 W 31,609 W~ ~ 27,314 W -33 % 394,367 W 12
High mid 27,314 W 27,314 W ~ 23,020 W -42 % 502,654 W 18
Mid 23,020 W 23,020 W ~ 18,725 W -51 % 610,941 W 27
Low mid 18,725 W 18,725 W ~ 14,430 W -60 % 719,229 W 38
low price 14,430 W 14,430 W ~ 0 W -69 % 827,516 W 57
Stock price rise
probability score
A Sector 49.2 48.4 46.7 48.4 50.4 46.1
37.9
B Sector 56.7 37.5 53.8 48.4 16.7 44.6
Total average
2021.01.07 2021.02.04 2021.03.09 2021.04.06 2021.05.04 2021.06.03
52.9 43.0 50.2 30.8 33.5 45.4
8 % 26 %
2021.02.04 2021.03.09 2021.04.06 2021.05.04 2021.06.03
Total of
increase rate
Total score
A Sector -2 % -4 % 4 % 4 % -9 %
-8 % 44.0
B Sector -51 % 30 % -11 % -191 % 63 %
Total average -23 % 14 % -63 %
49 48 47 48 50
46
57
38
54
48
17
45
53
43
50
31
34
45
0
10
20
30
40
50
60
2021.01.07 2021.02.04 2021.03.09 2021.04.06 2021.05.04 2021.06.03
Stock price rise probability score
A sector
B sector
Total average
-2% -4% 4% 4% -9%
-51%
30%
-11%
-191%
63%
-23%
14%
-63%
8%
26%
-250%
-200%
-150%
-100%
-50%
0%
50%
100%
2021.02.04 2021.03.09 2021.04.06 2021.05.04 2021.06.03
Increase rate of stock price rise
A sector
B sector
Total average
hmm](https://image.slidesharecdn.com/hmm011200algorithminvestmentreport-210604003214/85/hmm-011200-Algorithm-Investment-Report-2-320.jpg)

This document provides a performance analysis of the Algorithm company over several periods from 2018-2021. It includes key financial metrics such as sales, operating profit, net income, operating rate, net rate, and debt ratio. It also analyzes the company's stock price performance and provides an indication price range. Additional sections provide trading strategy recommendations, including suggested purchase amounts and price ranges to buy stock. The document is intended to help users make investment decisions but notes the analysis may change over time and the user is responsible for investment outcomes.


![[헥토파이낸셜]hectofinancial 234340 Algorithm Investment Report](https://cdn.slidesharecdn.com/ss_thumbnails/hectofinancial234340algorithminvestmentreport-250917010057-0603ecf0-thumbnail.jpg?width=640&height=640&fit=bounds)
![[ls머트리얼즈]LS Materials 417200 Algorithm Investment Report](https://cdn.slidesharecdn.com/ss_thumbnails/lsmaterials417200algorithminvestmentreport-260202182715-66072c7b-thumbnail.jpg?width=640&height=640&fit=bounds)
![[롯데웰푸드]lottewell food 280360 Algorithm Investment Report](https://cdn.slidesharecdn.com/ss_thumbnails/lottewellfood280360algorithminvestmentreport-251010014427-e0439c3a-thumbnail.jpg?width=640&height=640&fit=bounds)
![[동원산업]dongwon industries 006040 Algorithm Investment Report](https://cdn.slidesharecdn.com/ss_thumbnails/dongwonindustries006040algorithminvestmentreport-251003020532-5dd00f8a-thumbnail.jpg?width=640&height=640&fit=bounds)
![[동서]dongsuh 026960 Algorithm Investment Report](https://cdn.slidesharecdn.com/ss_thumbnails/dongsuh026960algorithminvestmentreport-251001020056-e986a251-thumbnail.jpg?width=640&height=640&fit=bounds)


![[쿠콘]coocon 294570 Algorithm Investment Report](https://cdn.slidesharecdn.com/ss_thumbnails/coocon294570algorithminvestmentreport-250926162409-bd6c1593-thumbnail.jpg?width=640&height=640&fit=bounds)
![[웹케시]webcash 053580 Algorithm Investment Report](https://cdn.slidesharecdn.com/ss_thumbnails/webcash053580algorithminvestmentreport-250925003052-f31dd73c-thumbnail.jpg?width=640&height=640&fit=bounds)
![[휴림로봇]hyulimrobot 090710 Algorithm Investment Report](https://cdn.slidesharecdn.com/ss_thumbnails/hyulimrobot090710algorithminvestmentreport-250923234005-7edfe548-thumbnail.jpg?width=640&height=640&fit=bounds)


![[더즌]dozn 462860 Algorithm Investment Report](https://cdn.slidesharecdn.com/ss_thumbnails/dozn462860algorithminvestmentreport-250920161038-b31c0a65-thumbnail.jpg?width=640&height=640&fit=bounds)

![[한국공항]Korea Airport Service 005430 Algorithm Investment Report](https://cdn.slidesharecdn.com/ss_thumbnails/koreaairportservice005430algorithminvestmentreport-250915064019-e6873549-thumbnail.jpg?width=640&height=640&fit=bounds)
![[대상]Daesang 001680 Algorithm Investment Report](https://cdn.slidesharecdn.com/ss_thumbnails/daesang001680algorithminvestmentreport-250915063303-81c41298-thumbnail.jpg?width=640&height=640&fit=bounds)
![[삼성중공업] Samsung Heavy Industries 010140 Algorithm Investment Report](https://cdn.slidesharecdn.com/ss_thumbnails/samsungheavyindustries010140algorithminvestmentreport-250904015122-fe022f35-thumbnail.jpg?width=640&height=640&fit=bounds)
![대상 001680 알고리즘 기업분석 보고서 [알고리즘 기업분석 컨설팅-알기컨]](https://cdn.slidesharecdn.com/ss_thumbnails/001680-250303132112-443c504a-thumbnail.jpg?width=640&height=640&fit=bounds)
![[삼성전자]samsung electronics 005930 Algorithm Investment Report](https://cdn.slidesharecdn.com/ss_thumbnails/samsungelectronics005930algorithminvestmentreport-250227014600-4fa86dc7-thumbnail.jpg?width=640&height=640&fit=bounds)
![[동서]dongsuh 026960 Algorithm Investment Report](https://cdn.slidesharecdn.com/ss_thumbnails/dongsuh026960algorithminvestmentreport-250226011658-61b0afaa-thumbnail.jpg?width=640&height=640&fit=bounds)
![동원fnb 049770 알고리즘 기업분석 보고서 [알고리즘 기업분석 컨설팅-알기컨]](https://cdn.slidesharecdn.com/ss_thumbnails/fnb049770-250224032312-db728faf-thumbnail.jpg?width=640&height=640&fit=bounds)


