ccs 066790 Algorithm Investement Report
•
0 likes•3 views

This document provides a summary of financial performance and stock price analyses for an algorithm company over several periods from 2020-2023. It includes consolidated sales, operating profit, net income, debt ratio, and other key financial metrics. Estimated stock price ranges and purchase amounts are also presented based on the company's current stock price compared to indication price ranges. Probability scores for stock price increases are shown for two sectors over multiple dates along with increase rates. Compliance information is also included at the end.
![[Price for scheduled purchasing]
Arbitrarily made
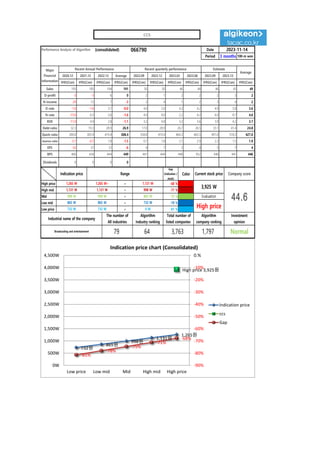
Algorithm stocks Trading Strategies (consolidated) 066790 Date
Period
Gap
(Indication /
stock)
Color
2023-11-14
3 months
Current stock price Evaluation
Stock price rise
probability score
Investment opinion Prospective purchase amount
3,925 W High price 46.2 Normal 3,000,000 W
Suggested Purchase
Amount 853,493 W
Number of stocks
purchased 217
Indication price Range Buying / Selling Buying / Selling [Stocks]
High price 1,265 W 1,265 W~ ~ 1,131 W -68 % 578,518 W 457
High mid 1,131 W 1,131 W ~ 998 W -71 % 607,482 W 537
Mid 998 W 998 W ~ 865 W -75 % 636,447 W 638
Low mid 865 W 865 W ~ 732 W -78 % 665,411 W 769
low price 732 W 732 W ~ 0 W -81 % 694,376 W 949
Stock price rise
probability score
A Sector 47.5 45.5 49.2 54.3 60.4 45.7
46.2
B Sector 13.3 32.5 46.5 54.3 20.0 27.1
Total average
2023.06.16 2023.07.14 2023.08.11 2023.09.11 2023.10.16 2023.11.13
30.4 39.0 47.8 31.7 40.2 36.4
21 % -11 %
2023.07.14 2023.08.11 2023.09.11 2023.10.16 2023.11.13
Total of
increase rate
Total score
A Sector -4 % 8 % 9 % 10 % -32 %
0 % 52.0
B Sector 59 % 30 % 14 % -172 % 26 %
Total average 22 % 18 % -51 %
47 45
49
54
60
46
13
33
46
54
20
27
30
39
48
32
40
36
0
10
20
30
40
50
60
70
2023.06.16 2023.07.14 2023.08.11 2023.09.11 2023.10.16 2023.11.13
Stock price rise probability score
A sector
B sector
Total average
-4%
8% 9% 10%
-32%
59%
30%
14%
-172%
26%
22% 18%
-51%
21%
-11%
-200%
-150%
-100%
-50%
0%
50%
100%
2023.07.14 2023.08.11 2023.09.11 2023.10.16 2023.11.13
Increase rate of stock price rise
A sector
B sector
Total average
ccs](data:image/gif;base64,R0lGODlhAQABAIAAAAAAAP///yH5BAEAAAAALAAAAAABAAEAAAIBRAA7)
Recommended
Recommended
More Related Content
Similar to ccs 066790 Algorithm Investement Report
Similar to ccs 066790 Algorithm Investement Report (20)
More from 알고리즘 기업분석 컨설팅-알기컨,algikeon
More from 알고리즘 기업분석 컨설팅-알기컨,algikeon (20)
Recently uploaded
Recently uploaded (8)
ccs 066790 Algorithm Investement Report
- 1. Performance Analysis of Algorithm (consolidated) 066790 Date Period 3 months 100-m won 2020.12 2021.12 2022.12 Average 2022.09 2022.12 2023.03 2023.06 2023.09 2023.12 IFRS(Con) IFRS(Con) IFRS(Con) IFRS(Con) IFRS(Con) IFRS(Con) IFRS(Con) IFRS(Con) IFRS(Con) IFRS(Con) IFRS(Con) Sales 193 185 194 191 50 50 46 48 46 45 49 O-profit -3 -3 6 0 2 1 2 2 2 3 2 N-income -29 12 7 -3 2 4 1 2 3 4 2 O-rate -1.6 -1.6 3.1 -0.0 4.0 2.0 4.3 4.2 4.9 5.8 3.6 N-rate -15.0 6.5 3.6 -1.6 4.0 8.0 2.2 4.2 6.0 8.7 4.6 ROE -11.0 4.9 2.8 -1.1 3.2 4.8 3.2 3.6 3.9 4.2 3.7 Debt-ratio 32.3 19.3 28.9 26.9 17.0 28.9 26.7 26.5 33.1 41.4 24.8 Quick-ratio 200.0 305.9 419.4 308.4 358.8 419.4 464.3 465.5 491.0 518.3 427.0 reserve-ratio -5.7 -0.7 1.8 -1.5 0.7 1.8 2.1 2.9 2.2 1.5 1.9 EPS -52 21 12 -6 4 7 2 4 5 7 4 BPS 469 434 444 449 441 444 448 452 446 441 446 Dividends 0 0 0 0 2023-11-14 Major Financial Information Recent Annual Performance Recent quarterly performance Estimate Average Gap (Indication / stock) Color High price ~ -68 % High mid ~ -71 % Mid ~ -75 % Low mid ~ -78 % Low price ~ -81 % Indication price Range Current stock price Company score 1,131 W 1,131 W 998 W 998 W 998 W 865 W Evaluation 1,265 W 1,265 W~ 1,131 W 3,925 W 44.6 865 W 865 W 732 W High price Normal 732 W 732 W 0 W Industrial name of the company The number of All industries Algorithm Industry ranking Total number of listed companies Algorithm company ranking Investment opinion Broadcasting and entertainment 79 64 3,763 1,797 732원 865원 998원 1,131원 1,265원 High price 3,925원 -81% -78% -75% -71% -68% -90% -80% -70% -60% -50% -40% -30% -20% -10% 0.% 0W 500W 1,000W 1,500W 2,000W 2,500W 3,000W 3,500W 4,000W 4,500W Low price Low mid Mid High mid High price Indication price chart (Consolidated) Indication price ccs Gap ccs
- 2. [Price for scheduled purchasing] Arbitrarily made Algorithm stocks Trading Strategies (consolidated) 066790 Date Period Gap (Indication / stock) Color 2023-11-14 3 months Current stock price Evaluation Stock price rise probability score Investment opinion Prospective purchase amount 3,925 W High price 46.2 Normal 3,000,000 W Suggested Purchase Amount 853,493 W Number of stocks purchased 217 Indication price Range Buying / Selling Buying / Selling [Stocks] High price 1,265 W 1,265 W~ ~ 1,131 W -68 % 578,518 W 457 High mid 1,131 W 1,131 W ~ 998 W -71 % 607,482 W 537 Mid 998 W 998 W ~ 865 W -75 % 636,447 W 638 Low mid 865 W 865 W ~ 732 W -78 % 665,411 W 769 low price 732 W 732 W ~ 0 W -81 % 694,376 W 949 Stock price rise probability score A Sector 47.5 45.5 49.2 54.3 60.4 45.7 46.2 B Sector 13.3 32.5 46.5 54.3 20.0 27.1 Total average 2023.06.16 2023.07.14 2023.08.11 2023.09.11 2023.10.16 2023.11.13 30.4 39.0 47.8 31.7 40.2 36.4 21 % -11 % 2023.07.14 2023.08.11 2023.09.11 2023.10.16 2023.11.13 Total of increase rate Total score A Sector -4 % 8 % 9 % 10 % -32 % 0 % 52.0 B Sector 59 % 30 % 14 % -172 % 26 % Total average 22 % 18 % -51 % 47 45 49 54 60 46 13 33 46 54 20 27 30 39 48 32 40 36 0 10 20 30 40 50 60 70 2023.06.16 2023.07.14 2023.08.11 2023.09.11 2023.10.16 2023.11.13 Stock price rise probability score A sector B sector Total average -4% 8% 9% 10% -32% 59% 30% 14% -172% 26% 22% 18% -51% 21% -11% -200% -150% -100% -50% 0% 50% 100% 2023.07.14 2023.08.11 2023.09.11 2023.10.16 2023.11.13 Increase rate of stock price rise A sector B sector Total average ccs
- 3. 정보와 완전 정보 결 투자판단 있습니 위배 무단으 숙지하 Compliance notice ① The information provided by The Algorithm Company Analysis Consulting is obtained through reliable data and information and The Algorithm Company Analysis Program (TACAP), but its accuracy or completeness are not guaranteed. Furthermore, it may change over time.Therefore, we are not legally responsible for the results of the data provided by The Algorithm Company Analysis Consulting because of information errors or omissions. ② The Algorithm Company Analysis Consulting and all the information provided on it site are reference materials for investment decisions and the final responsibility of investment is up to users utilizing this information. ③ The Algorithm Company Analysis Consulting and its site do not do anything that violates the related laws such as discretionary transaction. ④ Users can not reallocate and recycle the information provided by The Algorithm Company Analysis Consulting firm let alone the information provided by its Site. ⑤ Be sure to know about application period of this algorithm analysis report in order to improve its accuracy. Tel : 070 - 4667 - 5009 Email : tacac@tacac.co.kr Homepage : tacac.co.kr blog.naver.com/tacac SERVICES M&A, IPO, RECOVER, CORPORATE RESTRUCTURING, MANAGEMENT OF TECHNOLOGY, BUSINESS STRATEGY, FAMILY BUSINESS Request : http://tacac.co.kr/?page_id=1374 ① Consulting is o The Algorithm accuracy or com change over tim results of the d Consulting bec ② information pr investment dec up ③ do anything th transaction. ④ The Algorithm information pr ⑤ analysis report