bit computer 032850 Algorithm Investment Report
•
0 likes•94 views

This document provides a performance analysis of an algorithm company over several periods from 2016-2020. It includes key financial metrics such as sales, operating profit, net income, operating rate, net rate, ROE, debt ratio, quick ratio, and reserve ratio on a quarterly and annual basis. It also analyzes the company's stock price performance, provides an indication price range and chart, and calculates suggested purchase amounts and numbers of stocks to buy at different price levels. Probability scores for stock price increases are given on a sector-by-sector and total average basis from 2019-2020.
![[Price for scheduled purchasing]
Arbitrarily made
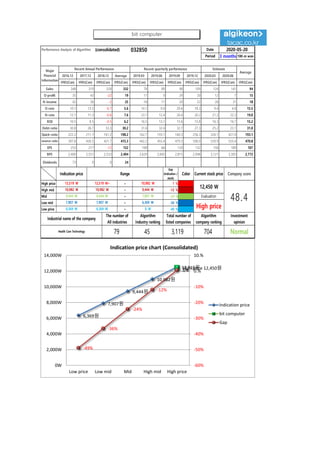
Algorithm stocks Trading Strategies (consolidated) 032850 Date
Period
Gap
(Indication /
stock)
Color
2020-05-20
3 months
Current stock price Evaluation
Stock price rise
probability score
Investment opinion Prospective purchase amount
12,450 W High price 58.2 Normal 3,000,000 W
Suggested Purchase
Amount 1,124,592 W
Number of stocks
purchased 90
Indication price Range Buying / Selling Buying / Selling [Stocks]
High price 12,519 W 12,519 W~ ~ 10,982 W 1 % -6,250 W -0
High mid 10,982 W 10,982 W ~ 9,444 W -12 % 132,630 W 12
Mid 9,444 W 9,444 W ~ 7,907 W -24 % 271,510 W 29
Low mid 7,907 W 7,907 W ~ 6,369 W -36 % 410,391 W 52
low price 6,369 W 6,369 W ~ 0 W -49 % 549,271 W 86
Stock price rise
probability score
A Sector 52.6 52.0 48.3 45.8 47.6 46.2
58.2B Sector 28.8 54.6 38.8 45.8 37.1 32.1
Total average
2019.12.18 2020.01.20 2020.02.19 2020.03.18 2020.04.16 2020.05.19
40.7 53.3 43.5 35.4 42.4 39.1
16 % -8 %
2020.01.20 2020.02.19 2020.03.18 2020.04.16 2020.05.19
Total of
increase rate
Total score
A Sector -1 % -8 % -6 % 4 % -3 %
-3 % 44.0B Sector 47 % -41 % 15 % -23 % -16 %
Total average 24 % -22 % -23 %
53 52
48 46 48 46
29
55
39
46
37
32
41
53
44
35
42
39
0
10
20
30
40
50
60
2019.12.18 2020.01.20 2020.02.19 2020.03.18 2020.04.16 2020.05.19
Stock price rise probability score
A sector
B sector
Total average
-1%
-8% -6%
4%
-3%
47%
-41%
15%
-23%
-16%
24%
-22% -23%
16%
-8%
-60%
-40%
-20%
0%
20%
40%
60%
2020.01.20 2020.02.19 2020.03.18 2020.04.16 2020.05.19
Increase rate of stock price rise
A sector
B sector
Total average
bit computer](data:image/gif;base64,R0lGODlhAQABAIAAAAAAAP///yH5BAEAAAAALAAAAAABAAEAAAIBRAA7)
Recommended
More Related Content
What's hot
What's hot (20)
Similar to bit computer 032850 Algorithm Investment Report
Similar to bit computer 032850 Algorithm Investment Report (17)
More from 알고리즘 기업분석 컨설팅-알기컨,algikeon
More from 알고리즘 기업분석 컨설팅-알기컨,algikeon (20)
Recently uploaded
Recently uploaded (15)
bit computer 032850 Algorithm Investment Report
- 1. Performance Analysis of Algorithm (consolidated) 032850 Date Period 3 months 100-m won 2016.12 2017.12 2018.12 Average 2019.03 2019.06 2019.09 2019.12 2020.03 2020.06 IFRS(Con) IFRS(Con) IFRS(Con) IFRS(Con) IFRS(Con) IFRS(Con) IFRS(Con) IFRS(Con) IFRS(Con) IFRS(Con) IFRS(Con) Sales 348 319 328 332 78 89 98 109 124 141 94 O-profit 35 43 -22 19 11 0 29 20 12 7 15 N-income 42 36 -2 25 18 11 20 22 26 31 18 O-rate 10.1 13.5 -6.7 5.6 14.1 0.0 29.6 18.3 9.4 4.8 15.5 N-rate 12.1 11.3 -0.6 7.6 23.1 12.4 20.4 20.2 21.2 22.3 19.0 ROE 10.5 8.5 -0.5 6.2 16.5 13.1 15.6 15.8 16.3 16.7 15.2 Debt-ratio 30.8 26.7 33.3 30.2 31.6 32.4 32.7 27.3 25.2 23.1 31.0 Quick-ratio 222.2 211.1 161.2 198.2 162.7 193.1 160.3 256.3 326.1 421.0 193.1 reserve-ratio 397.6 426.5 421.7 415.3 442.2 455.4 479.5 506.0 529.9 555.4 470.8 EPS 253 217 -12 152 108 66 120 132 158 189 107 BPS 2,400 2,551 2,533 2,494 2,629 2,695 2,815 2,948 3,121 3,305 2,772 Dividends 73 0 0 24 2020-05-20 Major Financial Information Recent Annual Performance Recent quarterly performance Estimate Average Gap (Indication / stock) Color High price ~ 1 % High mid ~ -12 % Mid ~ -24 % Low mid ~ -36 % Low price ~ -49 % Indication price Range Current stock price Company score 10,982 W 10,982 W 9,444 W 9,444 W 9,444 W 7,907 W Evaluation 12,519 W 12,519 W~ 10,982 W 12,450 W 48.47,907 W 7,907 W 6,369 W High price Normal 6,369 W 6,369 W 0 W Industrial name of the company The number of All industries Algorithm Industry ranking Total number of listed companies Algorithm company ranking Investment opinion Health Care Technology 79 45 3,119 704 6,369원 7,907원 9,444원 10,982원 12,519원High price 12,450원 -49% -36% -24% -12% .6% -60% -50% -40% -30% -20% -10% 0.% 10.% 0W 2,000W 4,000W 6,000W 8,000W 10,000W 12,000W 14,000W Low price Low mid Mid High mid High price Indication price chart (Consolidated) Indication price bit computer Gap bit computer
- 2. [Price for scheduled purchasing] Arbitrarily made Algorithm stocks Trading Strategies (consolidated) 032850 Date Period Gap (Indication / stock) Color 2020-05-20 3 months Current stock price Evaluation Stock price rise probability score Investment opinion Prospective purchase amount 12,450 W High price 58.2 Normal 3,000,000 W Suggested Purchase Amount 1,124,592 W Number of stocks purchased 90 Indication price Range Buying / Selling Buying / Selling [Stocks] High price 12,519 W 12,519 W~ ~ 10,982 W 1 % -6,250 W -0 High mid 10,982 W 10,982 W ~ 9,444 W -12 % 132,630 W 12 Mid 9,444 W 9,444 W ~ 7,907 W -24 % 271,510 W 29 Low mid 7,907 W 7,907 W ~ 6,369 W -36 % 410,391 W 52 low price 6,369 W 6,369 W ~ 0 W -49 % 549,271 W 86 Stock price rise probability score A Sector 52.6 52.0 48.3 45.8 47.6 46.2 58.2B Sector 28.8 54.6 38.8 45.8 37.1 32.1 Total average 2019.12.18 2020.01.20 2020.02.19 2020.03.18 2020.04.16 2020.05.19 40.7 53.3 43.5 35.4 42.4 39.1 16 % -8 % 2020.01.20 2020.02.19 2020.03.18 2020.04.16 2020.05.19 Total of increase rate Total score A Sector -1 % -8 % -6 % 4 % -3 % -3 % 44.0B Sector 47 % -41 % 15 % -23 % -16 % Total average 24 % -22 % -23 % 53 52 48 46 48 46 29 55 39 46 37 32 41 53 44 35 42 39 0 10 20 30 40 50 60 2019.12.18 2020.01.20 2020.02.19 2020.03.18 2020.04.16 2020.05.19 Stock price rise probability score A sector B sector Total average -1% -8% -6% 4% -3% 47% -41% 15% -23% -16% 24% -22% -23% 16% -8% -60% -40% -20% 0% 20% 40% 60% 2020.01.20 2020.02.19 2020.03.18 2020.04.16 2020.05.19 Increase rate of stock price rise A sector B sector Total average bit computer
- 3. 정보와 완전 정보 결 투자판단 있습니 위배 무단으 숙지하 Compliance notice ① The information provided by The Algorithm Company Analysis Consulting is obtained through reliable data and information and The Algorithm Company Analysis Program (TACAP), but its accuracy or completeness are not guaranteed. Furthermore, it may change over time.Therefore, we are not legally responsible for the results of the data provided by The Algorithm Company Analysis Consulting because of information errors or omissions. ② The Algorithm Company Analysis Consulting and all the information provided on it site are reference materials for investment decisions and the final responsibility of investment is up to users utilizing this information. ③ The Algorithm Company Analysis Consulting and its site do not do anything that violates the related laws such as discretionary transaction. ④ Users can not reallocate and recycle the information provided by The Algorithm Company Analysis Consulting firm let alone the information provided by its Site. ⑤ Be sure to know about application period of this algorithm analysis report in order to improve its accuracy. Tel : 070 - 4667 - 5009 Email : tacac@tacac.co.kr Homepage : tacac.co.kr Blog : tacac.blog.me SERVICES M&A, IPO, RECOVER, CORPORATE RESTRUCTURING, MANAGEMENT OF TECHNOLOGY, BUSINESS STRATEGY, FAMILY BUSINESS Request : http://tacac.co.kr/?page_id=1374 ① Consulting is o The Algorithm accuracy or com change over tim results of the d Consulting bec ② information pr investment dec up ③ do anything th transaction. ④ The Algorithm information pr ⑤ analysis report