
Recommended
Recommended
More Related Content
What's hot
What's hot (20)
Viewers also liked
Viewers also liked (16)
Similar to Measuring Economic Transformation and SDG Progress
Similar to Measuring Economic Transformation and SDG Progress (20)
More from StatsCommunications
More from StatsCommunications (20)
Recently uploaded
Recently uploaded (20)
Measuring Economic Transformation and SDG Progress
- 1. Economic Transformation and the SDGs—Measurement and Tracking (Dr. Yaw Ansu, Chief Economist, ACET) 1 The SDGs Sustainable Development Goal (SDG) #8 sates: “Promote sustained, inclusive and sustainable economic growth, full and productive employment, and decent work for all”. This goal is pivotal among the set of 17 SDGs. Its attainment requires the attainment of several of the SDGs, and attaining it makes possible the attainment of several others. For example, inclusive and sustainable growth requires: healthy lives (SDG 3), quality education (SDG 4), gender equality and empowerment of women and girls (SDG 5), reliable, sustainable and modern energy (SDG 7), resilient infrastructure (SDG 9) and particularly for Africa, sustainable agriculture and industrialization (SDG 2 and 9). Furthermore, inclusive and sustainable economic growth that is accompanied by full and productive employment and decent work for all will help reduce poverty, hunger, food insecurity, and malnutrition (SDG 1 and 2). It will also help reduce inequality within and among countries (SDG 10), and contribute to healthy lives and quality education (SDG 3 and 4). Indirectly, achievement of SDG 8 could also positively impact some of the other SDGs. For all of the reasons above, African countries should prioritize and promote the achievement of SDG 8. And clarifying the concepts underlying the goal and providing metrics that will facilitate its measurement and tracking should help in this effort. The two key concepts embodied in SDG 8 are first, “sustainable economic growth”, which should lead to rises in per capita incomes, and second, “full and productive employment, and decent work for all”, which would help ensure that rising incomes are widely shared through remunerative employment, leading to reduced inequality and also dignity for workers. For Africa, underlying both concepts is the idea of economic transformation. Economic Transformation In ACET’s 2014 African Transformation Report, we define economic transformation as “Growth with DEPTH” with each of the letters in “DEPTH” representing an important dimension of economic transformation: • Diversified production and exports; • Export competitiveness; 1 Help from my colleague at ACET, Dr. William Baah-Boateng, is gratefully acknowledged.
- 2. • Productivity gains in all sectors of the economy; • Technological upgrading throughout the economy; and • Human wellbeing The first 4 dimensions are what generate economic growth, and more importantly make it sustainable. The last highlights the need for economic growth to improve human lives. We combine all 5 dimensions of “Depth” to produce an African Transformation Index (ATI) with which we evaluate and compare countries on economic transformation. For this discussion, we will confine ourselves to the last dimension, Human wellbeing. Human wellbeing involves many factors including, employment and income security; reduced poverty and inequality; good health & education; peace, security of life, justice, shelter, and …etc. For ACET’s ATI, we boiled all of these down to 2 items: per capita income (GDP) and employment. The rationale is that if incomes are rising and they are being widely shared through rising employment levels, then inequality will be reduced and people will have greater access to some of the other ingredients of human wellbeing, such as food, education, health, shelter…etc. So, although far from being comprehensive, the two indicators that we use as proxies have profound impacts on human wellbeing, and for us—economists—they also have the advantage of keeping the discussion within the realm of economics. Employment Of the two proxies—GDP per capita and employment—we focus on the latter, since several of the other papers in this conference will discuss GDP issues. As is well known, the ILO’s definition of employment is not very relevant for the realities of African economies. To be classified as unemployed under that definition, a person (15 years or older) must meet all of the three requirements below (for a reference period, usually the past one week): • Out of work • Available for work, and • Actively seeking work. Many African countries do not have unemployment insurance and other social protection systems to cushion people out of employment, and they also do not have functioning labor bureaus to facilitate job search (and collect labor market statistics). Most people therefore cannot stay out of work for a long time; they have to find something do to survive. Consequently, reported unemployment rates are under 6 percent for most African countries—on par or lower than many richer industrialized countries (Table 1). But these rates present an erroneous picture of the employment situation in African countries. Indeed, 80 to 90 percent of employment in almost all African countries is in the informal sector or in vulnerable employment, with income levels that keep the workers in poverty.
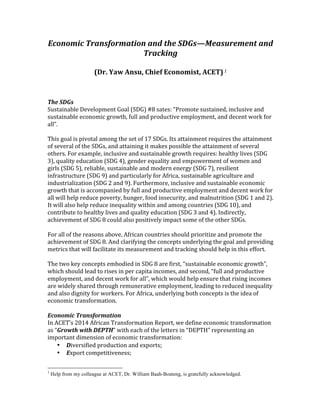
- 3. Increasingly, the ranks of the informal sector and vulnerable employment are being swelled by the educated youth whose aspirations and attempts to secure formal sector employment have proved futile. A rising proportion of these youth are graduates of secondary and tertiary institutions with training that has geared them to aspire to formal sector jobs. These youth eke out a living in frustration, engaged in activities that do not utilize their education and training. Table 1: Unemployment rates based on ILO definition and discouraged workers Country Unemployment (ILO definition) Unemployment (Broad) (No work, available & seeking) (No work, available, not seeking) Ghana 3.1 6.5 Zimbabwe 5.4 10.7 . Botswana 17.6 32.2 Tanzania 4.3 6.7 Niger 3.7 5.7 Zambia 8.8 11.5 South Africa 24.7 32.4 Source: Baah-Boateng (2015) One way to get a better picture of unemployment in Africa is to drop the criterion of “actively seeking work” from the ILO definition and to include in the ranks of the unemployed those who are discouraged and have stopped actively seeking work (Table 1, column 2). An even more relevant concept, particularly for the youth, is that of NEET—those in the working age (or youth) population that are Not in Employment Education or Training. Those in NEET are essentially in one of the following places: in the formal sector labor force but unemployed; discouraged and dropped out of the formal sector labor force; or inactive (e.g. housewives and those kept out of the labor force for long-‐term health reasons). The figure below compares this measure of unemployment for the youth in Ghana. The NEET measure of unemployment is over four times higher than the conventional ILO measure, and about double the “broad” unemployment measure under the ILO definition. The latter includes, in addition to the unemployed by the conventional definition, those who have been discouraged and have stopped actively seeking work). Figure… shows the situation in other African countries.
- 4. Source: Aryeetey el al (2014) Source: Constructed from Key Indicators of the Labor Market (KILM) 8th edition But even the NEET measure does not reflect the large numbers of educated youth who have been forced to take up menial activities below their qualifications in the informal sector due to lack of opportunities for jobs or self-‐employment in the formal sector. This situation represents: • A waste of national education resources • A waste of individual talents • A waste of opportunity for the nation to capitalize on its most important economic asset for economic growth and development; and • A burgeoning army of frustrated youth that pose national social and political risks 0 20 40 1992 1999 2006 5.4 5.4 6.5 8.0 15.8 13.5 23.0 34.2 26.9 Figure 1: Narrow and Broad unemployment rates and NEET among Ghanaian youth (15-‐24) ILO Narrow Broad (ILO Narrow + Discouraged workers NEET 0 5 10 15 20 25 30 Benin Liberia Malawi Mali Zambia 2.4 5.1 8.6 10.7 15.2 25.3 29.0 17.6 13.5 28.3 Figure 2: Youth unemployment rates and NEET of selected African countries (%) Youth unemployment NEET
- 5. Unless something is done to dramatically increase employment in the formal sector, this situation will get worse due to Africa’s fast rising youth population and the increasing access to education. In addition, even for the older (non-‐youth) workers already in the informal sector, formalization, entailing raised productivity and incomes levels and improved work conditions should be a priority focus of development policy. Apart from the likely benefits that these workers will gain from formalization, the nation will also benefit from increased contributions to taxes and official social security systems, which would raised the level of domestic savings available for financing development. For all of these reasons, the expansion of formal employment (jobs as well as self-‐employment) should be a high-‐priority national economic target. The case is often made that since the bulk of the working population in Africa (upwards of 80%) is in the informal sector, that sector should be the focus of policy. This may be justifiable if the primary objective is short-‐term poverty alleviation— “let’s do something for the poor now to alleviate their suffering”. But if the primary goal is sustainable improvement in incomes with dignity and reduced dependency, then the objective of expanding formal sector employment should merit primary consideration. It will help focus attention on pursing economic transformation and the SDGs, as explained below. Expanding formal employment African countries should aim to raise the ratio of formal employment to the working age population as a national economic target. Specifically, the target should be: Raise FE/WP, where FE is the number of workers in formal employment and WP is the size of the working-‐age population (15-‐64 yrs). This target can be decomposed into 3 ratios: FE/WP = FE/SG * SG/LF * LF/WP (1) Where: FE = Formal employment WP = Working-‐age population SG = Secondary and tertiary, including technical and vocational, school graduates in the labor force LF = Labor force =WP – (Those in School and Training)-‐(Housewives)-‐(Those incapacitated) So the target of raising the ratio of the formally employed to the working age population amounts to: • Raising the ratio of formal employment to secondary and tertiary school graduates in the labor force;
- 6. • Raising the share of secondary and tertiary school graduates in the labor force; and • Raising the labor force participation rate. Together, these three component ratios constitute a focused economic transformation agenda that can effectively respond to the challenge of meeting SDG 8, as explained below. Expanding formal employment, speeding economic transformation and meeting SDG 8 Raising the labor force participation rate. We start with the last of the three components ratios above—raising the labor force participation rate or equivalently, reducing the inactivity rate. Three policy areas are key to pursuing this objective: (a) policies that facilitate access to good and affordable health care in order to keep the working age population fit so as to reduce the number of people incapacitated; (b) policies that remove constraints and discrimination faced by women in entering the labor market; and (c) family leave and childcare policies that enhance the options of women to participate in the labor force. In Ghana, the inactivity rate rose from 25 percent to almost 30 percent between 2000 and 2010. Over the same period, the percentage of the inactive that were incapacitated rose from 3.4 to 4.7 percent (Figure 3). As can be seen from Figure 4, in some African countries, women’s labor force participation rates are significantly lower than those of men. Source: Population and Housing Census, 2000 and 2010, Ghana Statistical Service 25.3 28.9 3.4 4.7 0 10 20 30 40 2000 2010 Figure 3: Inactivity rate and proportion of economically inactive that are incapacitated in Ghana (%) Inactivity rate % of inactive that are incaacitated
- 7. Source: Key Indicators of the Labour Market (KILM) 8th Edition, (ILO) Raising the share of secondary and tertiary school graduates in the labor force. The key here is education policies that: (a) facilitate expanded and affordable access to secondary and tertiary, including technical and vocational, education; and (b) ensures that those entering secondary and tertiary institutions graduate on time. Indeed, enrolments at the secondary and tertiary levels are low in many countries on the continent and Sub-‐Saharan Africa (SSA) has the lowest enrolment rate at secondary and tertiary levels among all regions of the world. The gross enrolment rate at the tertiary level stood at 8.6% in SSA compared to the world average of 32.9% with the same pattern reported at the secondary level (Figure 5) Source: World Development Indicators, 2015, World Bank 0 20 40 60 80 100 Figure 4: Labour Force Participation Rate by Gender (%) Male Female 0 20 40 60 80 100 120 High Income OECD European Union Latin America & Pacioic East-‐Asia and Pacioic World South Asia SSA 91.2 91.7 75.7 78.5 66.0 51.4 33.7 105.1 111.8 92.9 86.6 75.2 65.5 42.8 76.0 66.2 43.9 33.1 32.9 21.2 8.6 Figure 5: Gross and Net Enrolment Rates of Secondary and Tertiary NER Secondary GER Secondary GER Tertairy
- 8. Raising the ratio of formal employment to secondary and tertiary graduates in the labor force. Why focus on just secondary and tertiary graduates in formal employment? First, because as already explained, increasingly the crisis of youth unemployment and underemployment in Africa is becoming centered on this population. Second, because raising the minimum level of education in the labor force to the secondary school level raises the potential productivity floor for the whole economy. Currently, the share of secondary and tertiary graduates that gain employment in the formal sector is very low reflecting in the high unemployment rates of secondary and tertiary graduates relative to those with no or lower level of education (Figure 6). Source: Constructed from Key Indicators of the Labor Market (ILO, 2013) Expanding formal employment to absorb a rising number of secondary and tertiary school graduates requires focused attention on the quality and relevance of education, and on the nature of economic growth strategies. First, it is not enough just to raise the ratio of secondary and tertiary graduates in the labor force (i.e. the second ratio), these graduates must have the skills and training that make them attractive to employers or that enable them to set up their own formal sector enterprises. This requires close alignment between educational policies and economic growth strategies, and also close collaboration between educational authorities and the private sector in curricular development. The collaboration could take the form of internships, inputs of the private sector on curricula development (particularly for technical and vocational training institutes), adoption of practical case studies in teaching and training as well as opportunities for instructors and trainers to spend some time at economic enterprises. A greater emphasis by institutions on science, technology, engineering and mathematics (STEM) disciplines and an increase in the number of students studying them will also be needed (ATR1). 0 5 10 15 20 25 30 35 Figure 6: Unemployment rate by level of education Basic/Primary Secondary Tertiary
- 9. Second, a viable economic growth strategy has to be devised and implemented in order to keep expanding the demand and opportunities for employment in the formal sector, particularly by private sector enterprises. The key requirements for this are well known by now, including: (a) a stable macroeconomic environment; (b) a business-‐friendly environment (i.e. policies, institutions, and regulations) that makes it easier for existing businesses to expand and for new businesses to establish quickly, and for businesses in the informal sector to grow and become formal; (c) provision of good public infrastructure (power, roads, water, ports, and telecommunications) through efficient public investment and public-‐private partnerships (PPPs); (d) smart and market-‐oriented industrial policy that targets promising sub-‐sectors (in agriculture, manufacturing, and modern services) and assists them with access to technology, finance, and external markets; and (e) targeted assistance to the informal sector to help them to grow and become formal ( ATR1). A summary indicator for economic transformation and the SDGs The above discussion has shown that raising the ratio of formal sector employment to the working age population is a powerful summary indicator. It captures the essence of SDG 8, and to pursue it requires the successful implementation of an employment creating economic transformation strategy. Furthermore, as demonstrated as the beginning of the paper, SDG 8 is pivotal to achieving many of the other SDGs—i.e. to achieve SDG 8 requires achieving several of the other SDGs, and achieving SDG 8 facilitates achievement of several other SDGs. So, if we are looking for one powerful metric to track the SDGs, the ratio of formal employment to the working age population is it. It has the added advantage of putting employment issues at the center of economic transformation strategy, rather than as a well-‐intentioned social and poverty-‐reducing after-‐thought, which has tended to be the case. Now the question is: how do we go about getting the data needed to measure and regularly track this ratio and the associated three ratios discussed above? Data and monitoring issues Where can we get the data needed for the ratio of: (a) formal employment to the working age population; (b) formal employment to secondary and tertiary graduates; (c) secondary and tertiary graduates to the labor force; and (d) labor force to the working age population (i.e. the labor force participation rate)? Given the poor quality of labor force and other household surveys in many African countries, perhaps a more tractable way to measure the above ratios is to convert equation (1) into flows, focusing on changes over time. Indeed, in terms of tracking policy performance this is more relevant. In terms of growth rates, equation (1) becomes: (fe – wp) = (fe – sg) + (sg – lf) + (lf – wp) (2)
- 10. The above expression says that to raise the ratio of formal employment to the working age population over time: (a) the rate of growth in formal employment must exceed the rate of growth of the number of graduates from secondary and tertiary institutions entering the labor force; (b) the rate of growth of these graduates must exceed that of the labor force; and (c) the labor force must grow faster than the working-‐age population. Data on growth in formal employment can be estimated from administrative surveys and from tax and company registration records. The numbers (and courses of study) of secondary and tertiary institution graduates entering the labor market each year can be estimated from the records of Ministries of Education supplemented by surveys of secondary and tertiary institutions, which can be easily administered. Population censuses can be used to estimate the growth in the working age population, and to some extend the growth in the labor force, but the latter may need to be supplemented by specially designed surveys. In addition, data on some of the other variables mentioned above in the discussion of the ratios (e.g. the quality and relevance of education; policies and practices that discriminate against women’s entry into the labor force…etc.) could also be collected on a systematic basis. In the medium to long-‐term, there is no substitute for comprehensive and regular labor force surveys and robust socio-‐economic statistical systems in African countries. But in the mean time the framework proposed here enables us to capture the essence of the SDGs and economic transformation nexus. At ACET, we are starting a program aimed at implementing this framework. References 1. ACET (2014) “Growth with Depth: 2014 African Transformation Report” (ATR1), The African Centre for Economic Transformation, Accra, Ghana. 2. AfDB, OECD, UNDP, and UNECA (2012) Promoting Youth Employment, African Economic Outlook 2012, www.africaneconomicoutlook.org 3. Aryeetey, E., Baah-Boateng W, Ackah C, Mbiti, I and Lehrer, K. (2014) “Ghana” in Hino and Ranis (ed.) Youth and Employment in Sub-Saharan Africa: Working but Poor, Routledge Publication, pp. 233-302, ISBN: 9780415859387 4. Baah-Boateng W (2015) “Unemployment in Africa: how appropriate is the global definition and measurement for policy purpose?” International Journal of Manpower, Vol. 36, Issue. 5, pp. 650-667 Emerald, ISSN: 0143-7720
- 11. 5. Baah-Boateng W. (2013) “Determinants of Unemployment in Ghana”, African Development Review, Vol. 21, Issue 4, pp. 385-399, Wiley Publication, ISSN: 1467-8268 6. ILO (2015) “Key Indicators of the Labour Market (KILM)” 8th Edition, International Labour Office, available at www.ilo.org 7. ILO (2013) “Key Indicators of the Labour Market (KILM)” 7th Edition, International Labour Office, available at www.ilo.org 8. Ghana Statistical Service (2005) “Analytical Report of 2000 Population and Housing Census”, The Ghana Statistical Service 9. Ghana Statistical Service (2012) “Analytical Report of 2010 Population and Housing Census”, The Ghana Statistical Service 10. World Bank (2015) “World Development Indicators 2015” The World Bank