
Recommended
Recommended
More Related Content
What's hot
What's hot (20)
Similar to Indicators of Development (Economic, Social and Environmental)
Similar to Indicators of Development (Economic, Social and Environmental) (20)
More from Kamlesh Kumar
More from Kamlesh Kumar (20)
Recently uploaded
Recently uploaded (20)
Indicators of Development (Economic, Social and Environmental)
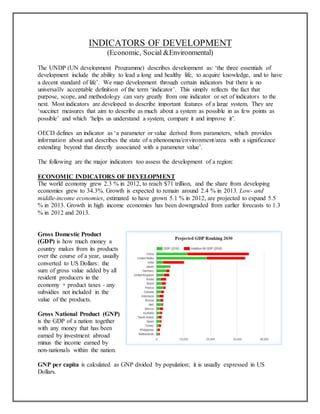
- 1. INDICATORS OF DEVELOPMENT (Economic, Social &Environmental) The UNDP (UN development Programme) describes development as: ‘the three essentials of development include the ability to lead a long and healthy life, to acquire knowledge, and to have a decent standard of life’. We map development through certain indicators but there is no universally acceptable definition of the term ‘indicator’. This simply reflects the fact that purpose, scope, and methodology can vary greatly from one indicator or set of indicators to the next. Most indicators are developed to describe important features of a large system. They are ‘succinct measures that aim to describe as much about a system as possible in as few points as possible’ and which ‘helps us understand a system, compare it and improve it’. OECD defines an indicator as ‘a parameter or value derived from parameters, which provides information about and describes the state of a phenomena/environment/area with a significance extending beyond that directly associated with a parameter value’. The following are the major indicators too assess the development of a region: ECONOMIC INDICATORS OF DEVELOPMENT The world economy grew 2.3 % in 2012, to reach $71 trillion, and the share from developing economies grew to 34.3%. Growth is expected to remain around 2.4 % in 2013. Low- and middle-income economies, estimated to have grown 5.1 % in 2012, are projected to expand 5.5 % in 2013. Growth in high income economies has been downgraded from earlier forecasts to 1.3 % in 2012 and 2013. Gross Domestic Product (GDP) is how much money a country makes from its products over the course of a year, usually converted to US Dollars: the sum of gross value added by all resident producers in the economy + product taxes - any subsidies not included in the value of the products. Gross National Product (GNP) is the GDP of a nation together with any money that has been earned by investment abroad minus the income earned by non-nationals within the nation. GNP per capita is calculated as GNP divided by population; it is usually expressed in US Dollars.
- 2. Economic growth measures the annual increase in GDP, GNP, GDP per capita, or GNP per capita. It indicates whether there are persistent economic problems or if the nation has an opportunity for a steady economic advancement. Parts of Central Asian and sub-Saharan nations are going a little off the track as of now in achieving the goal of reducing poverty while North African, Middle Eastern and South Asian nations have achieved a great deal in reducing the level of poverty. Economic structure shows the division of a country's economy between primary, secondary and tertiary industries. The developed nations tend to have more share of working population engaged in tertiary sector. Based on current trend GDP growth in Latin America and the Caribbean fell 1.7 %age points from 2011 to 3.0 % in 2012, the second largest drop among developing country regions after Europe and Central Asia, where growth fell 2.8 %age points. The region’s GDP growth fiscal, monetary, and credit policy tightening to contain inflation risks had a large impact, decelerated due to slowing domestic demand and a weak external environment. The slowdown was particularly severe in Brazil, the region’s largest economy, where global uncertainties and earlier especially on private investment. In Chile growth remained buoyant and continued to expand briskly, if slightly slower than in 2011. Growth in Central America and the Caribbean slowed modestly, while growth in Mexico rose slightly in 2012, to 4%, benefiting from the fairly strong recovery in U.S. manufacturing. Developing economies are expected to maintain GDP growth of 6.6–6.8 %, with growth of GDP per capita around 5.5 %. Growth will be fastest in East Asia and Pacific and South Asia, which still contain more than half the world’s poorest people. Growth will be slower in Sub-Saharan Africa, the poorest region in the world, but faster than in the preceding years, quickening the pace of poverty reduction SOCIAL INDICATORS OF DEVELOPMENT Poverty rate: The proportion of people living on less than $1.25 a day fell from 43.1% in 1990 to 22.7 % in 2008, reaching new lows in all the six developing country regions. How fast poverty reduction will proceed depends not just on the growth of GDP but also on its distribution. To speed progress toward eliminating extreme poverty, development strategies should attempt to increase not just the mean rate of growth but also the share of income going to the poorest part of the population.
- 3. Health Factors: Malnourishment and under- nourishment are two significant factors to track down the health status of the population. Malnutrition rates have dropped substantially since 1990, from 28 % of children under age 5 in developing countries to 17 % in 2011. Every developing region except Sub-Saharan Africa is on track to cut child malnutrition rates in half soon. After steady declines in most regions from 1991 to 2005, further improvements in under-nourishment have stalled, leaving 13 % of the world’s population, almost 900 million people, without adequate daily food intake. While the condition in East Asia, South Asia, Pacific and Latin America have improved the scenario of sub Saharan Africa. Women empowerment Women make important contributions to economic and social development. Expanding opportunities for them in the public and private sectors is a core development strategy, and education is the starting point. Achieving gender equality in education is an important demonstration that young women are full, contributing members of society. Girls have made substantial gains in school enrollment. In 1990 girls’ primary school enrollment rate in developing countries was only 86% of boys’. By 2011 it was 97%. Similar improvements have been made in secondary schooling, where girls’ enrollments have risen from 78% of boys’ to 96% over the same period. But the averages mask large differences across countries. At the end of 2011, 31 upper middle-income countries had reached or exceeded equal enrollment of girls in primary and secondary education, as had 23 lower middle-income countries but only 9 low-income countries. South Asia and Sub-Saharan Africa are lagging.
- 4. Women work long hours and make important contributions to their families’ welfare, but many in the informal sector are unpaid for their labor. The largest proportion of women working in the formal sector is in Europe and Central Asia, where the median proportion of women in wage employment outside the agricultural sector was 46%. Women’s share in paid employment in the on agricultural sector has risen marginally but remains less than 20% in most countries in the Middle East and North Africa and South Asia and less than 35% in Sub-Saharan Africa. In these regions full economic empowerment of women remains a distant goal. Relevant indicators could include the percentage distribution of the employed population, by sector and sex; the proportion of employed who are employer, by sex; the length of maternity leave; the percentage of firms owned by women; the proportion of the population with access to credit, by sex; and the proportion of the population who own land, by sex. Lack of data hampers the ability to understand women’s roles in the economy. More women are participating in public life at the highest levels. The proportion of parliamentary seats held by women continues to increase. In Latin America and the Caribbean women now hold 25 % of all parliamentary seats. The most impressive gains have been made in the Middle East and North Africa, where the proportion of seats held by women more than tripled between 1990 and 2012. Algeria leads the way with 32 %. In Nepal a third of parliamentary seats were held by women in 2012. Rwanda continues to lead the world. Since 2008, 56 % of parliamentary seats have been held by women. Education The most important social indicator. It enables people gain expertise in respective fields in order to contribute skills and expertise to the economy and some particular branch of national production. Hence the economy grows because there is no lack of skilled labour and state develops in a positive direction.
- 5. Progress among the poorest countries has accelerated since 2000, particularly in South Asia and Sub-Saharan Africa, but full enrollment remains elusive. Many children start school but drop out before completion, discouraged by cost, distance, physical danger, and failure to progress. Even if countries approach the target, the education demands of modern economies expand, and primary education will increasingly be of value only as a stepping stone toward secondary and higher education. Sub-Saharan Africa and South Asia, which started out farthest behind, made substantial progress. By 2009 nearly 90% of children in developing countries completed primary school, but completion rates have stalled since, with no appreciable gains in any region. Three regions have attained or are close to attaining complete primary education: East Asia and Pacific, Europe and Central Asia, and Latin America and the Caribbean. Completion rates in the Middle East and North Africa have stayed at 90% since 2008. South Asia has reached 88%, but progress has been slow. And Sub-Saharan Africa lags at 70%. Even if the schools in these regions were to now enroll every eligible child in the first grade, they would not be able to achieve a full course of primary education by 2015. But it would help. Many children enroll in primary school but attend intermittently or drop out entirely. This is particularly true for girls almost all school systems with low enrollment rates show under enrollment of girls in primary school, since their work is needed at home. The problem is worst in South Asia and Sub-Saharan Africa, where more than 46 million children of primary school age are not in school. Parents’ education makes a big difference in how far children go in school. In Nepal, for example, less than 90% of children whose parents lack any education complete first grade and barely 70% remain through the ninth. But 95% of children from households with some higher education stay through nine grades, and many of those go onto complete secondary school and enter tertiary education. Income inequality and educational quality are closely linked. ENVIRONMENTAL INDICATORS Forest area Forests covered 30% of all land or just under 40 million square kilometers, two-thirds of which lies within just 10 countries. Since 1990, 3% of forests have been lost globally, though some
- 6. countries have succeeded in reforestation. China has increased its forest area by 33% adding 510,000 square kilometers and India by 11% adding nearly 70,000 square kilometers. In contrast, Brazil has seen its forest area decline by 10 percent losing slightly more than 530,000 square kilometers and Indonesia by nearly 25 percent losing 275,000 square kilometers. Factors that contribute to the loss of forests include population growth, increasing demand for food, and declining growth in agricultural productivity. Air Pollution Air quality is commonly measured through levels of particulate matter less than or equal to 2.5 microns in diameter. The World Health Organization recommends 10 micrograms per cubic meter as a guideline for average annual, with adverse health effects observed through long-term exposure to concentrations above this level. However, nearly 92 percent of the world’s people live in places where that concentration is exceeded. In three regions East Asia and Pacific, the Middle East and North Africa, and South Asia levels have worsened since 1990, and global mean annual exposure has increased from just under 40 micrograms per cubic meter in 1990 to 44 in 2015. Of the 194 countries with data in 2015, only 26 reported levels of PM 2.5 below the recommended level. And in 145 countries more than 99 percent of the population was exposed to higher than recommended levels. Marine protected areas In 2014 around 12% of the world’s oceans considered national territorial waters were designated as marine protected areas—more than twice the 5 percent in 1990. The share increased in all regions but remains at 6 percent or less in the Middle East and North Africa, South Asia, and Sub-Saharan Africa. Belgium, France, Monaco, New Caledonia, Poland, and Slovenia all increased their share of protected waters more than 50 percentage points.
- 7. Constraints: GDP is a common indicator used for measuring development, but is imperfect as the calculation doesn’t consider certain forms of production, such as subsistence production. Availability of opportunities for the people to flourish: Domestic subsidies to the people engaged in the primary activity is high in developed nations especially in EU followed by Japan and USA. People in developed nations have advantage of importing goods from developing nations free of tariffs. Norwegians, Japanese and Americans have an upper hand on this. The Human Development Index (HDI): It ranks the level of development of a nation. It was developed by United Nations Development Program (UNDP) on the basis of the concept of human development by Amartya Sen and Mahbub ul Haq. Countries are ranked based on their score and split into categories that suggest how well developed they are.