The document provides a comprehensive overview of high-performance thin-layer chromatography (HPTLC), detailing its principles, instrumentation, application processes, advantages, and disadvantages. Key topics include the factors affecting HPTLC, the differences between TLC and HPTLC, and troubleshooting tips for common issues encountered during analysis. Applications of HPTLC span various fields, including pharmaceuticals, food analysis, and environmental testing.


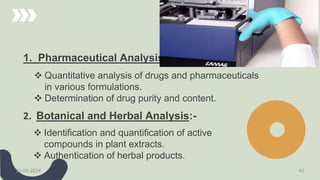


![CTEV [ clubfoot] DR ARUN LAL ,DR MOHAMED ASHRAF travancore medical college k...](https://cdn.slidesharecdn.com/ss_thumbnails/ctevclubfootdrarunlaldrmohamedashraftravancoremedicalcollegekollamkeralaindia-260208063247-18fc466c-thumbnail.jpg?width=640&height=640&fit=bounds)


