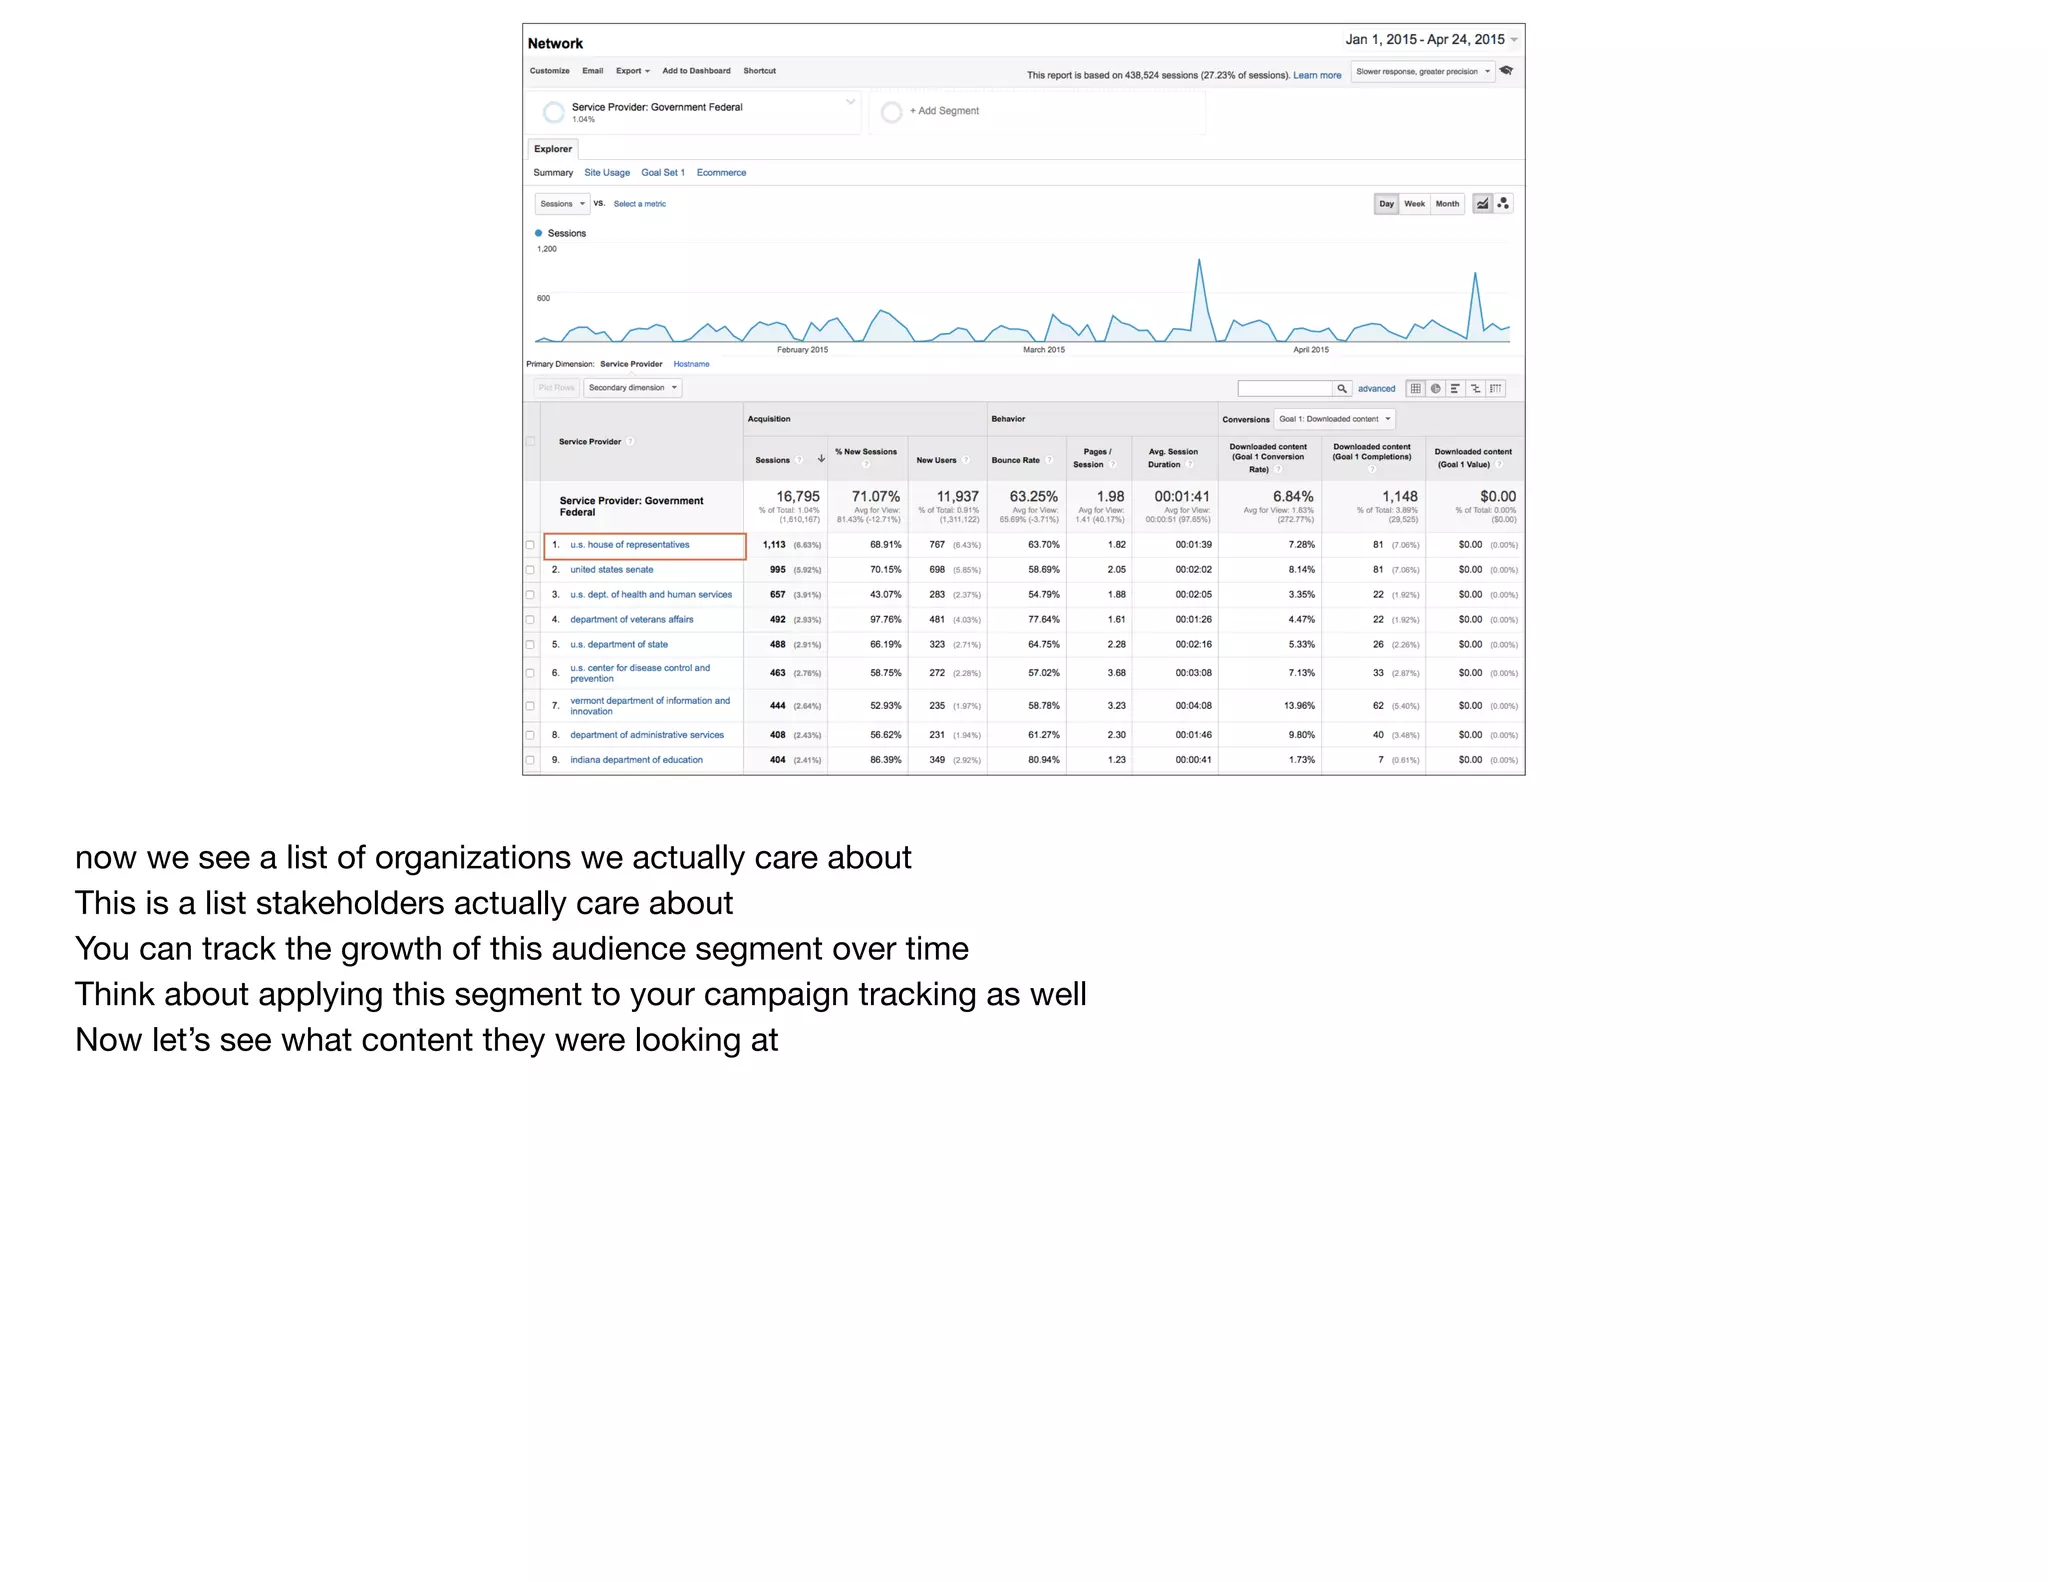
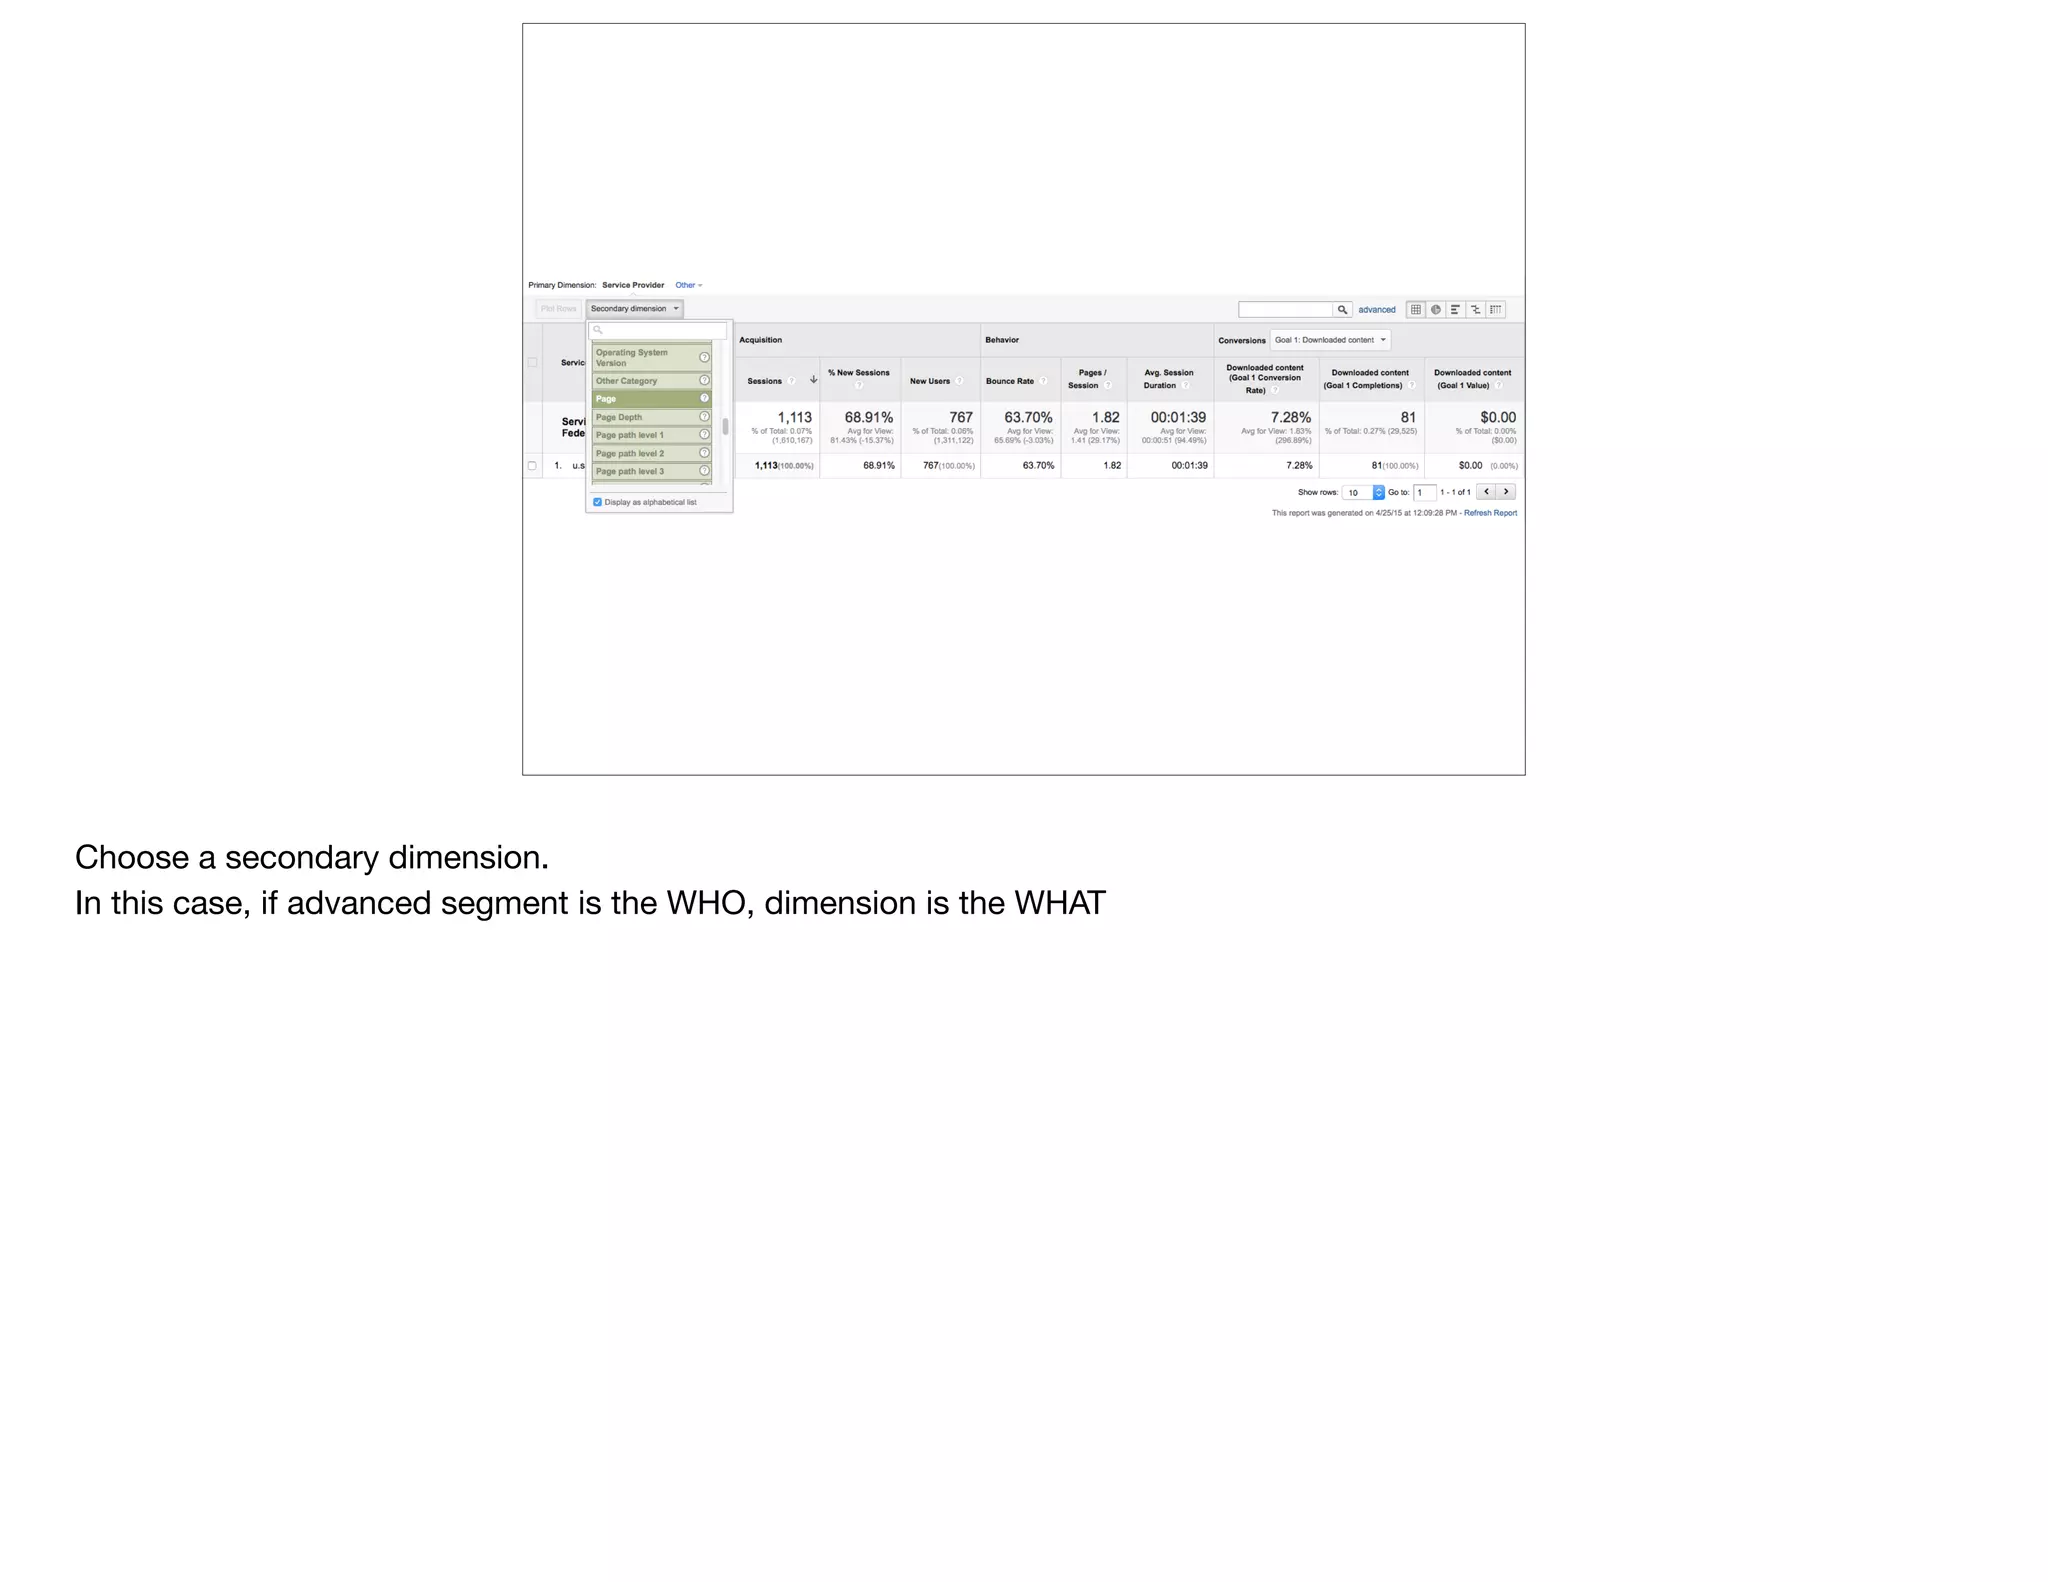
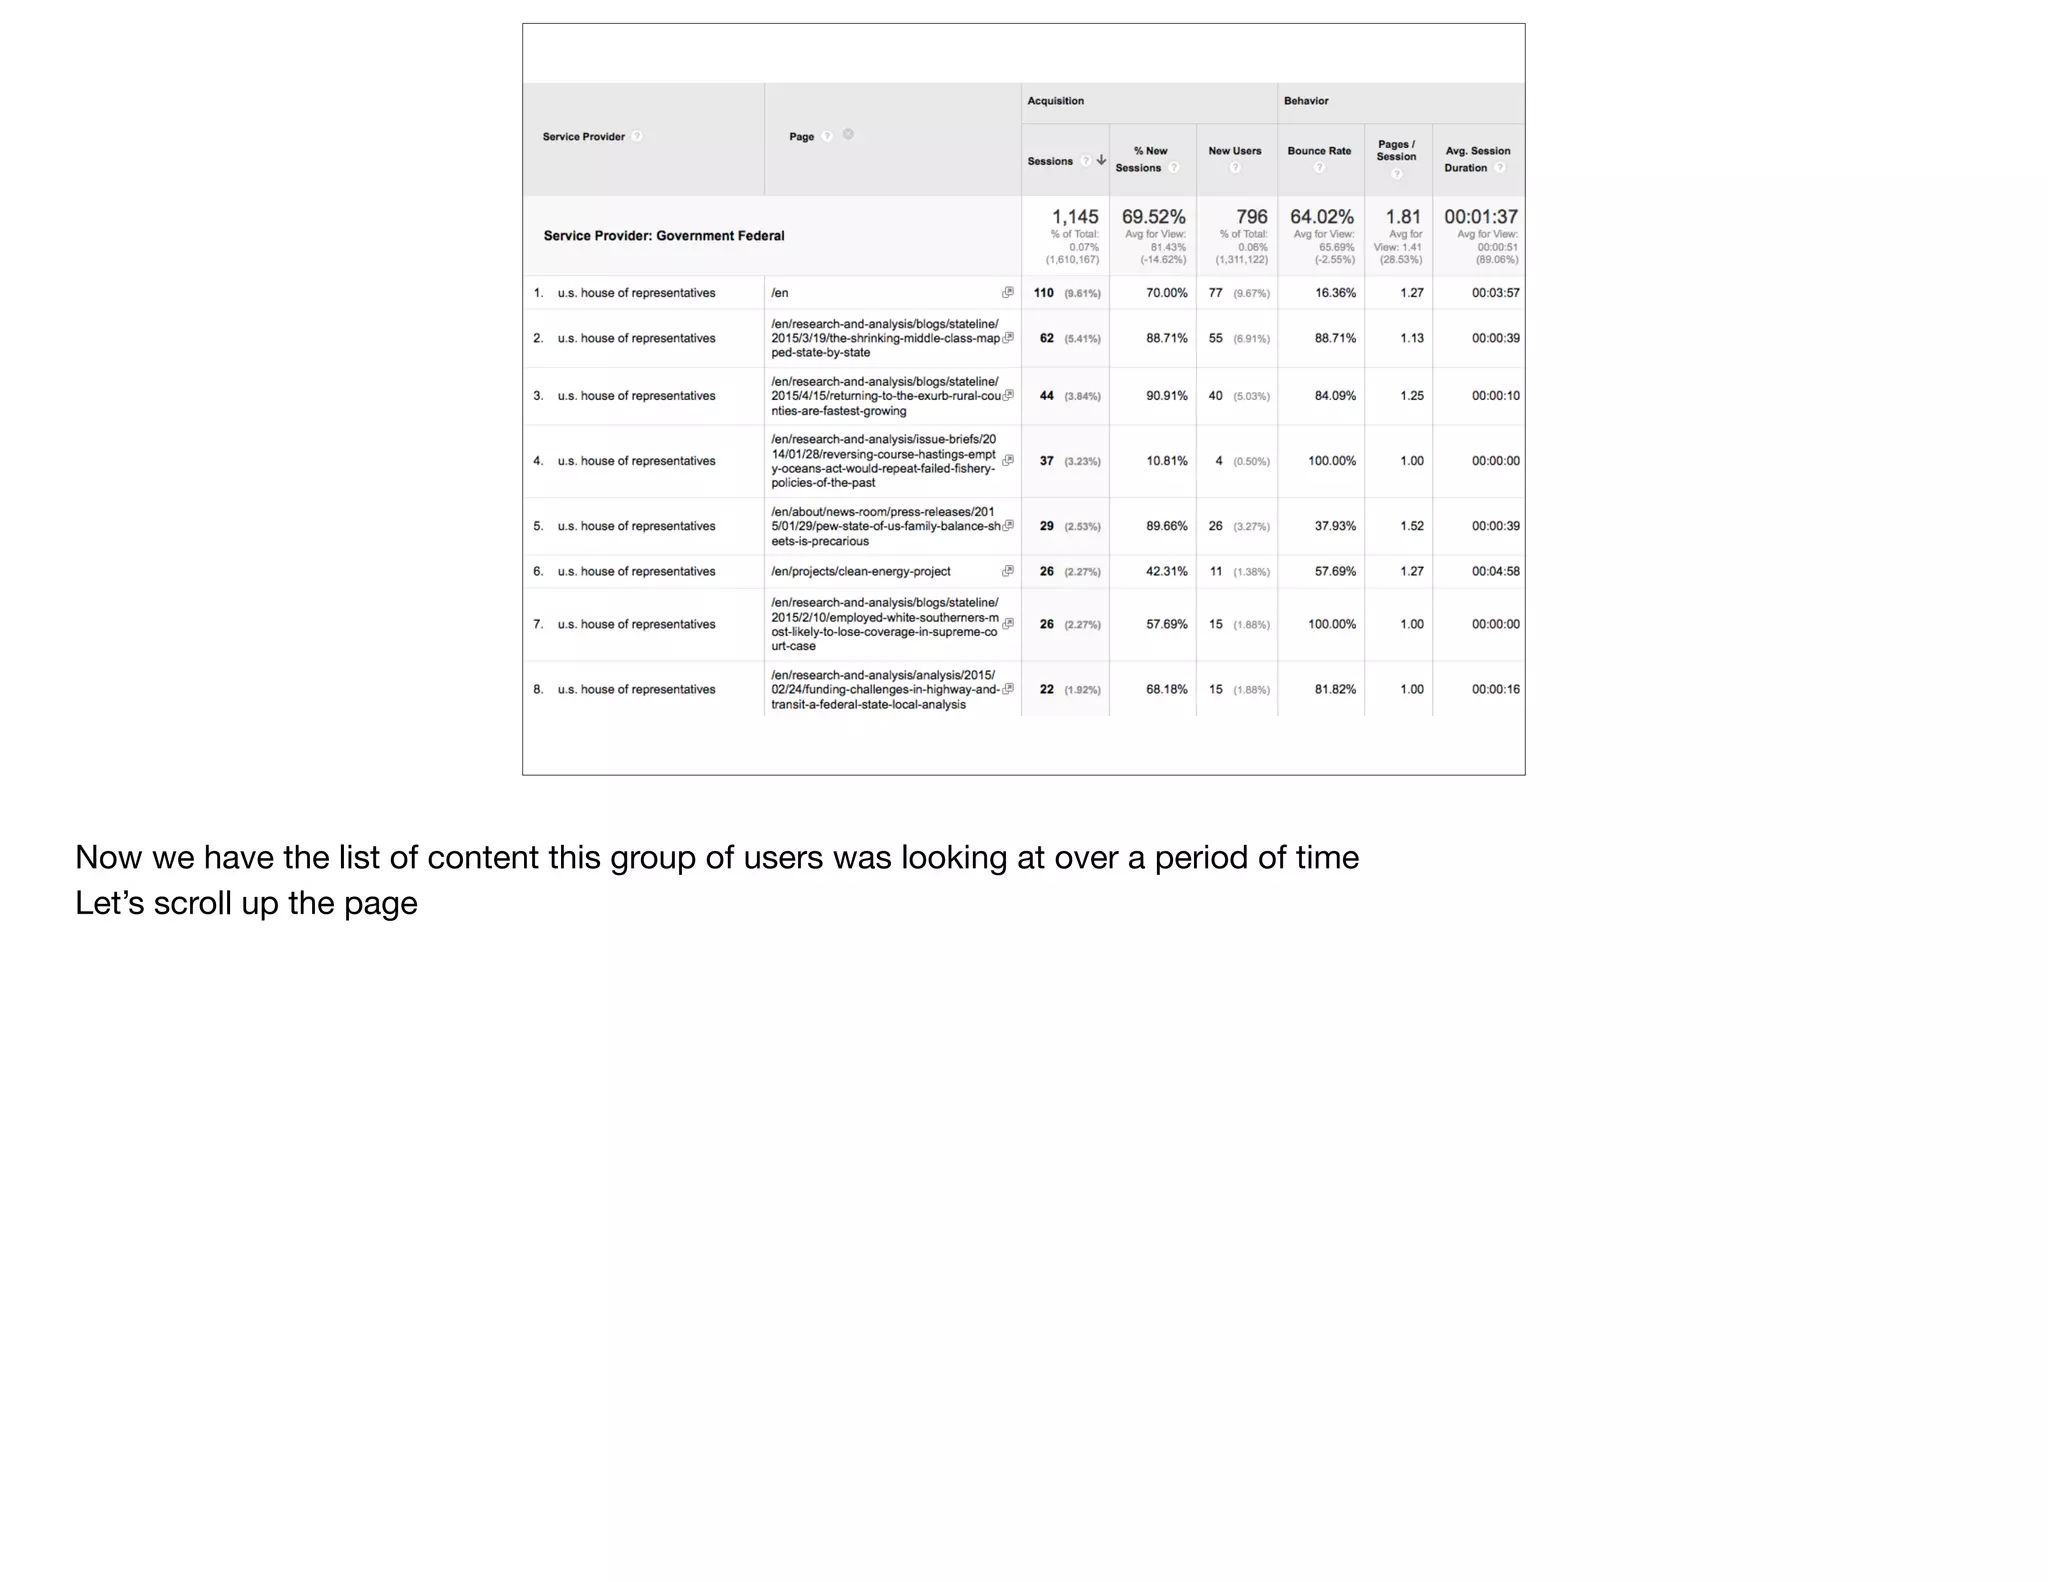
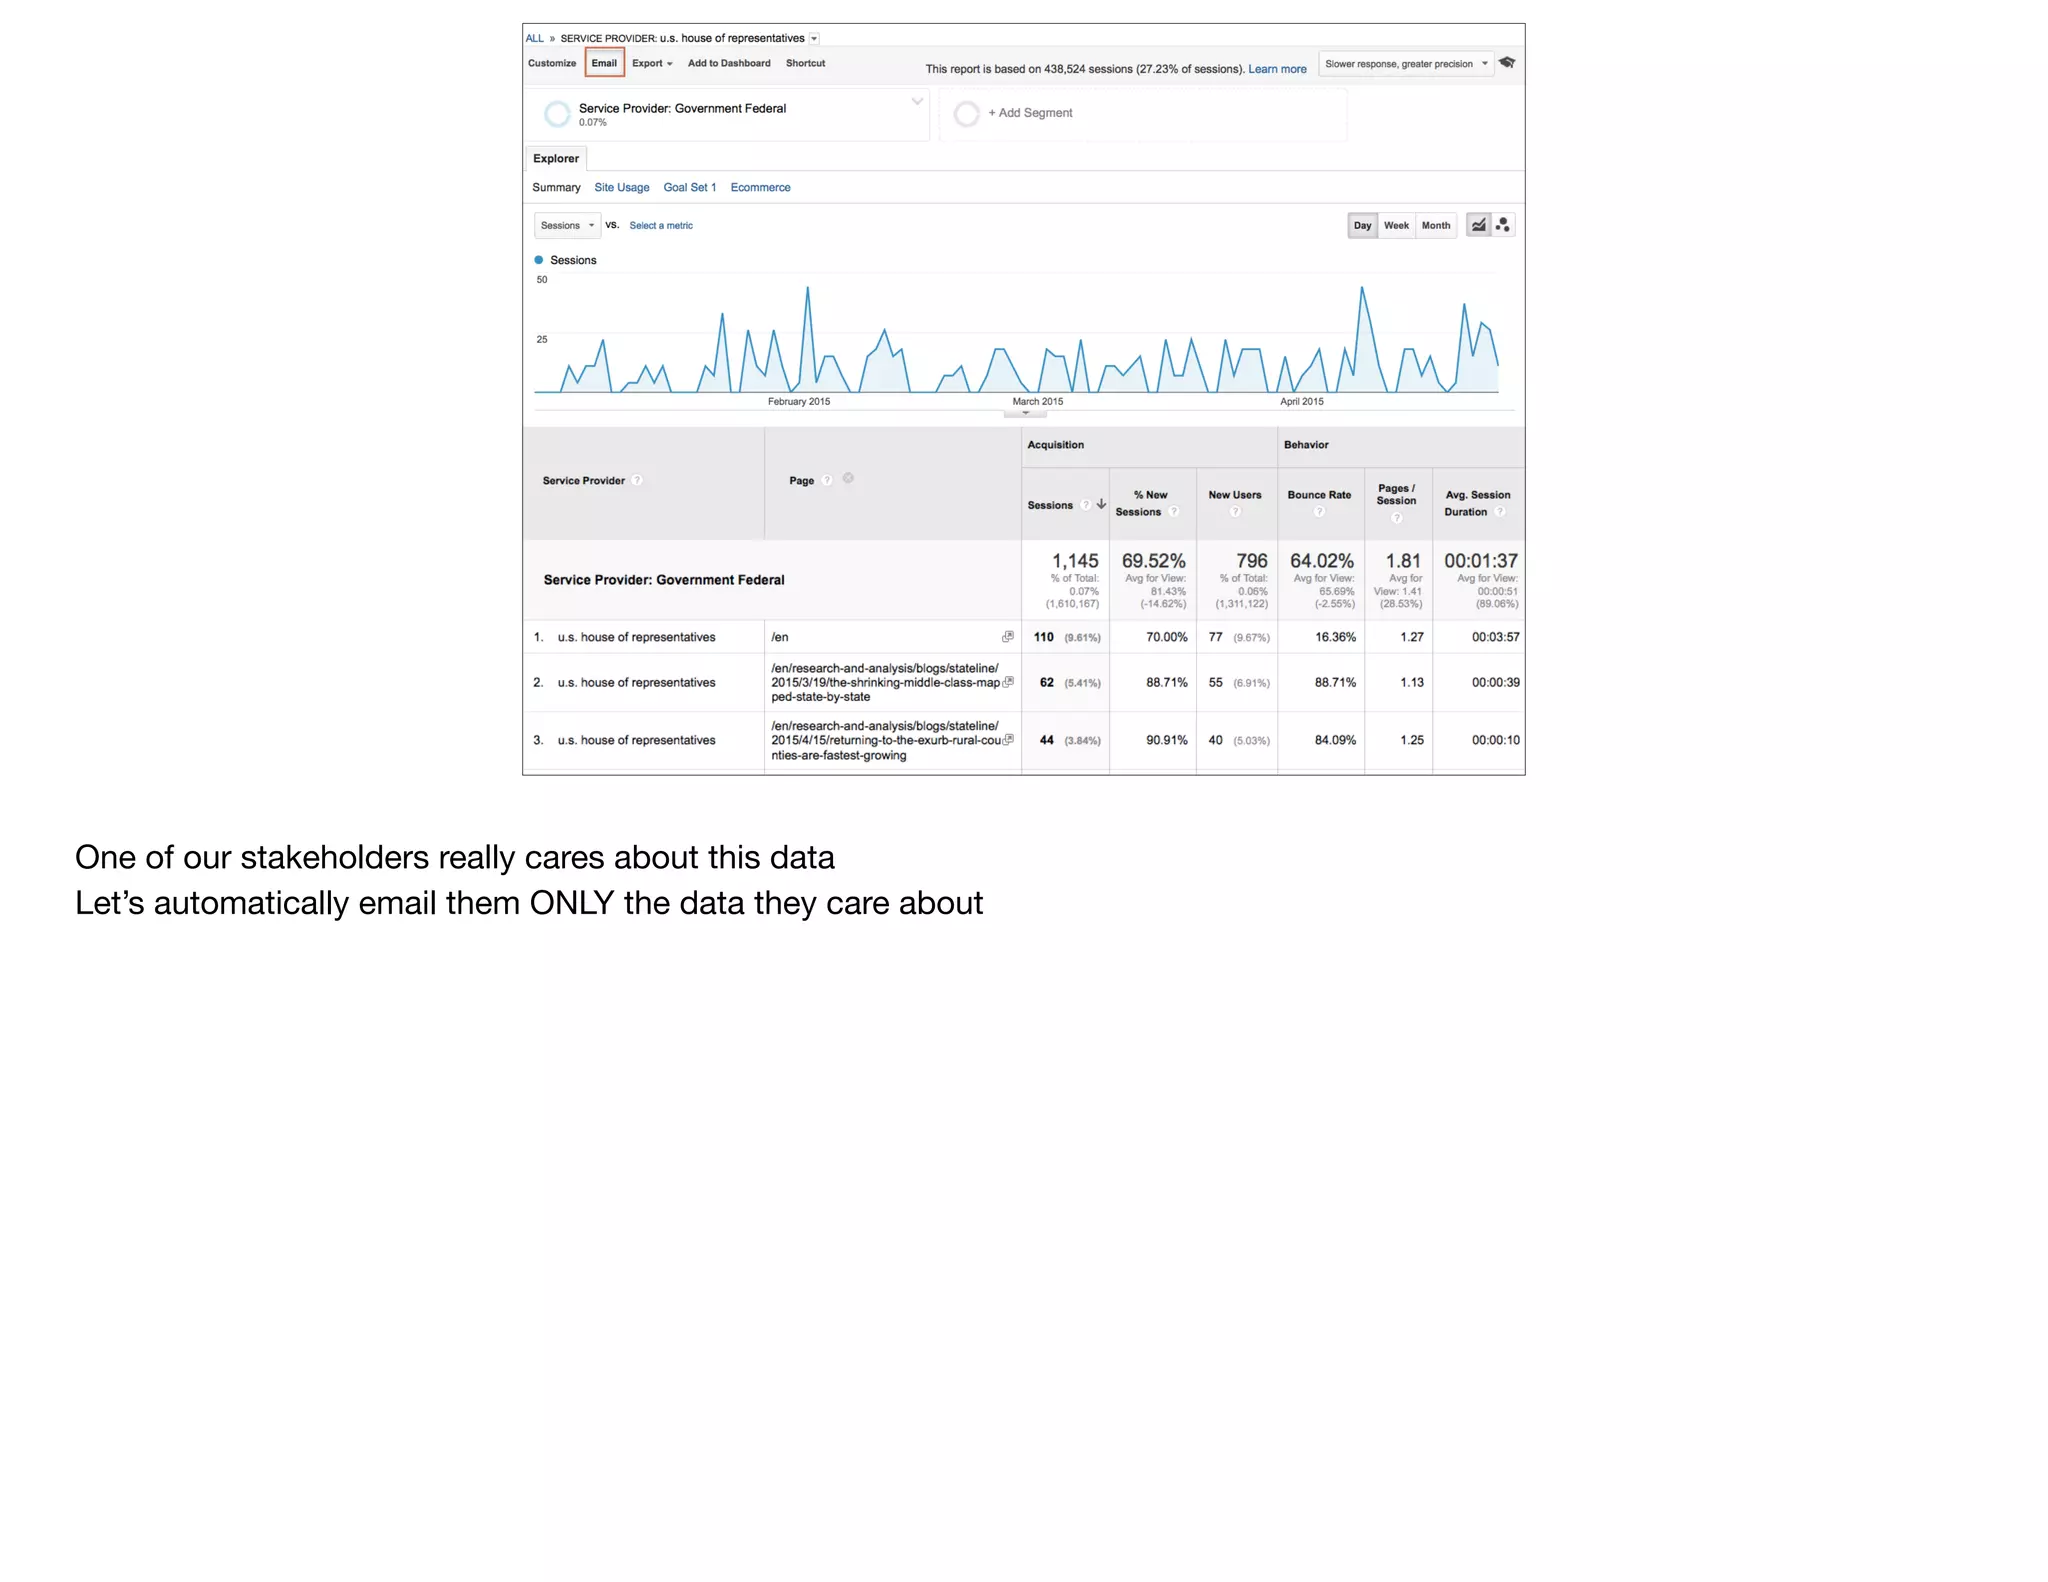
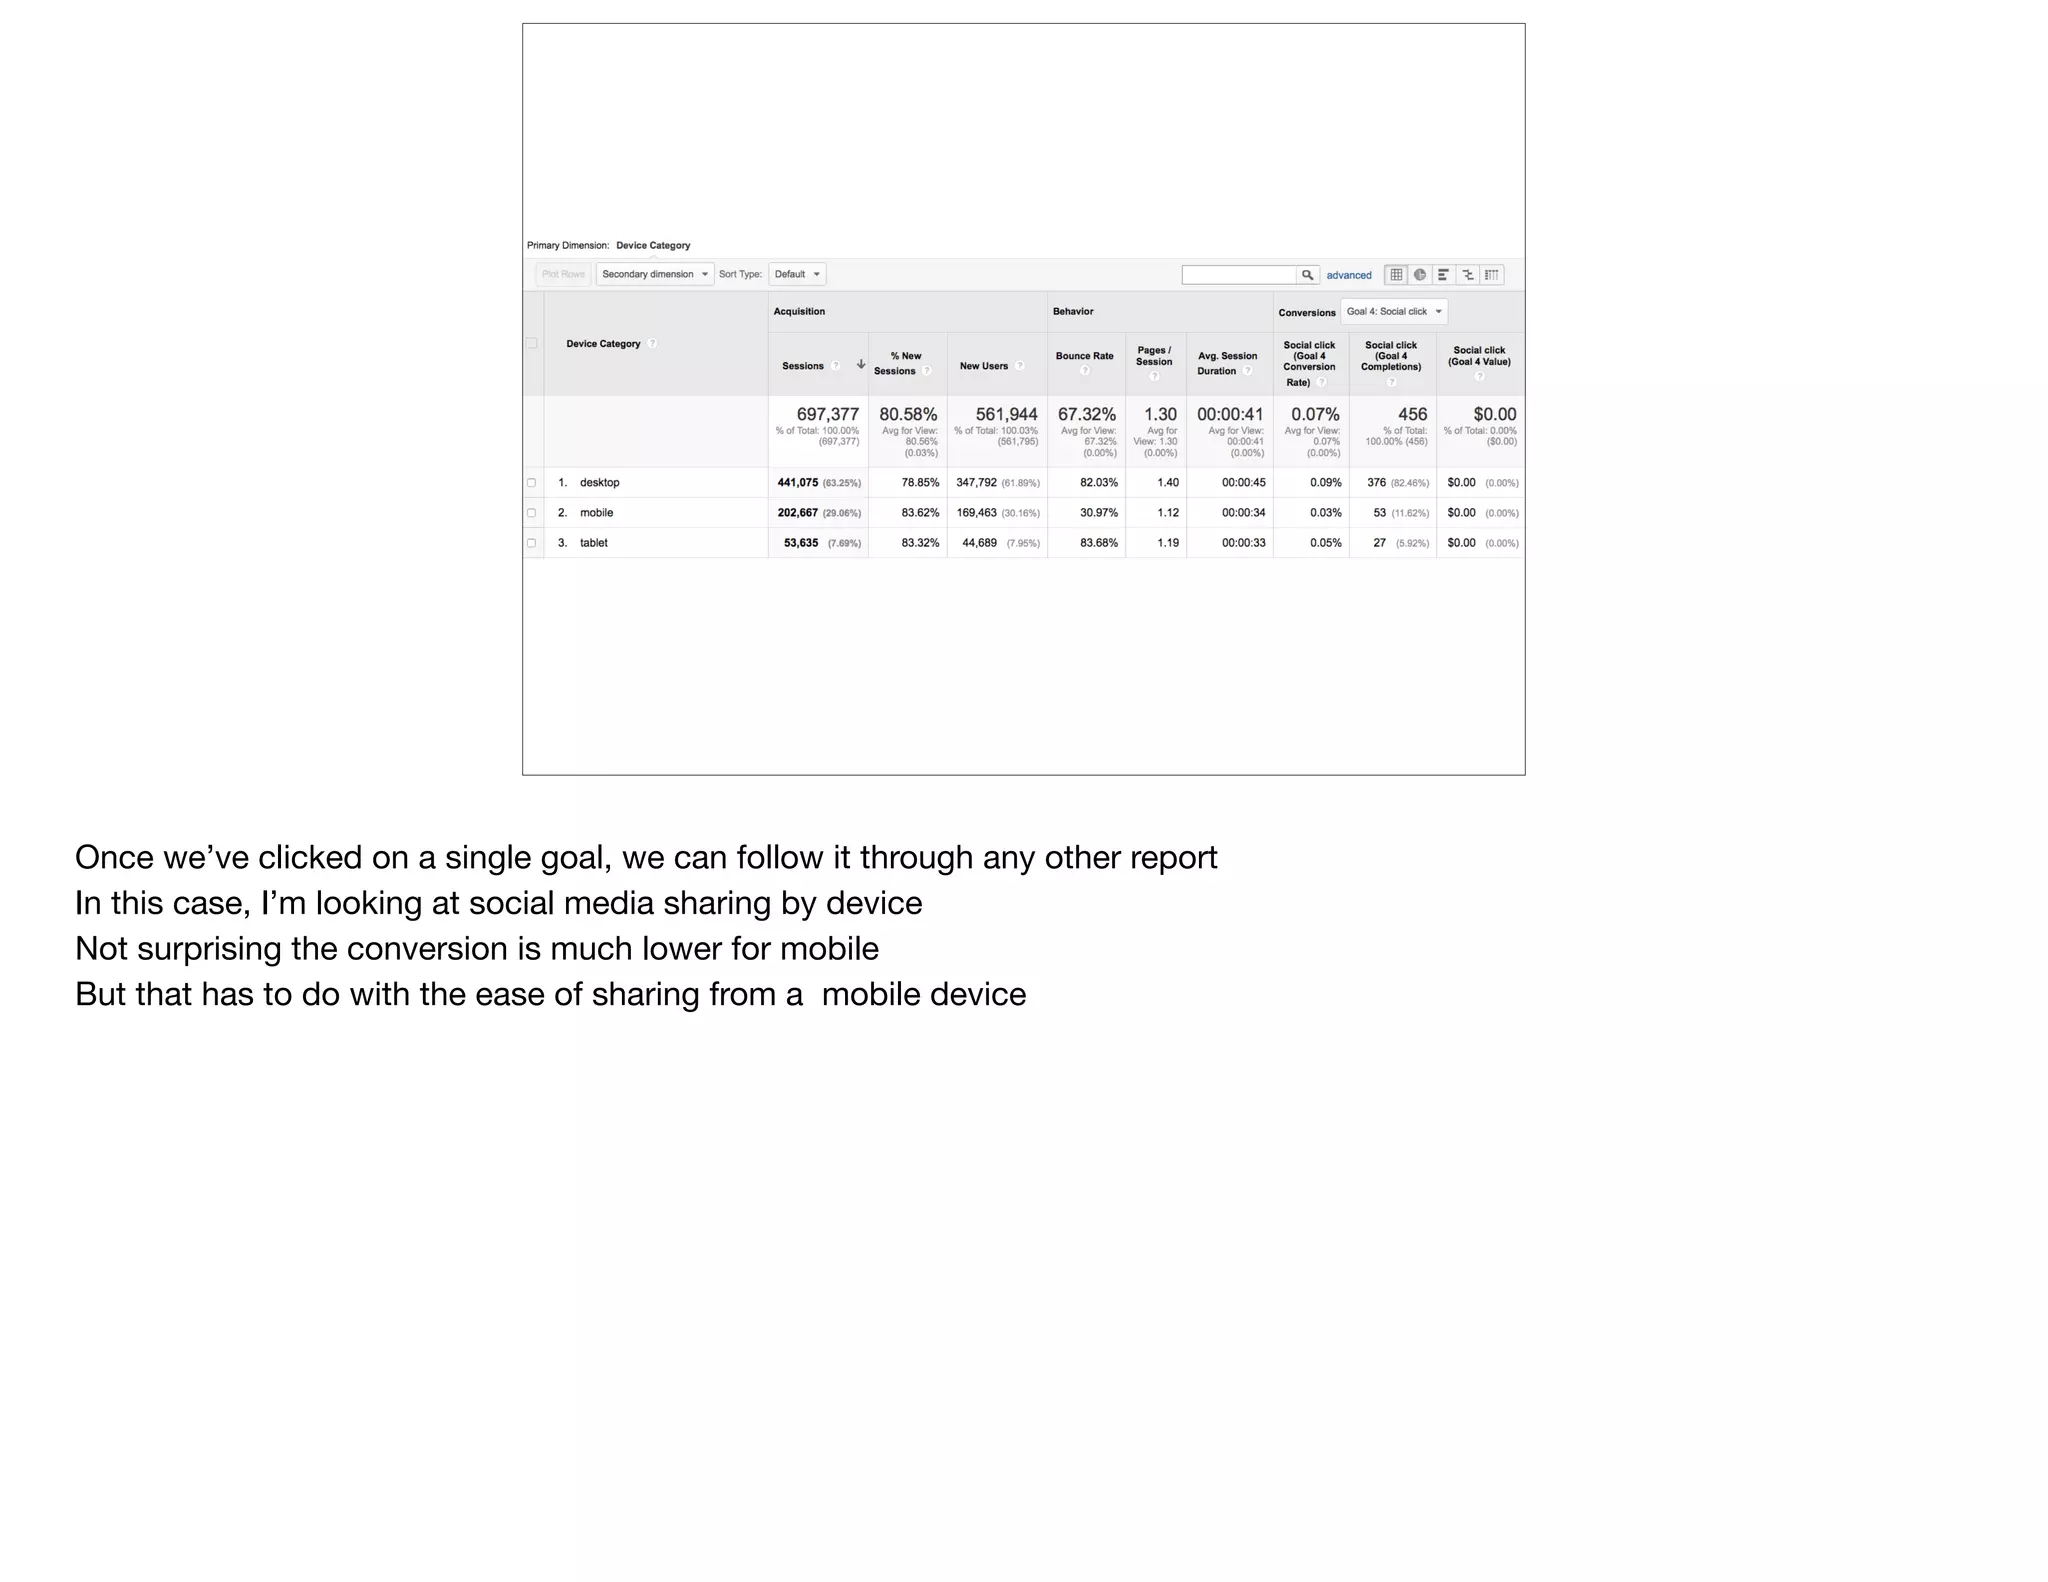
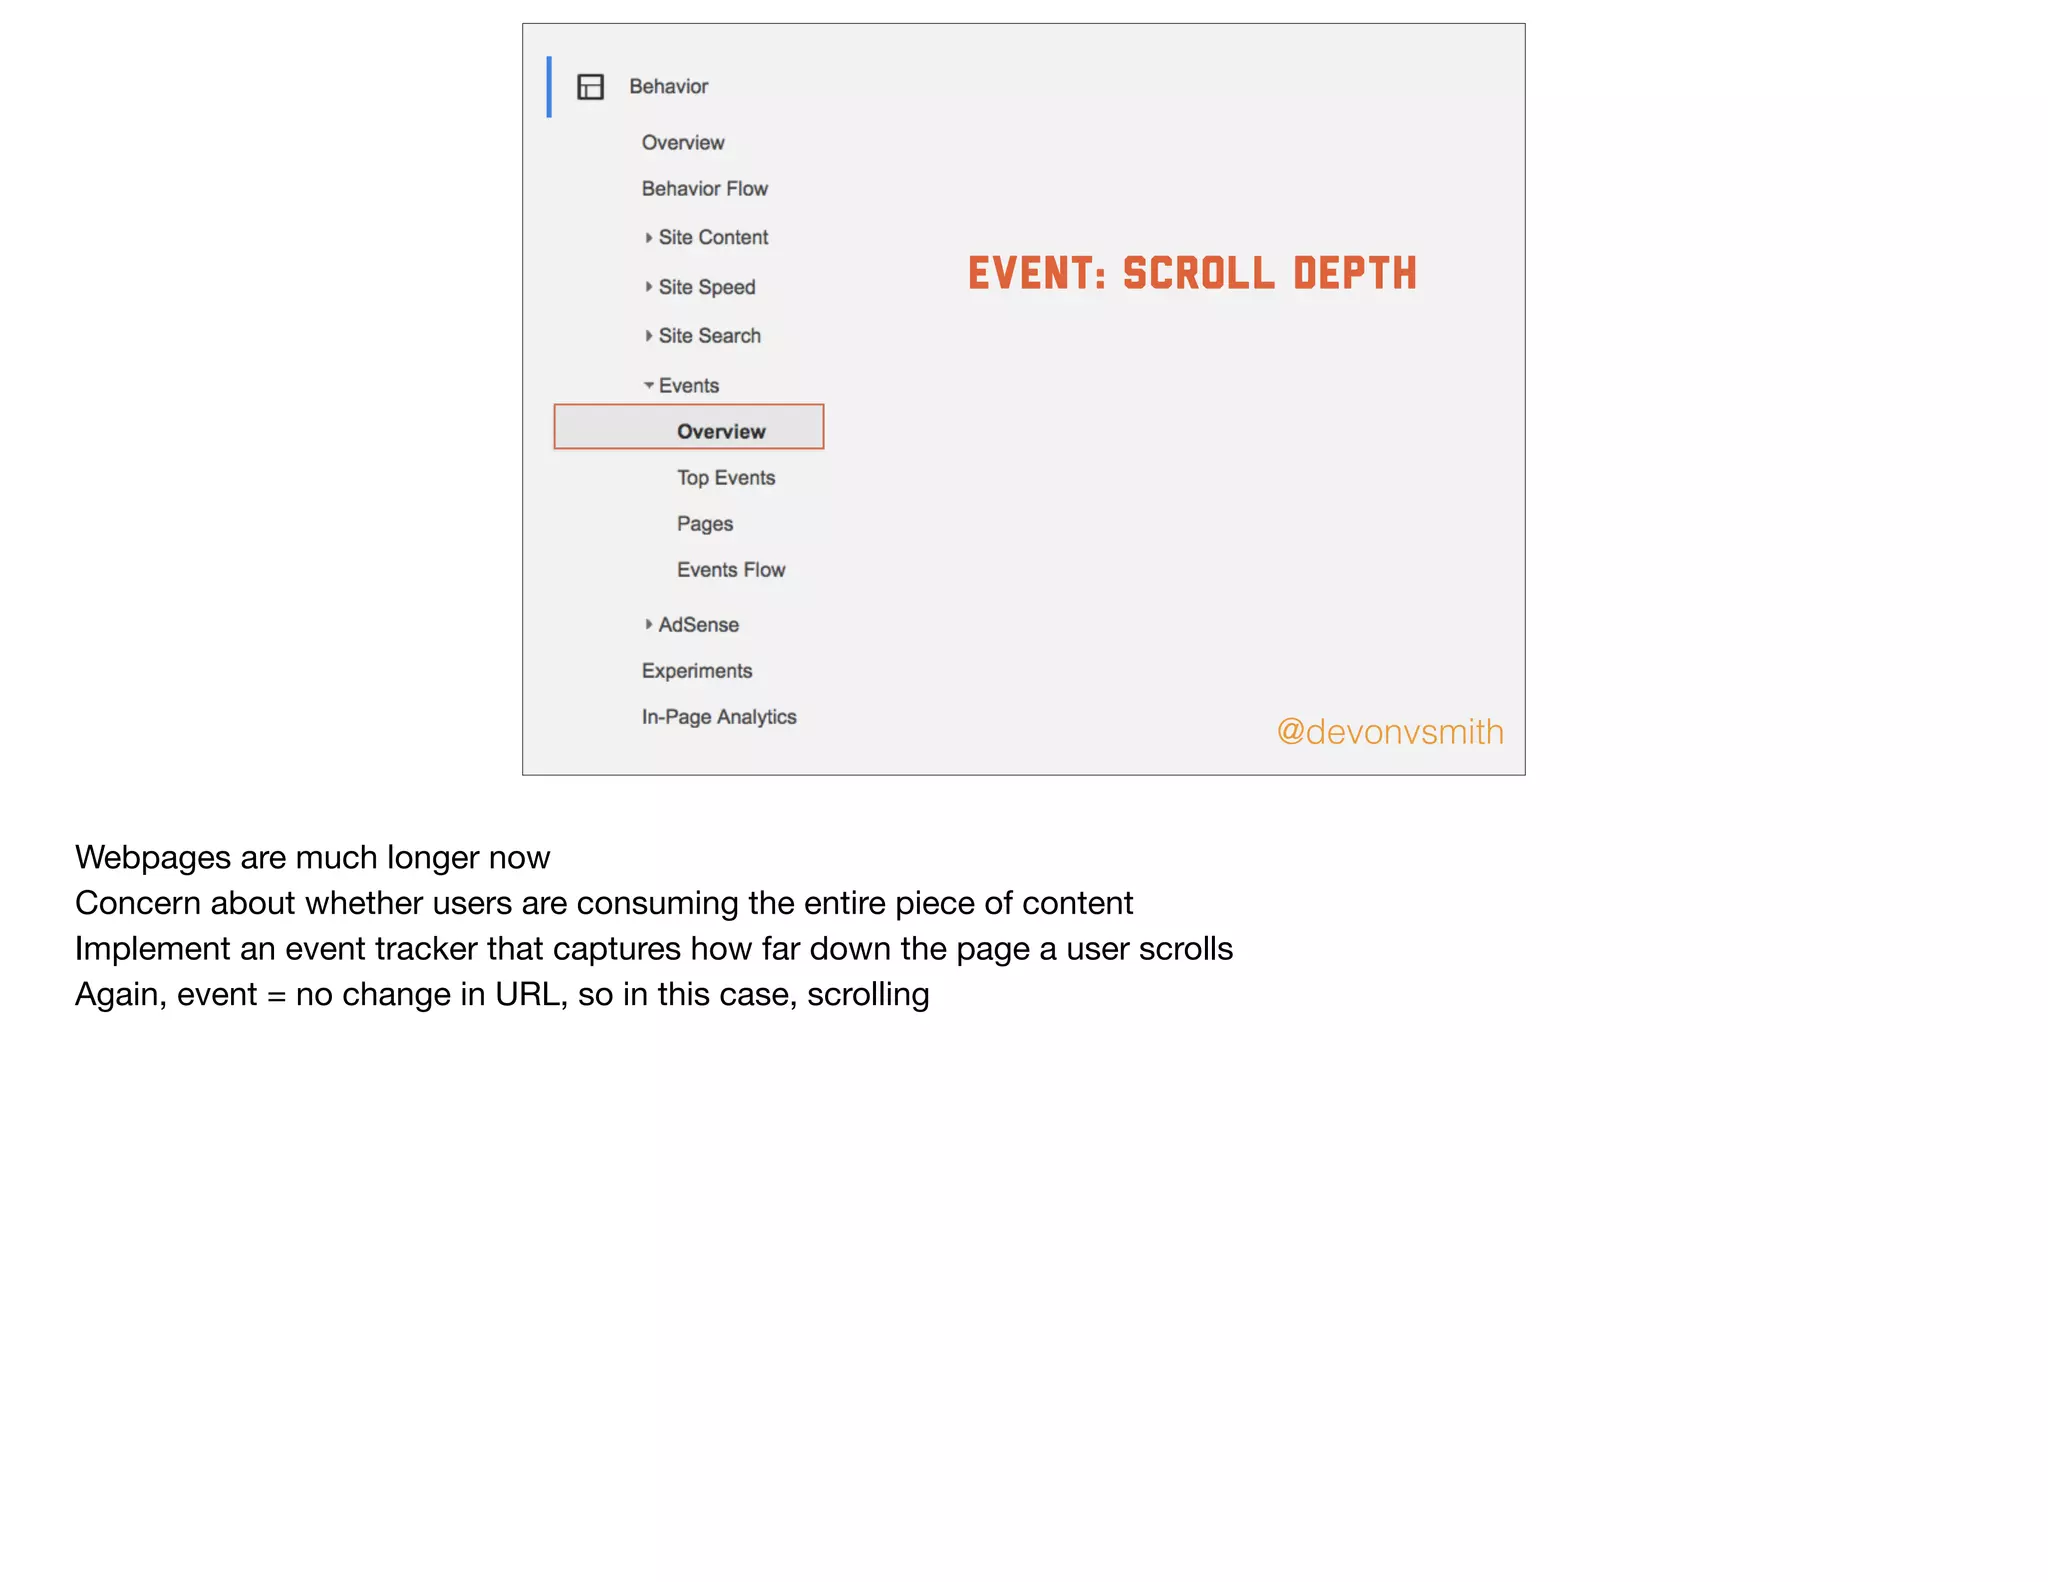
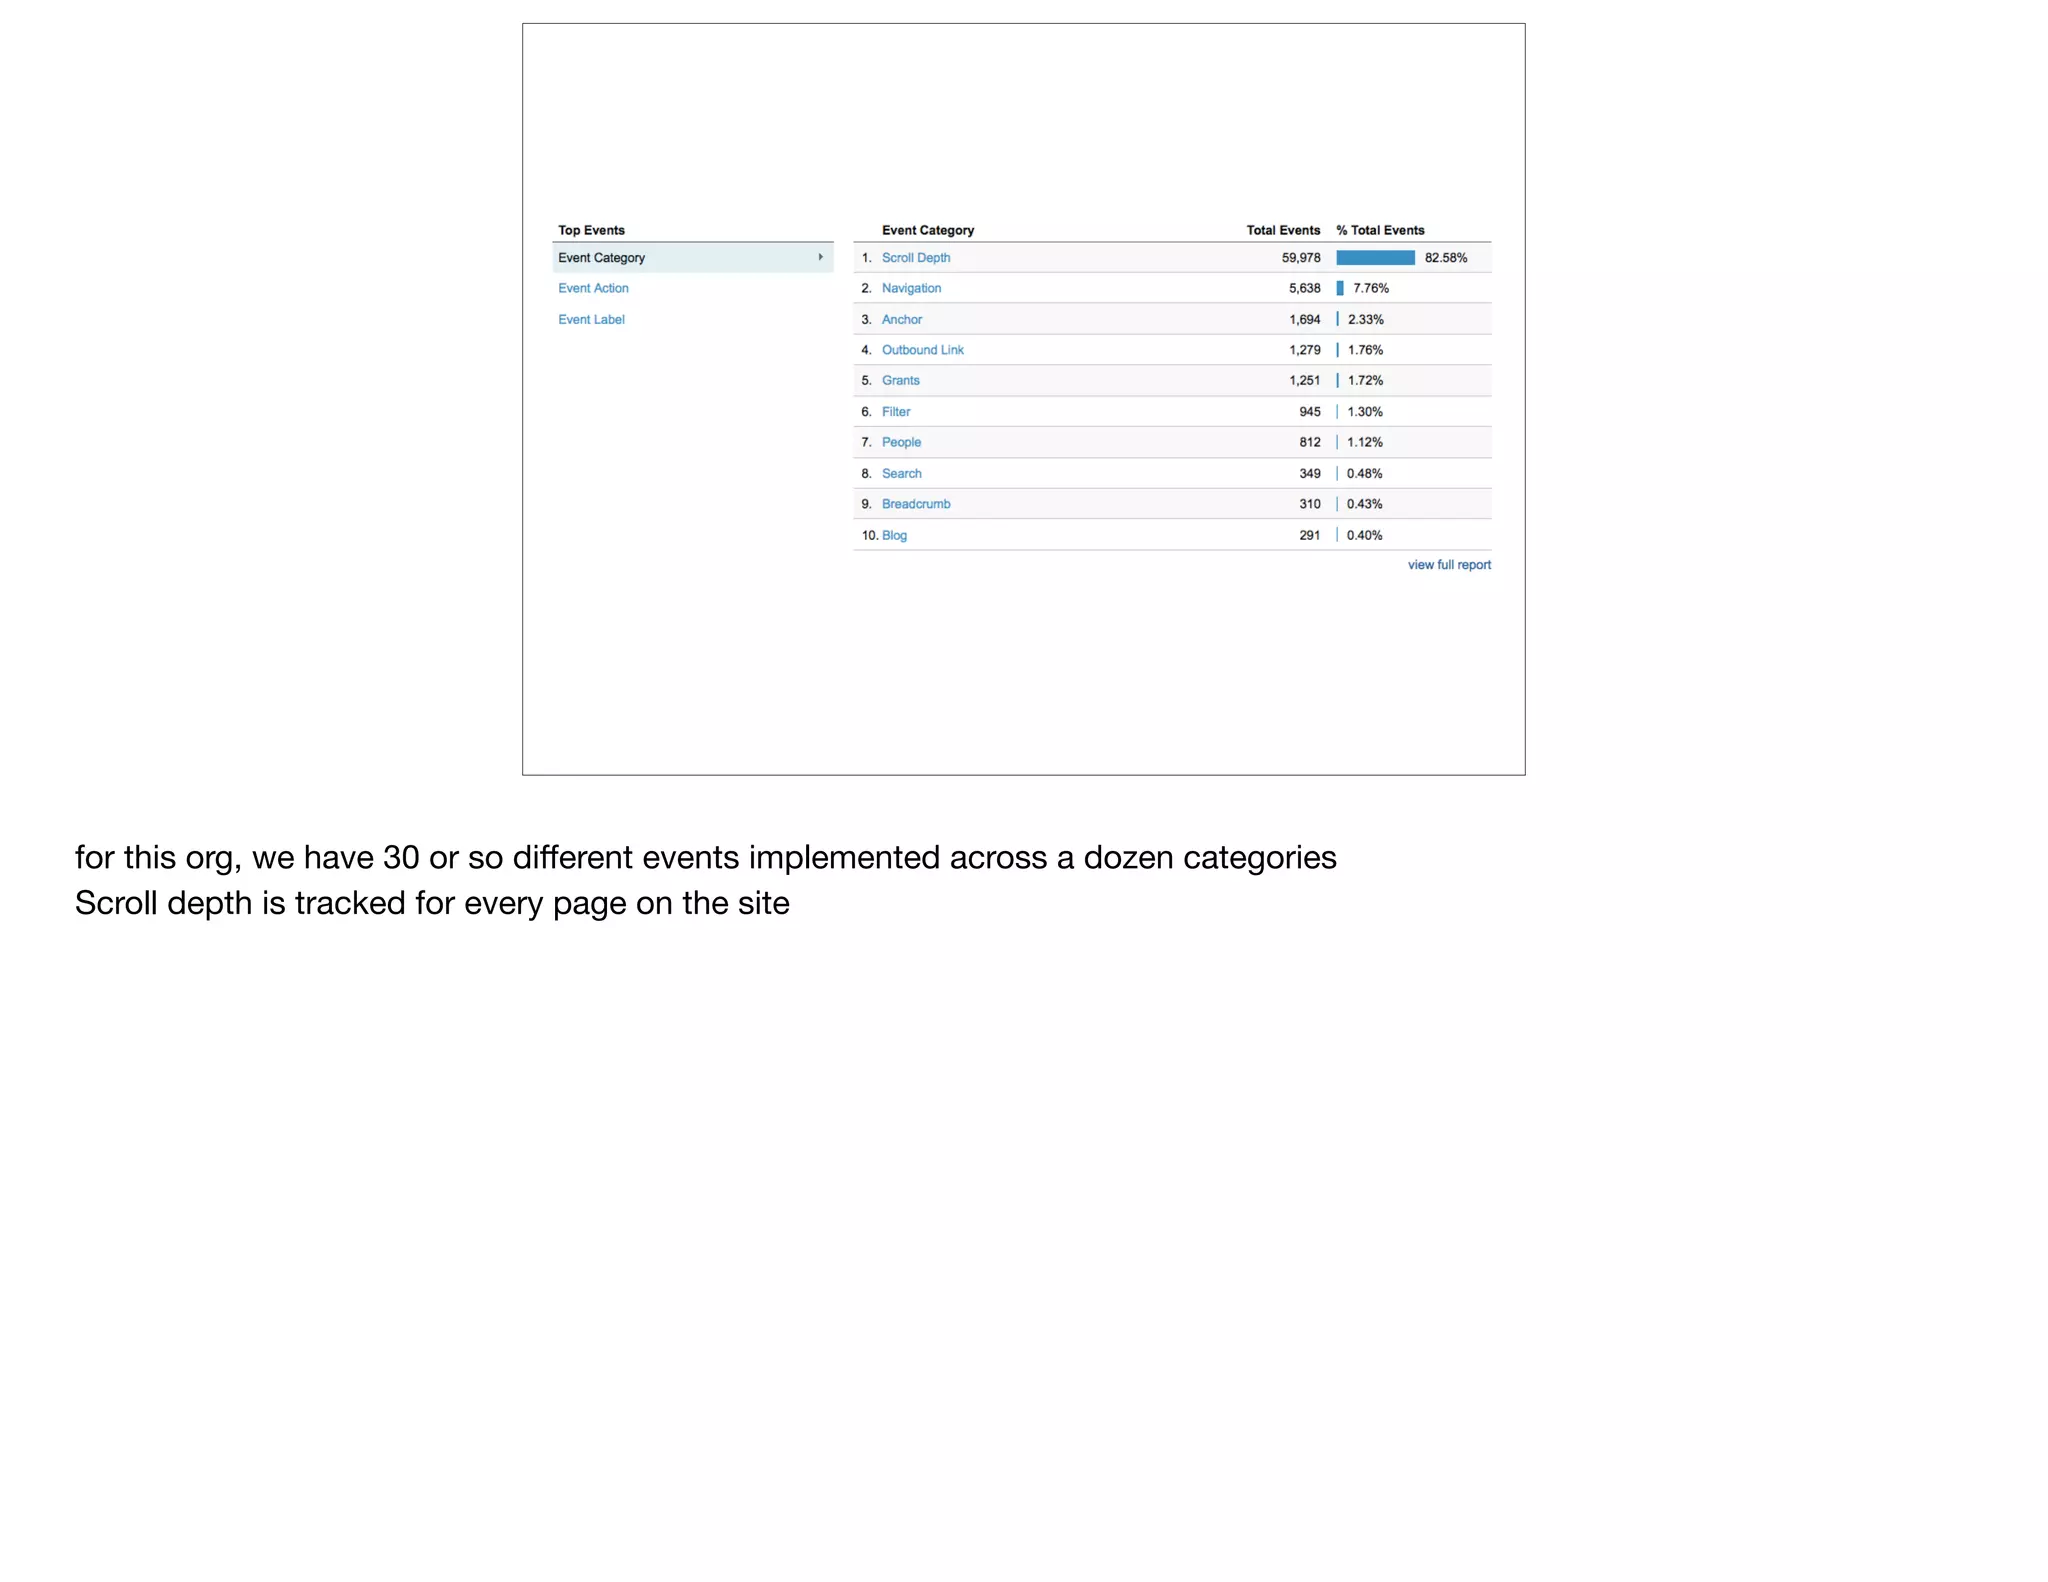
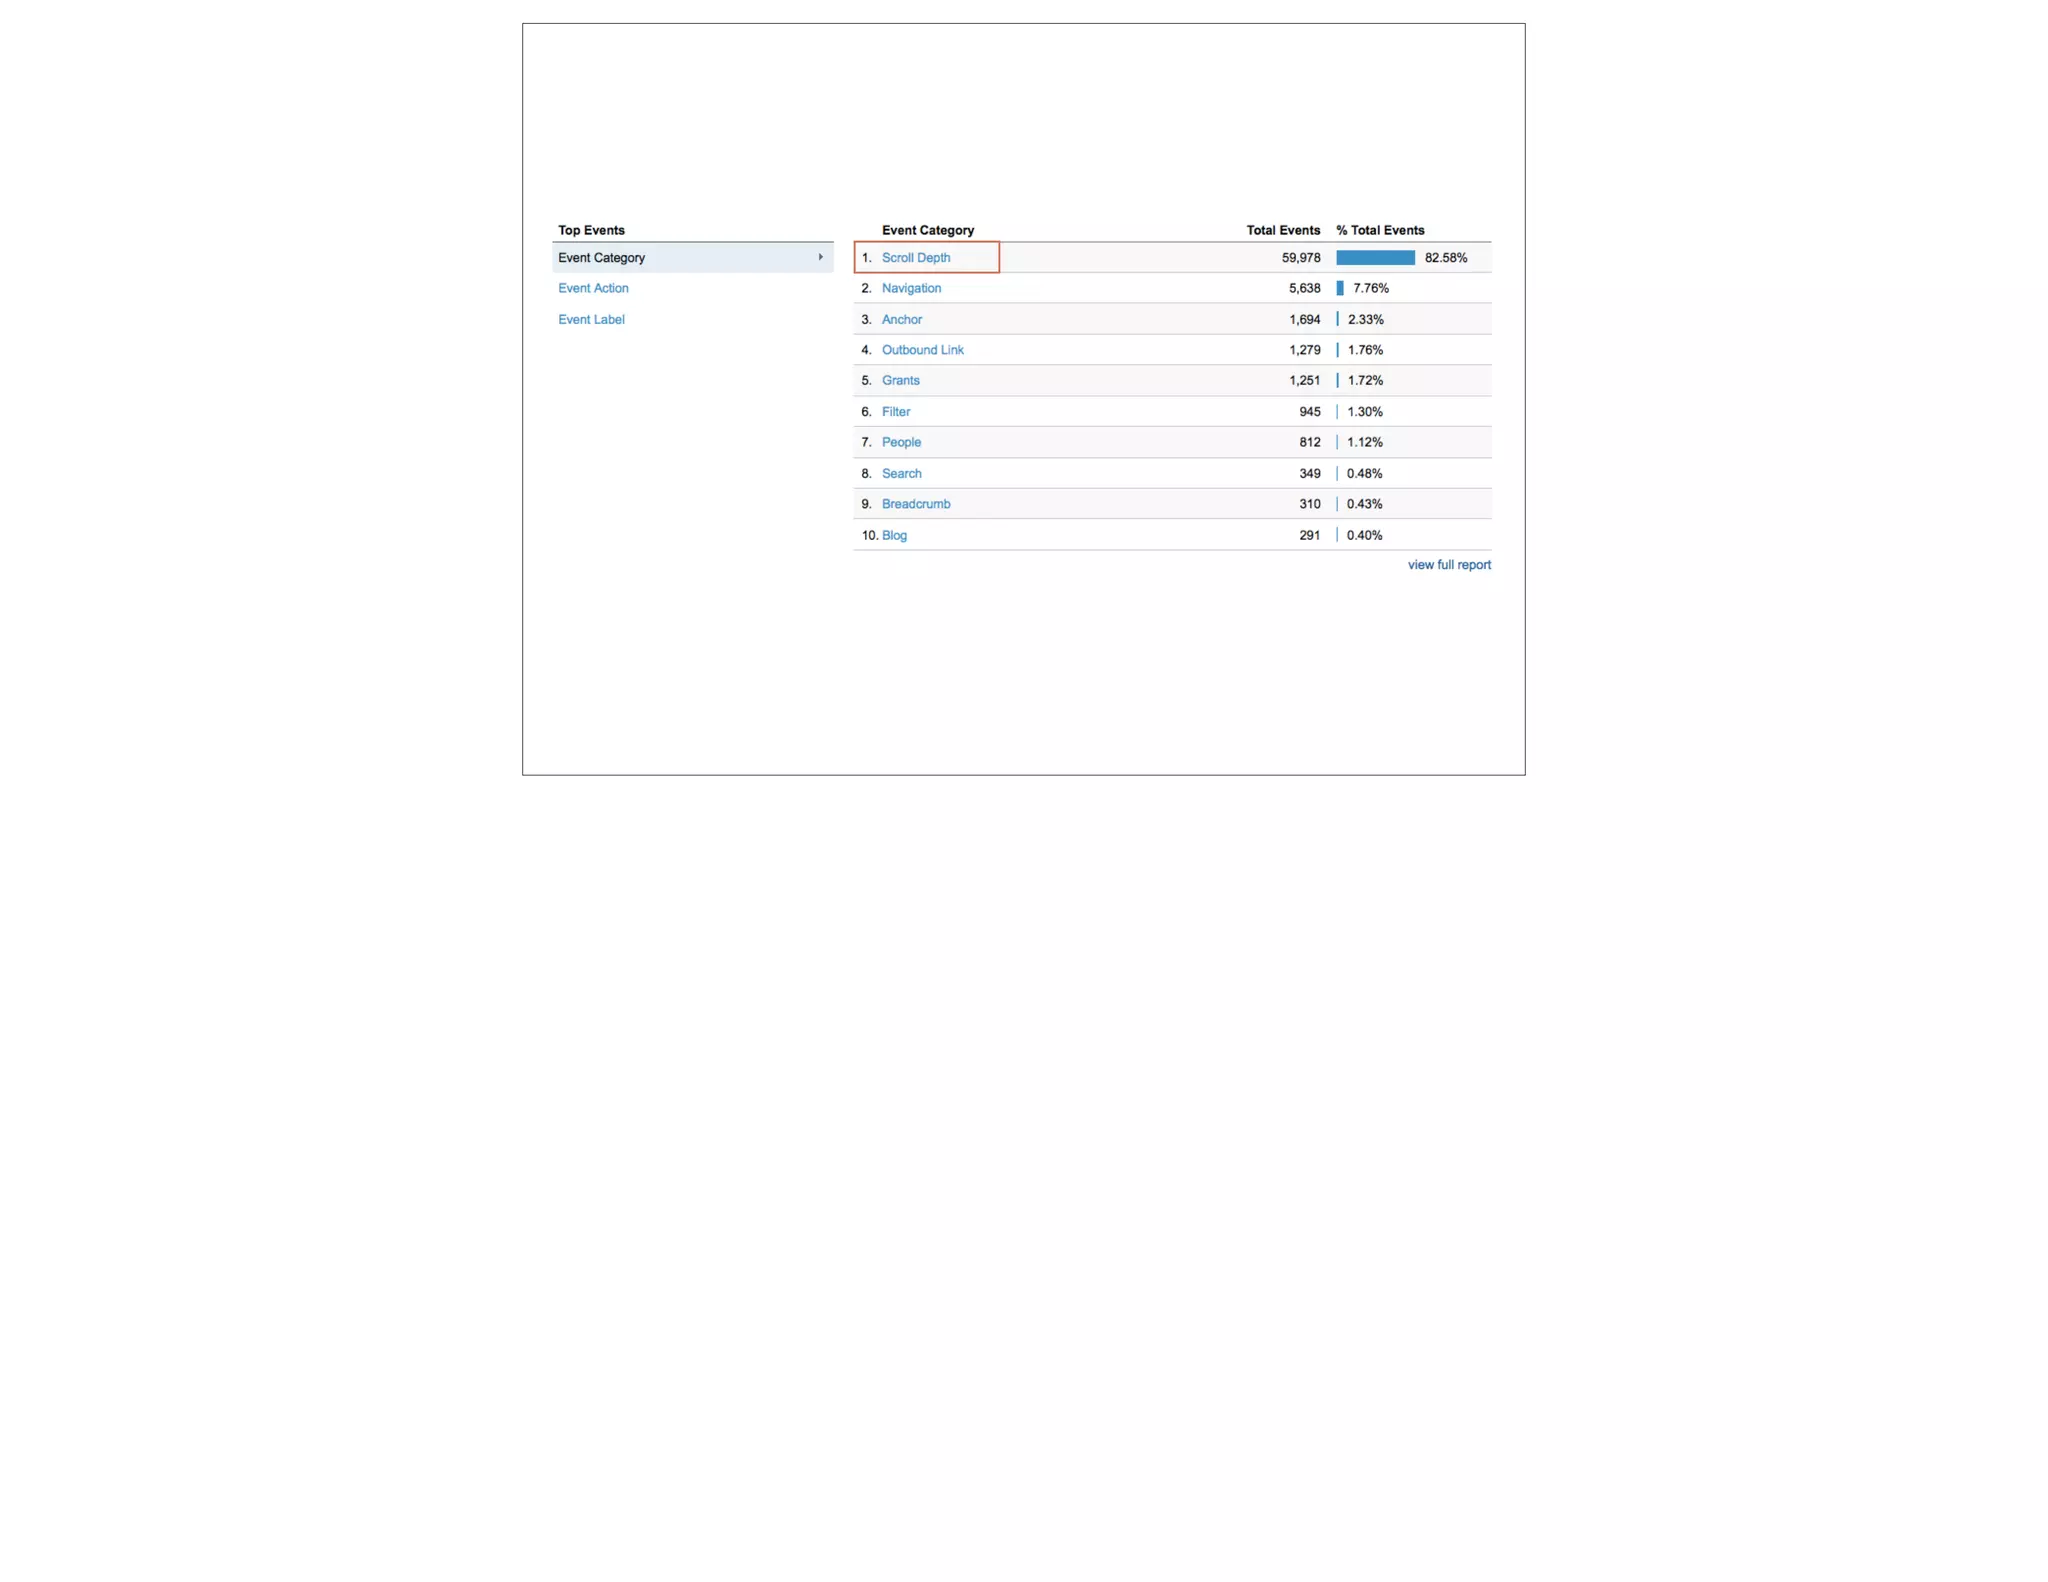
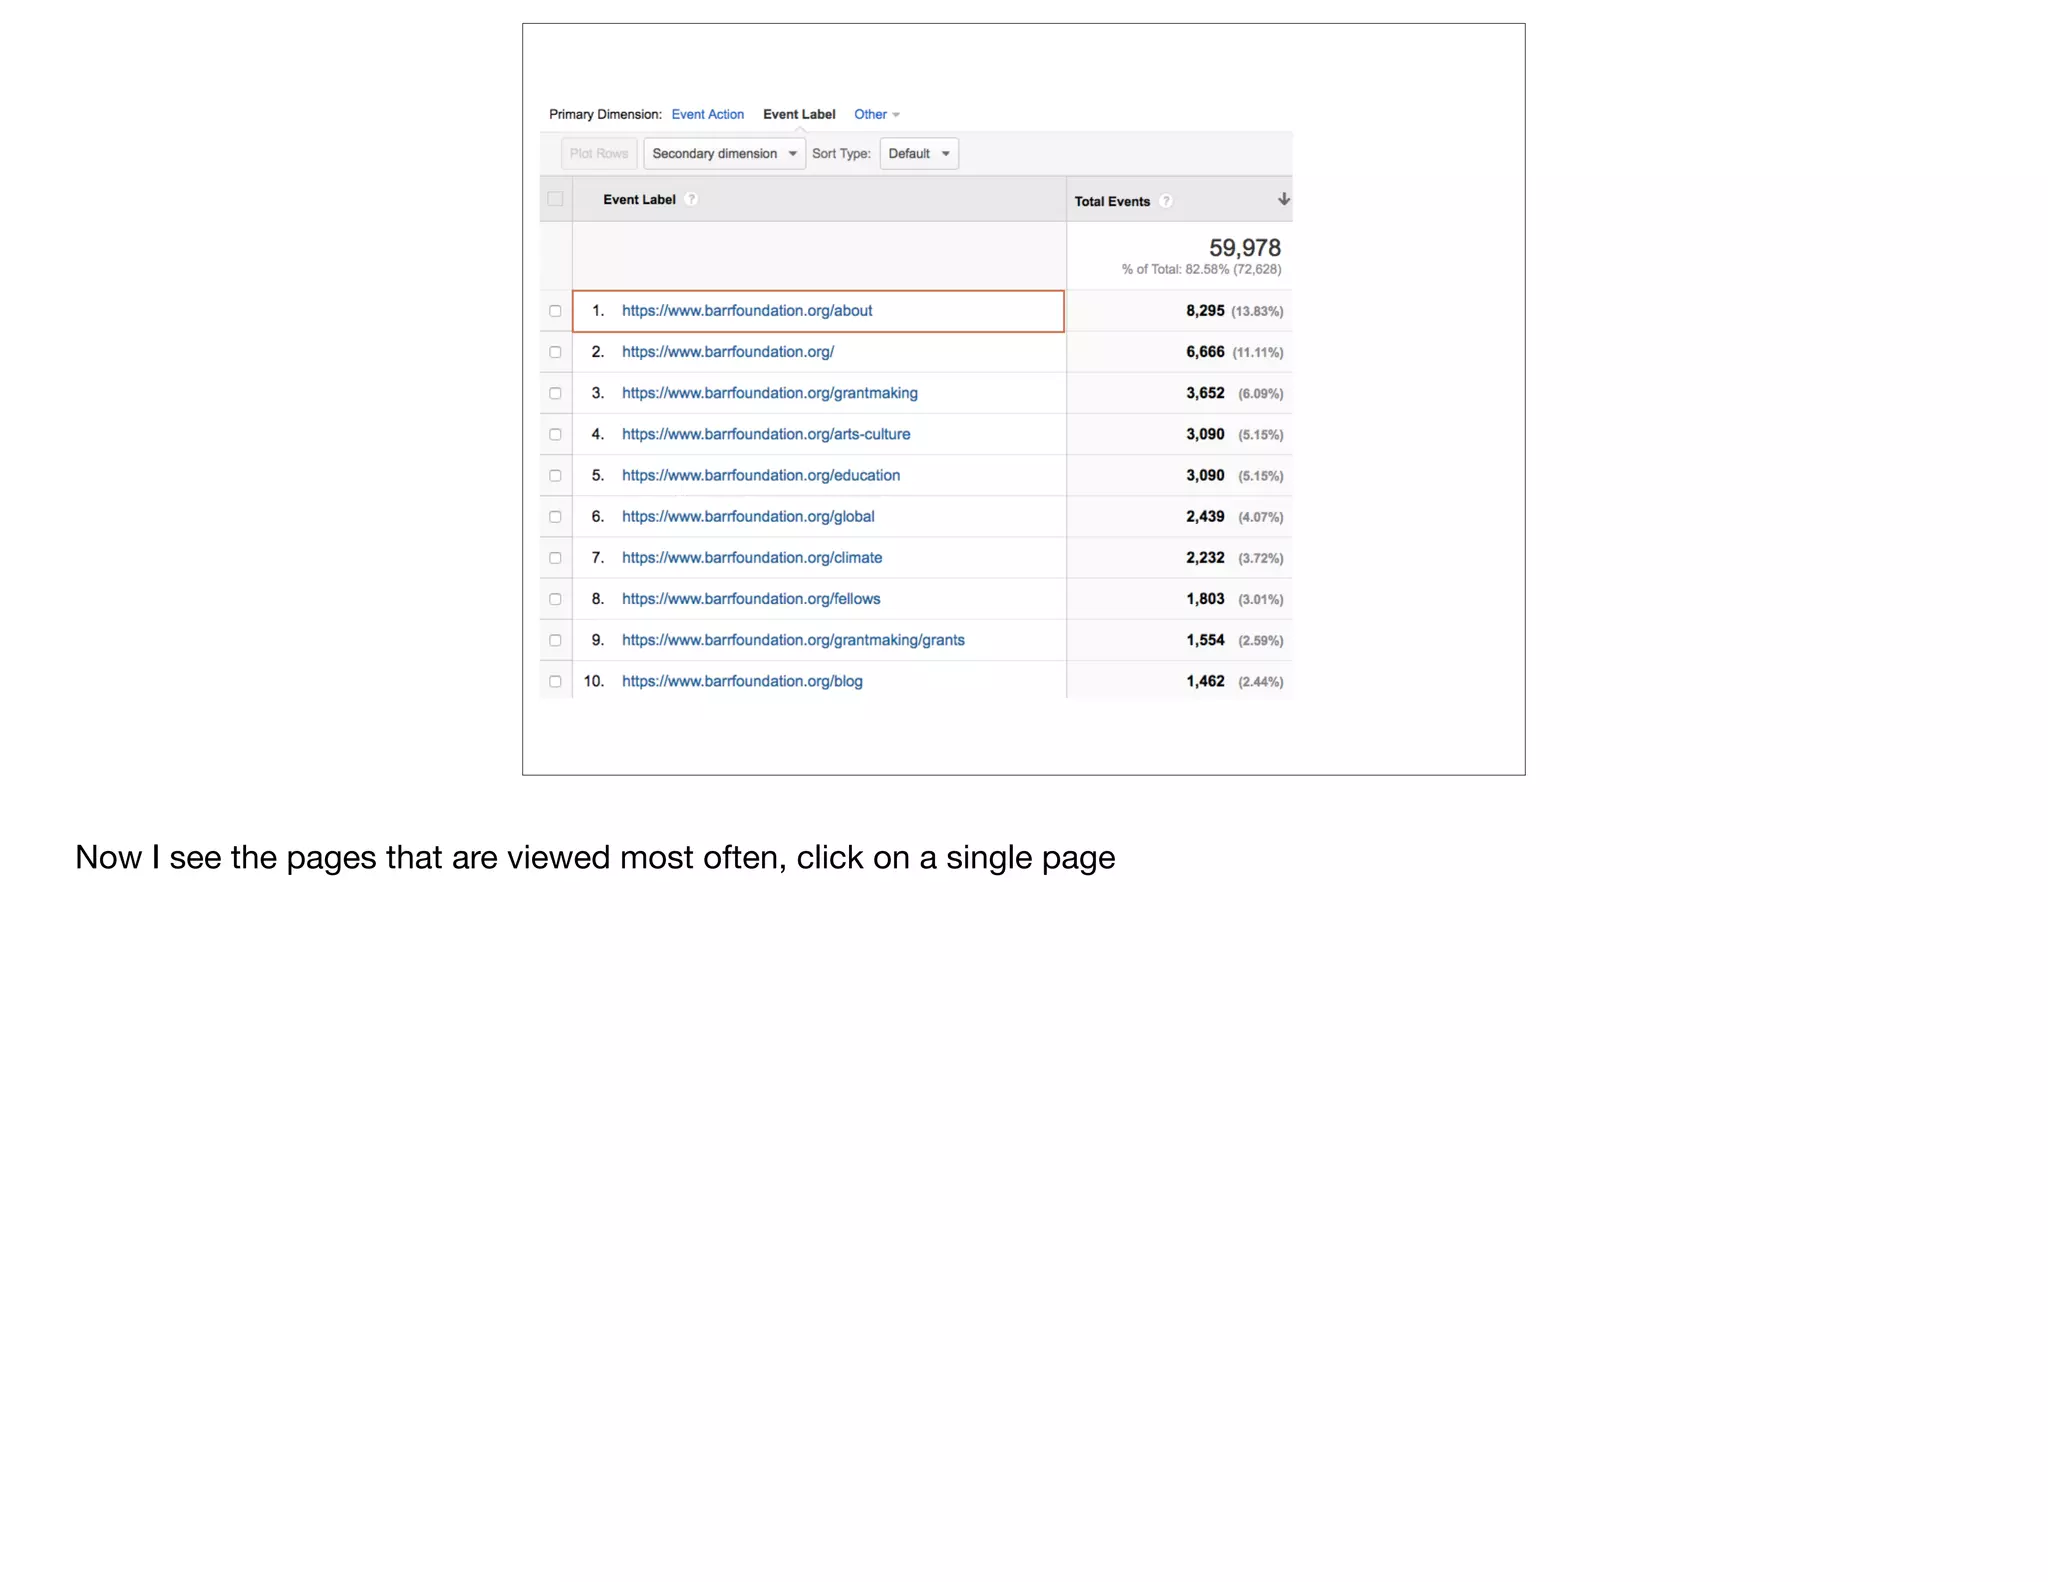
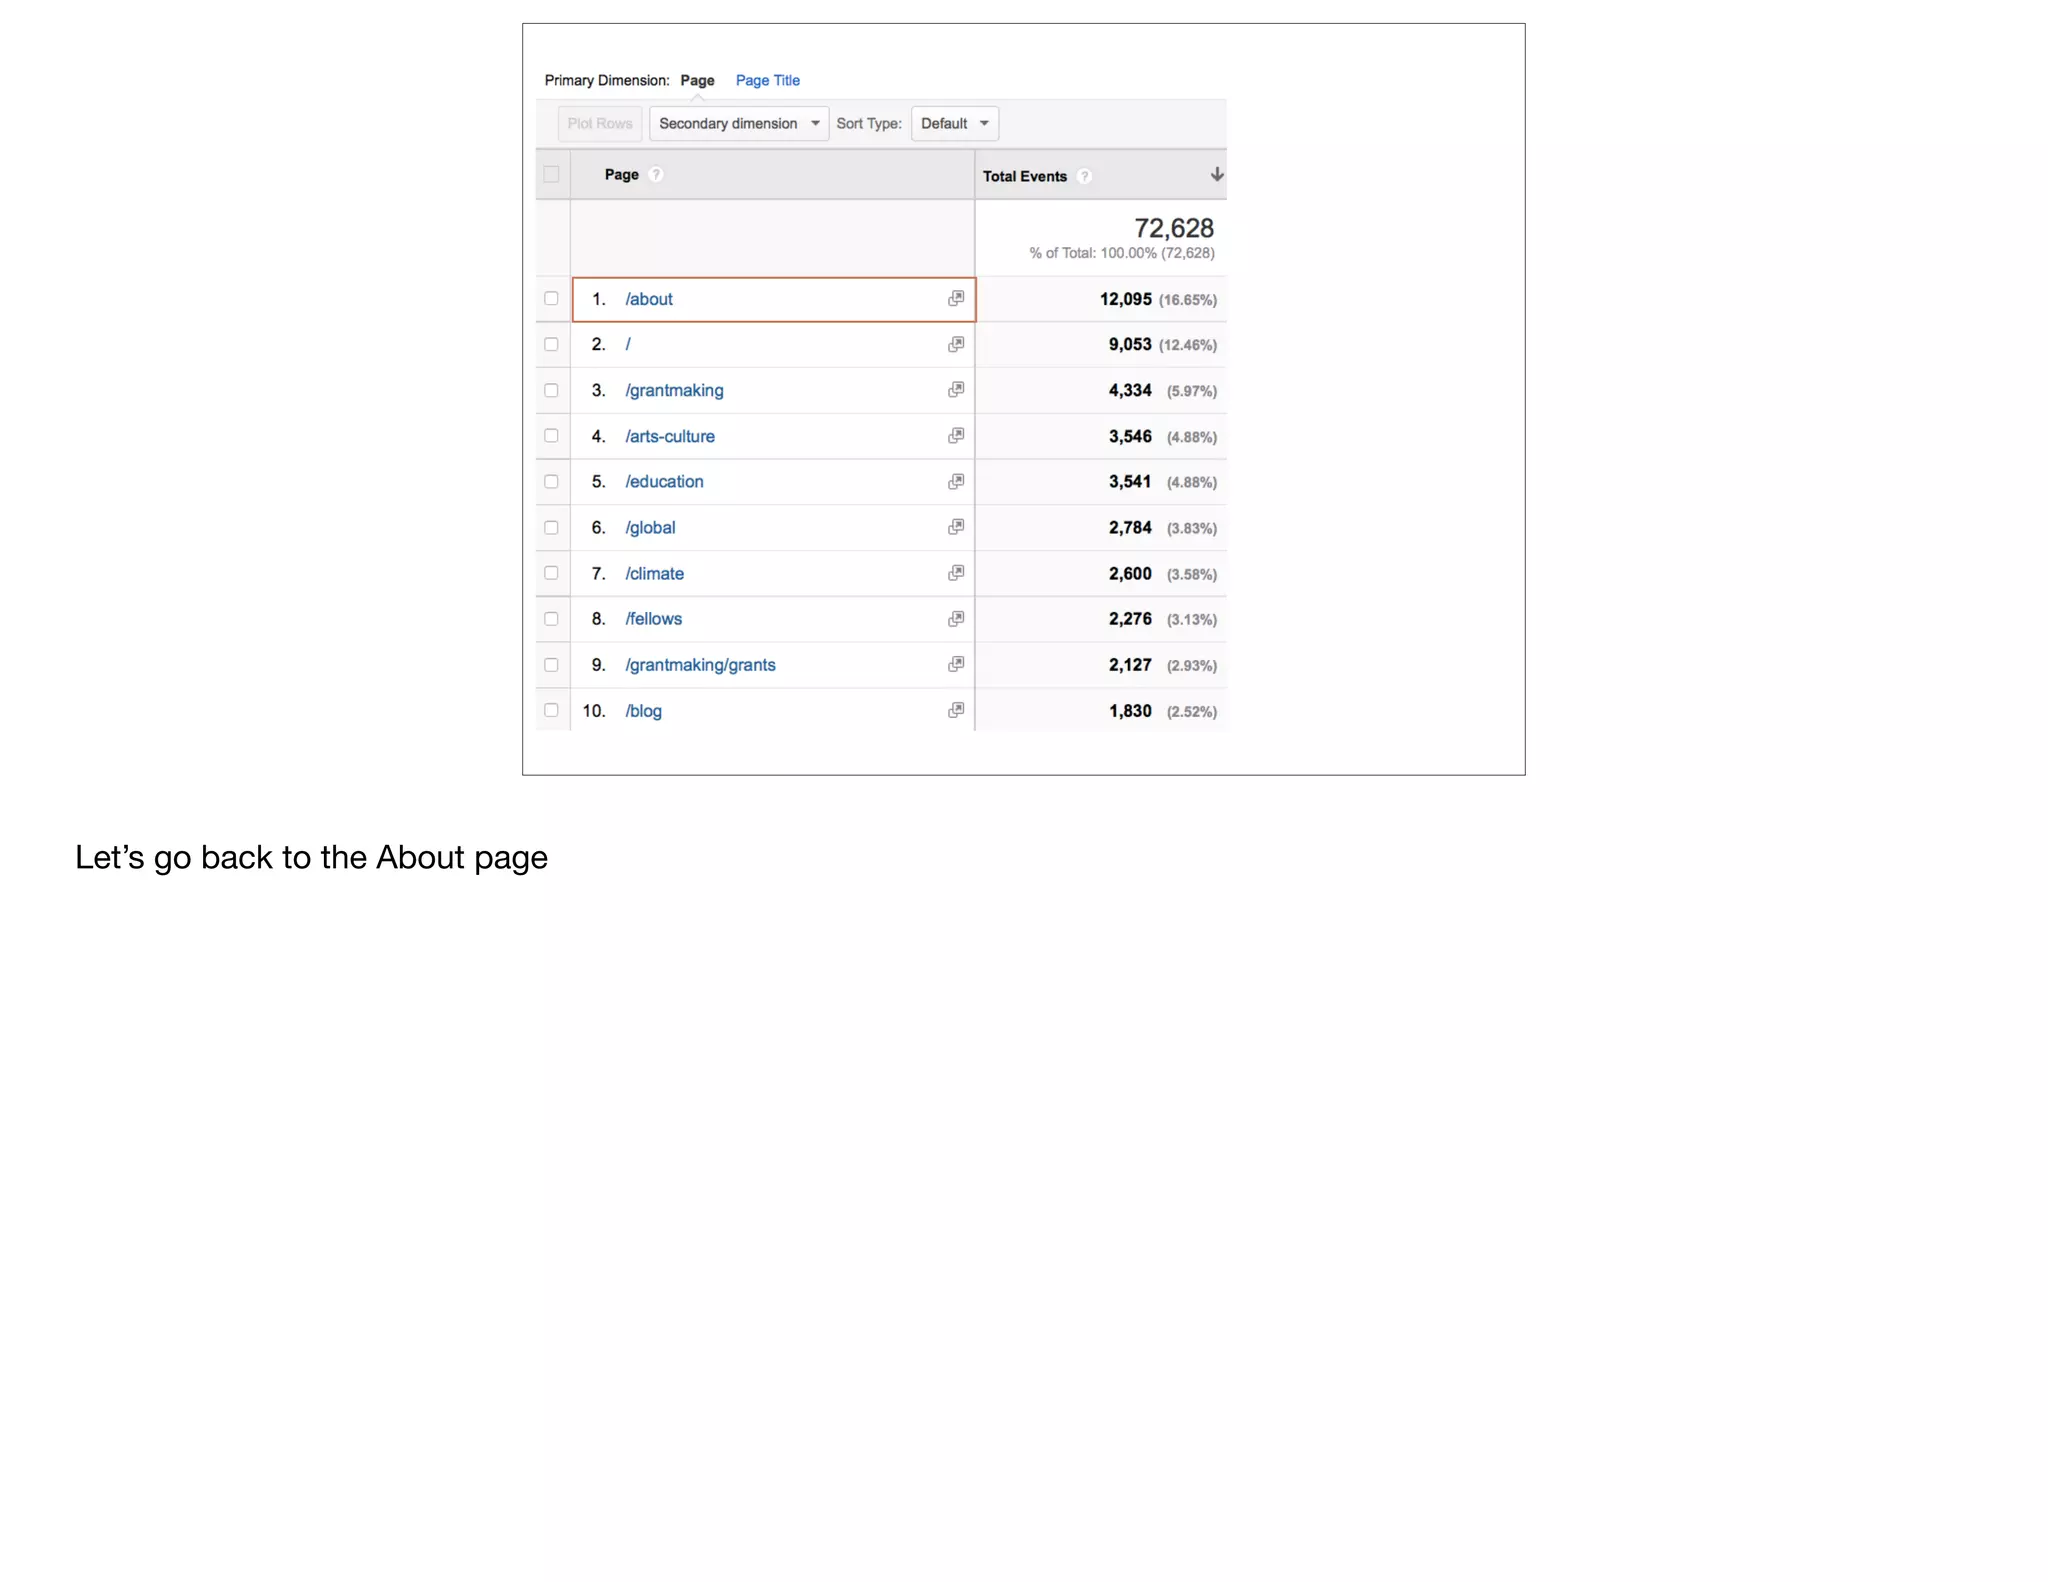
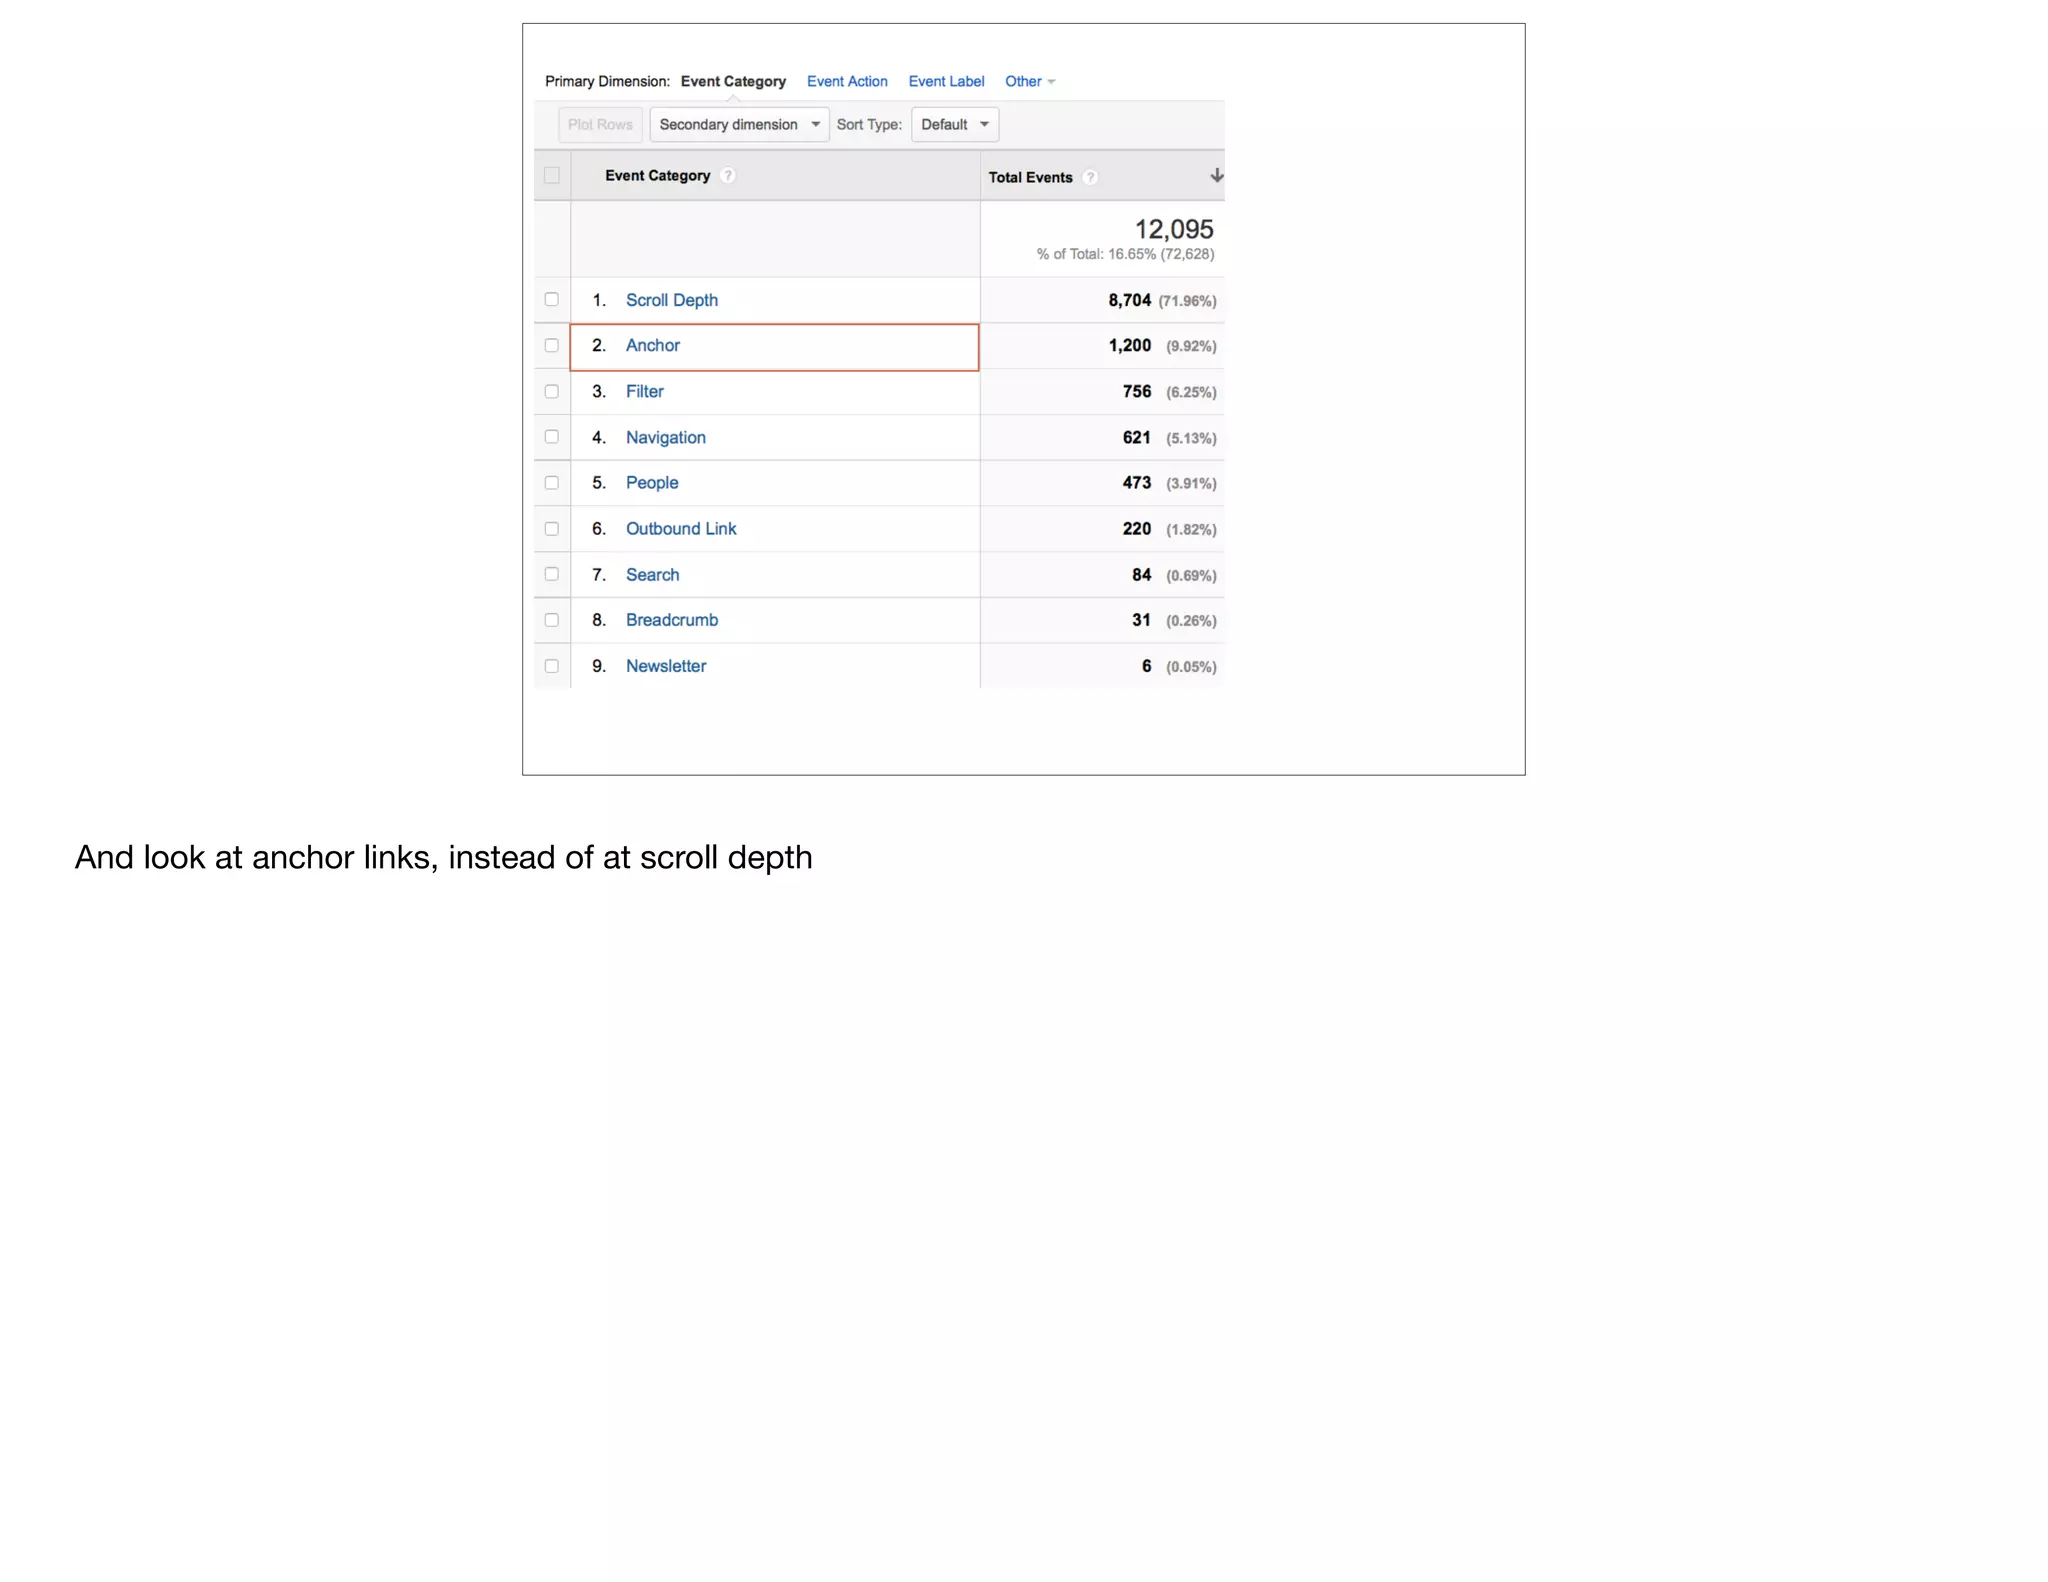
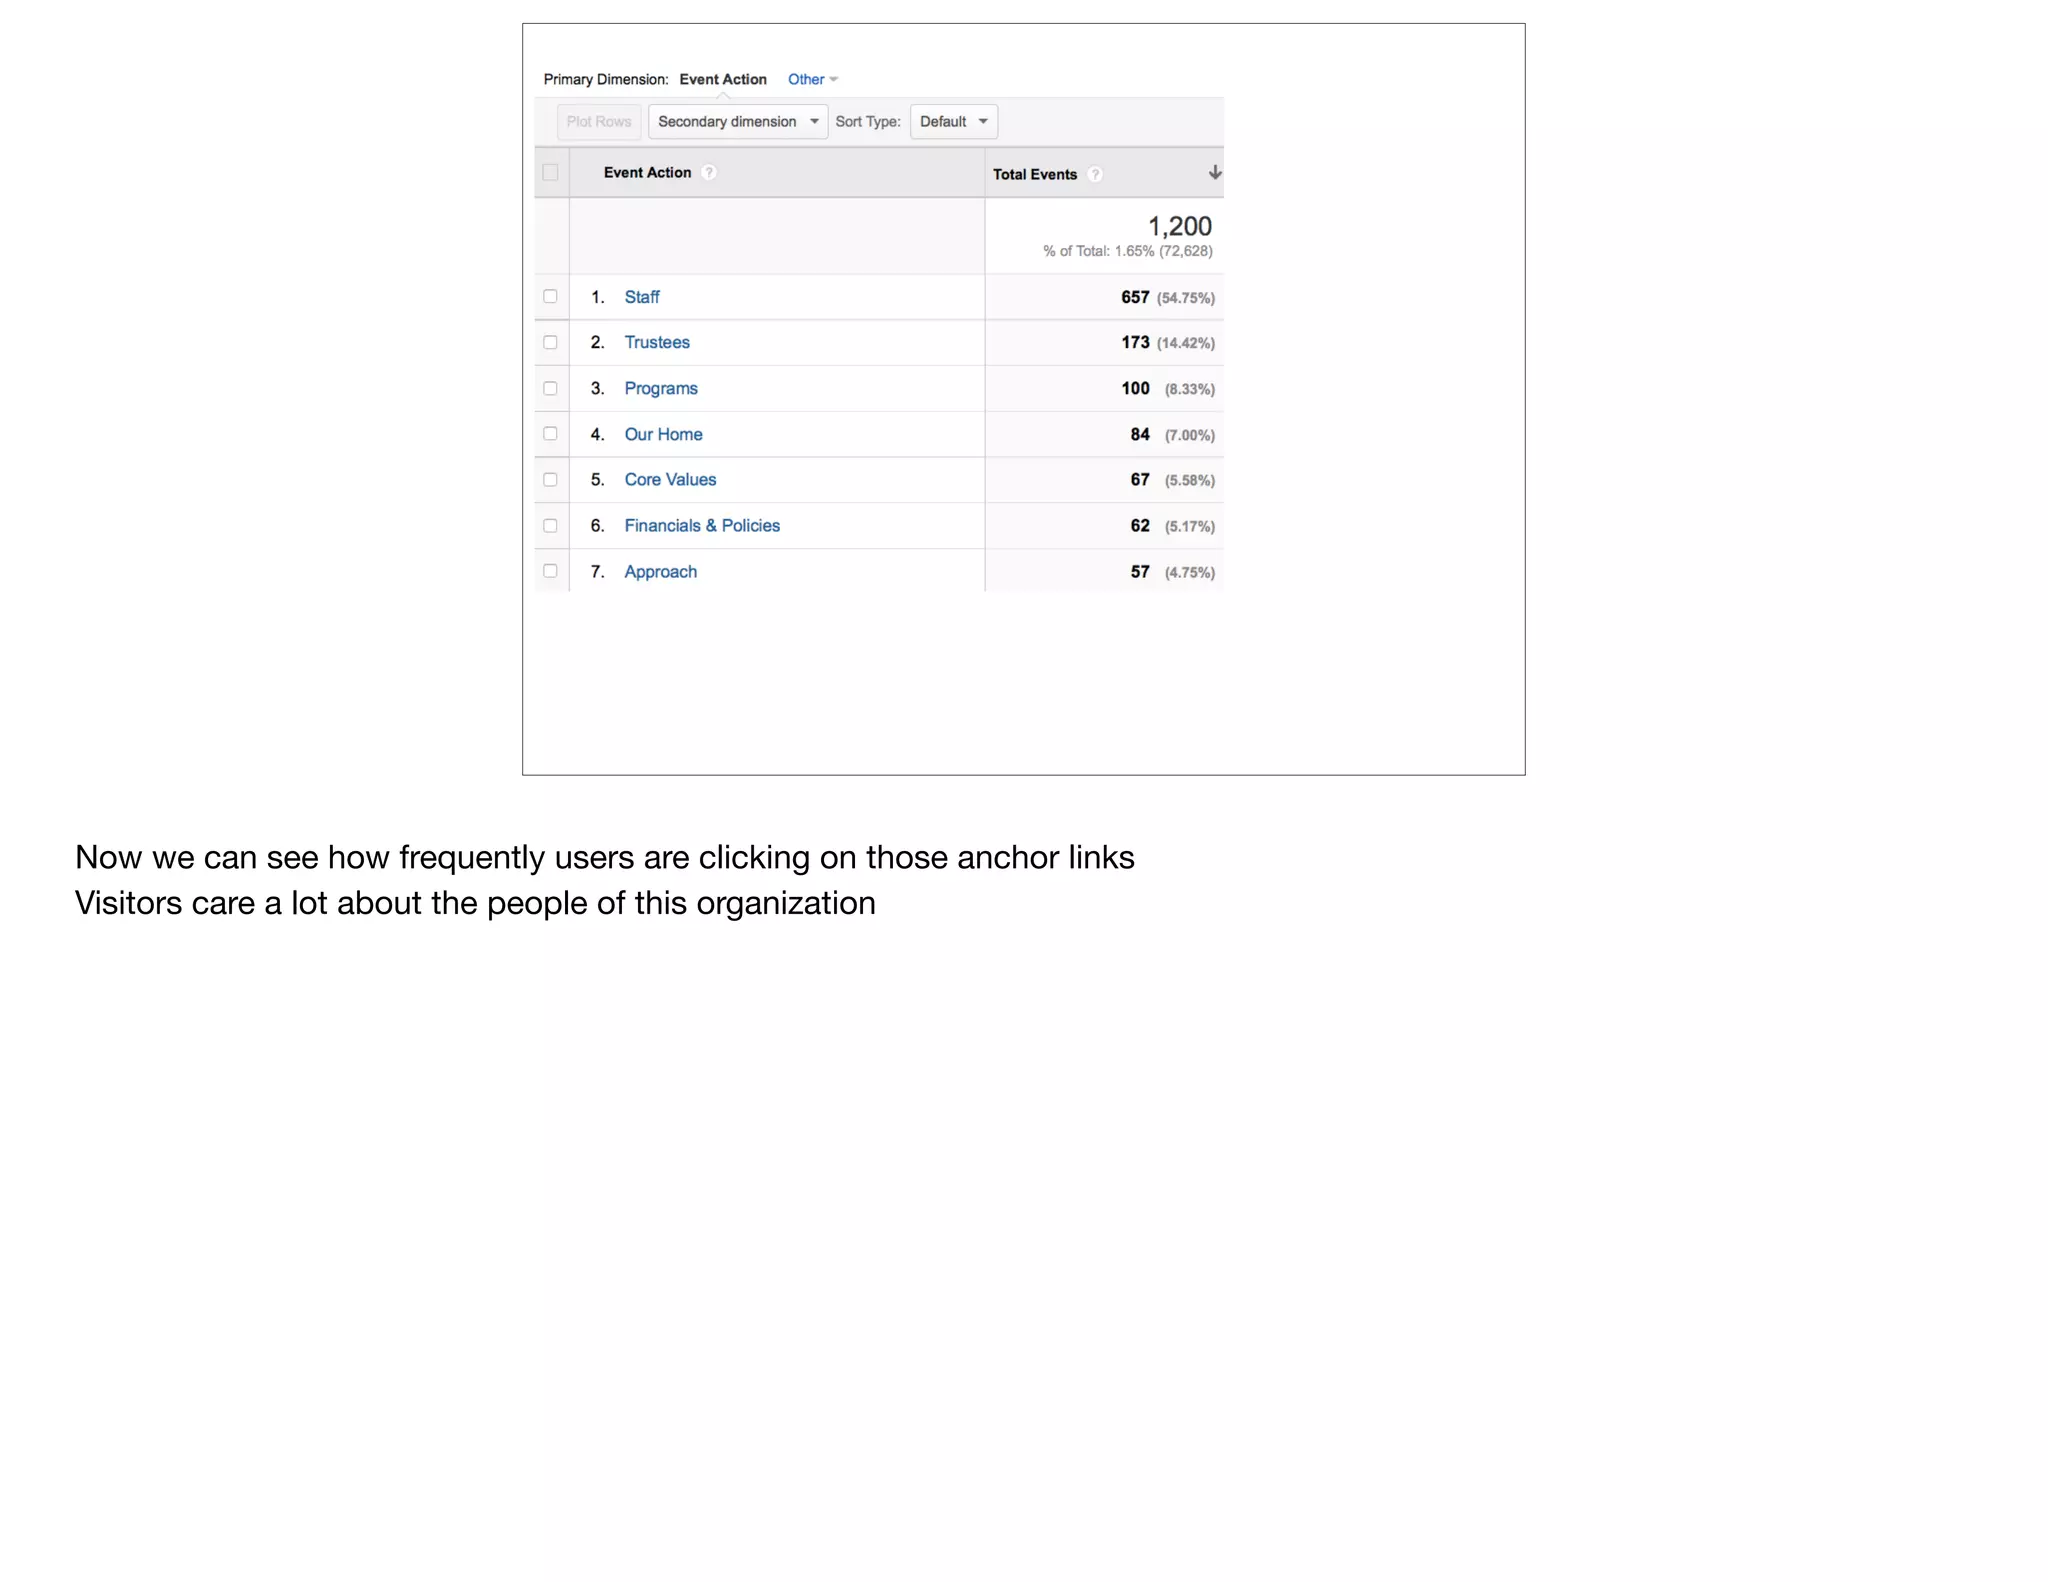
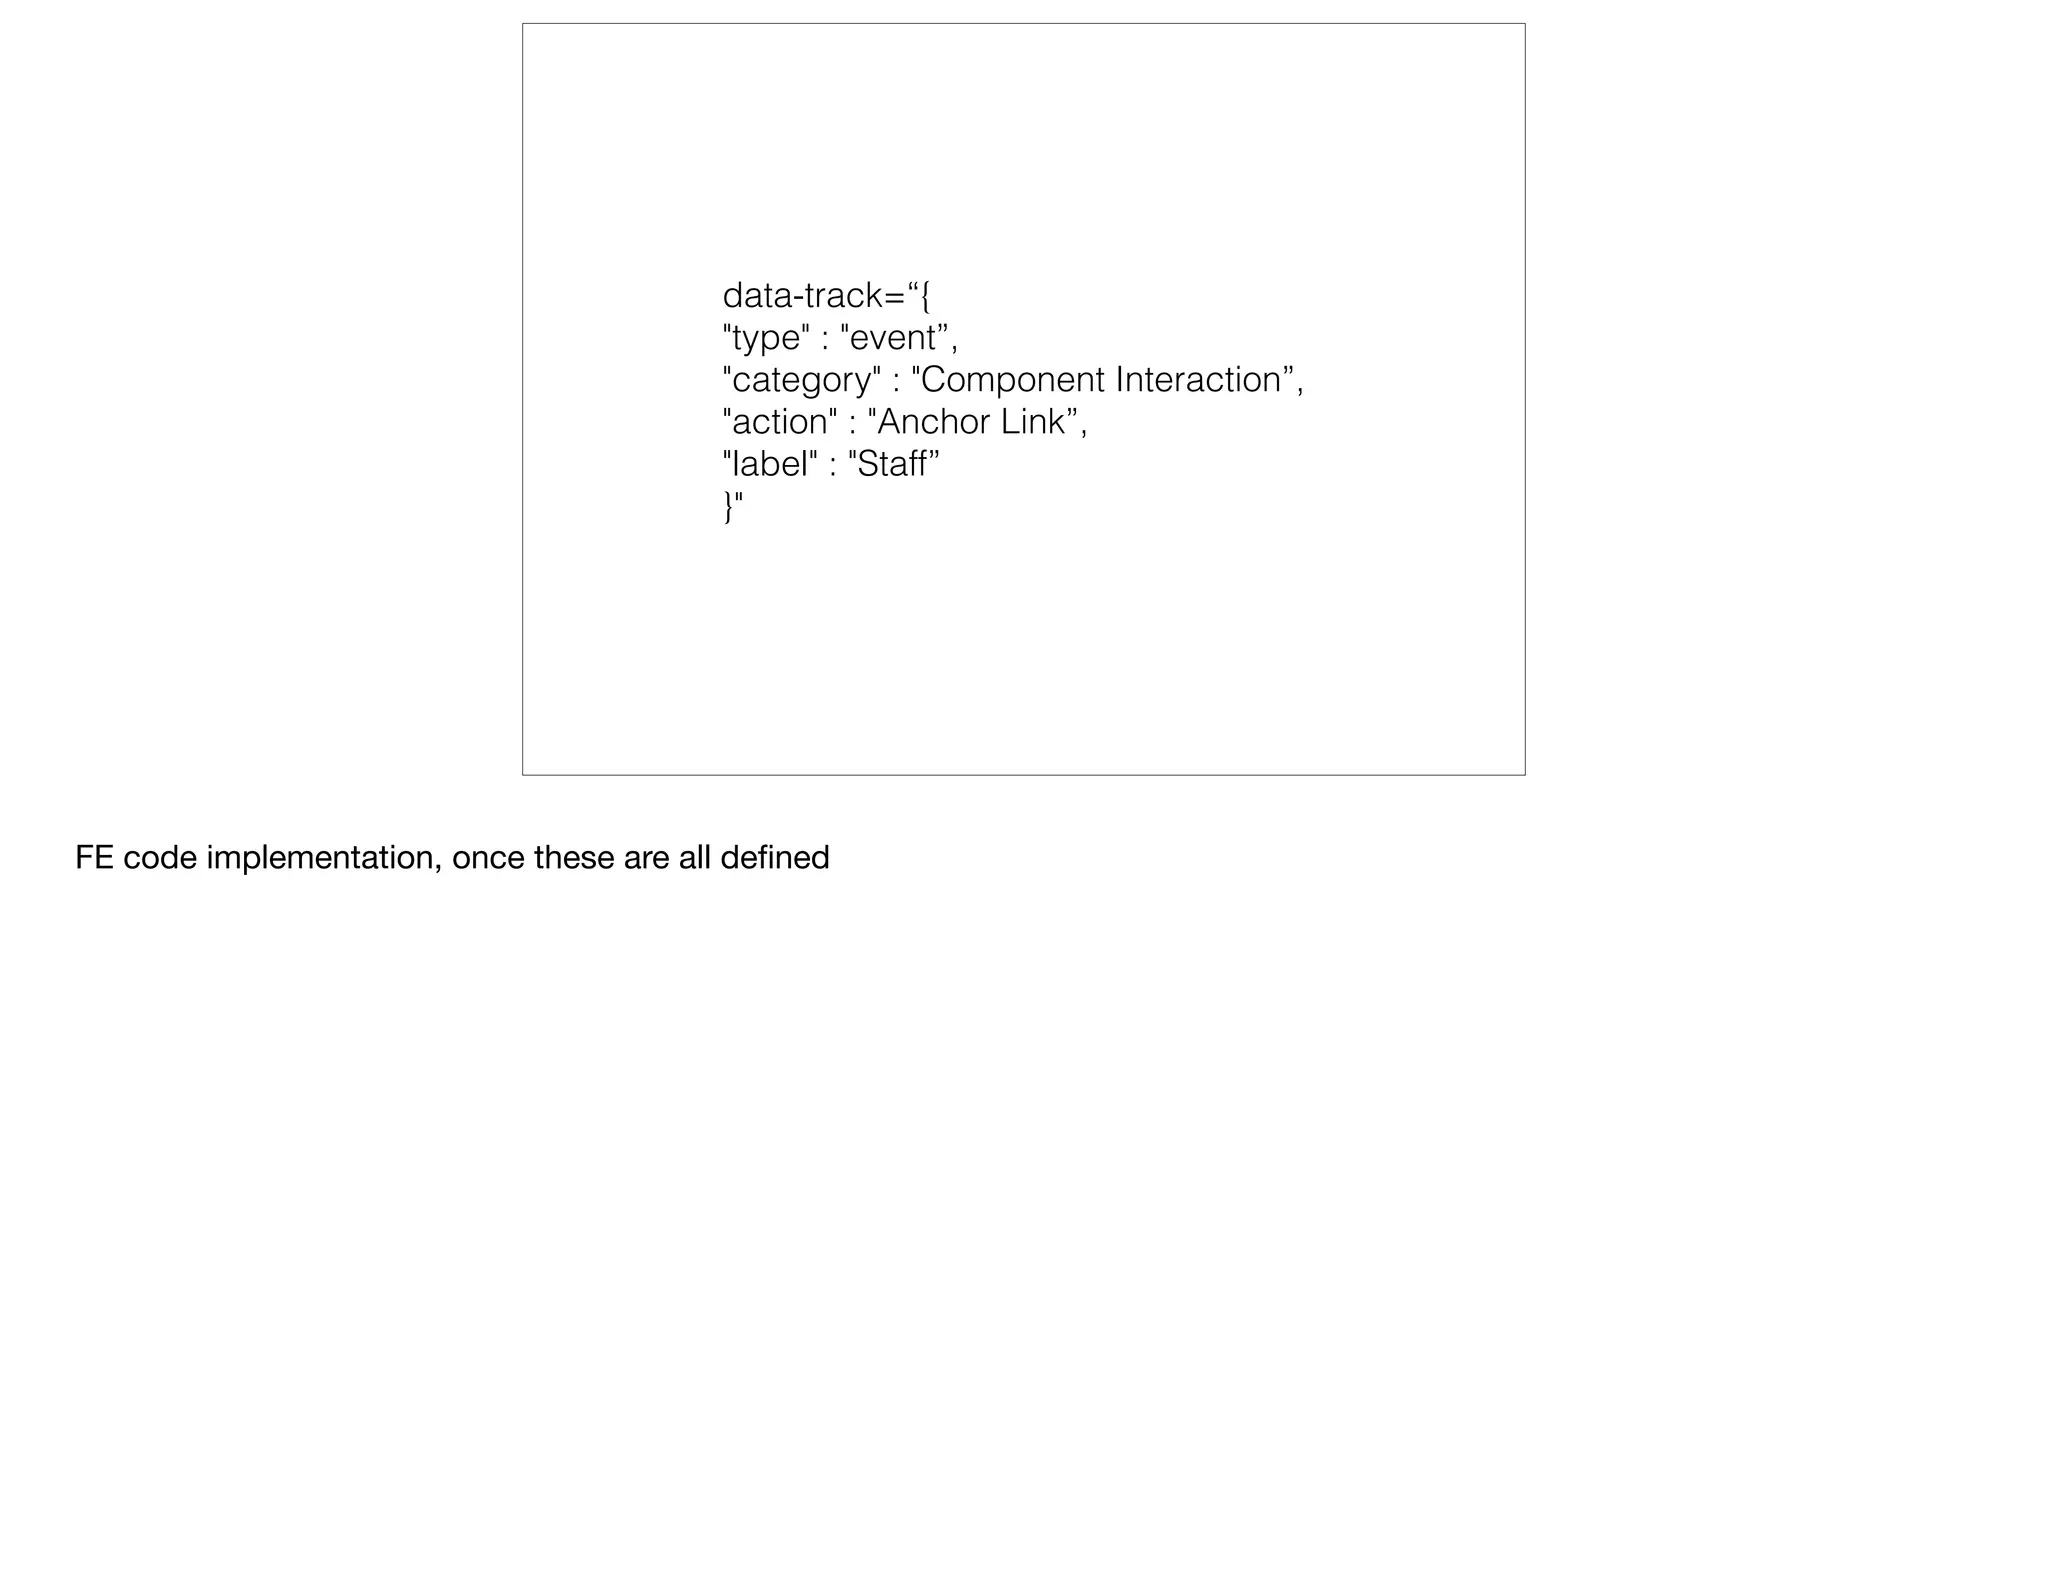
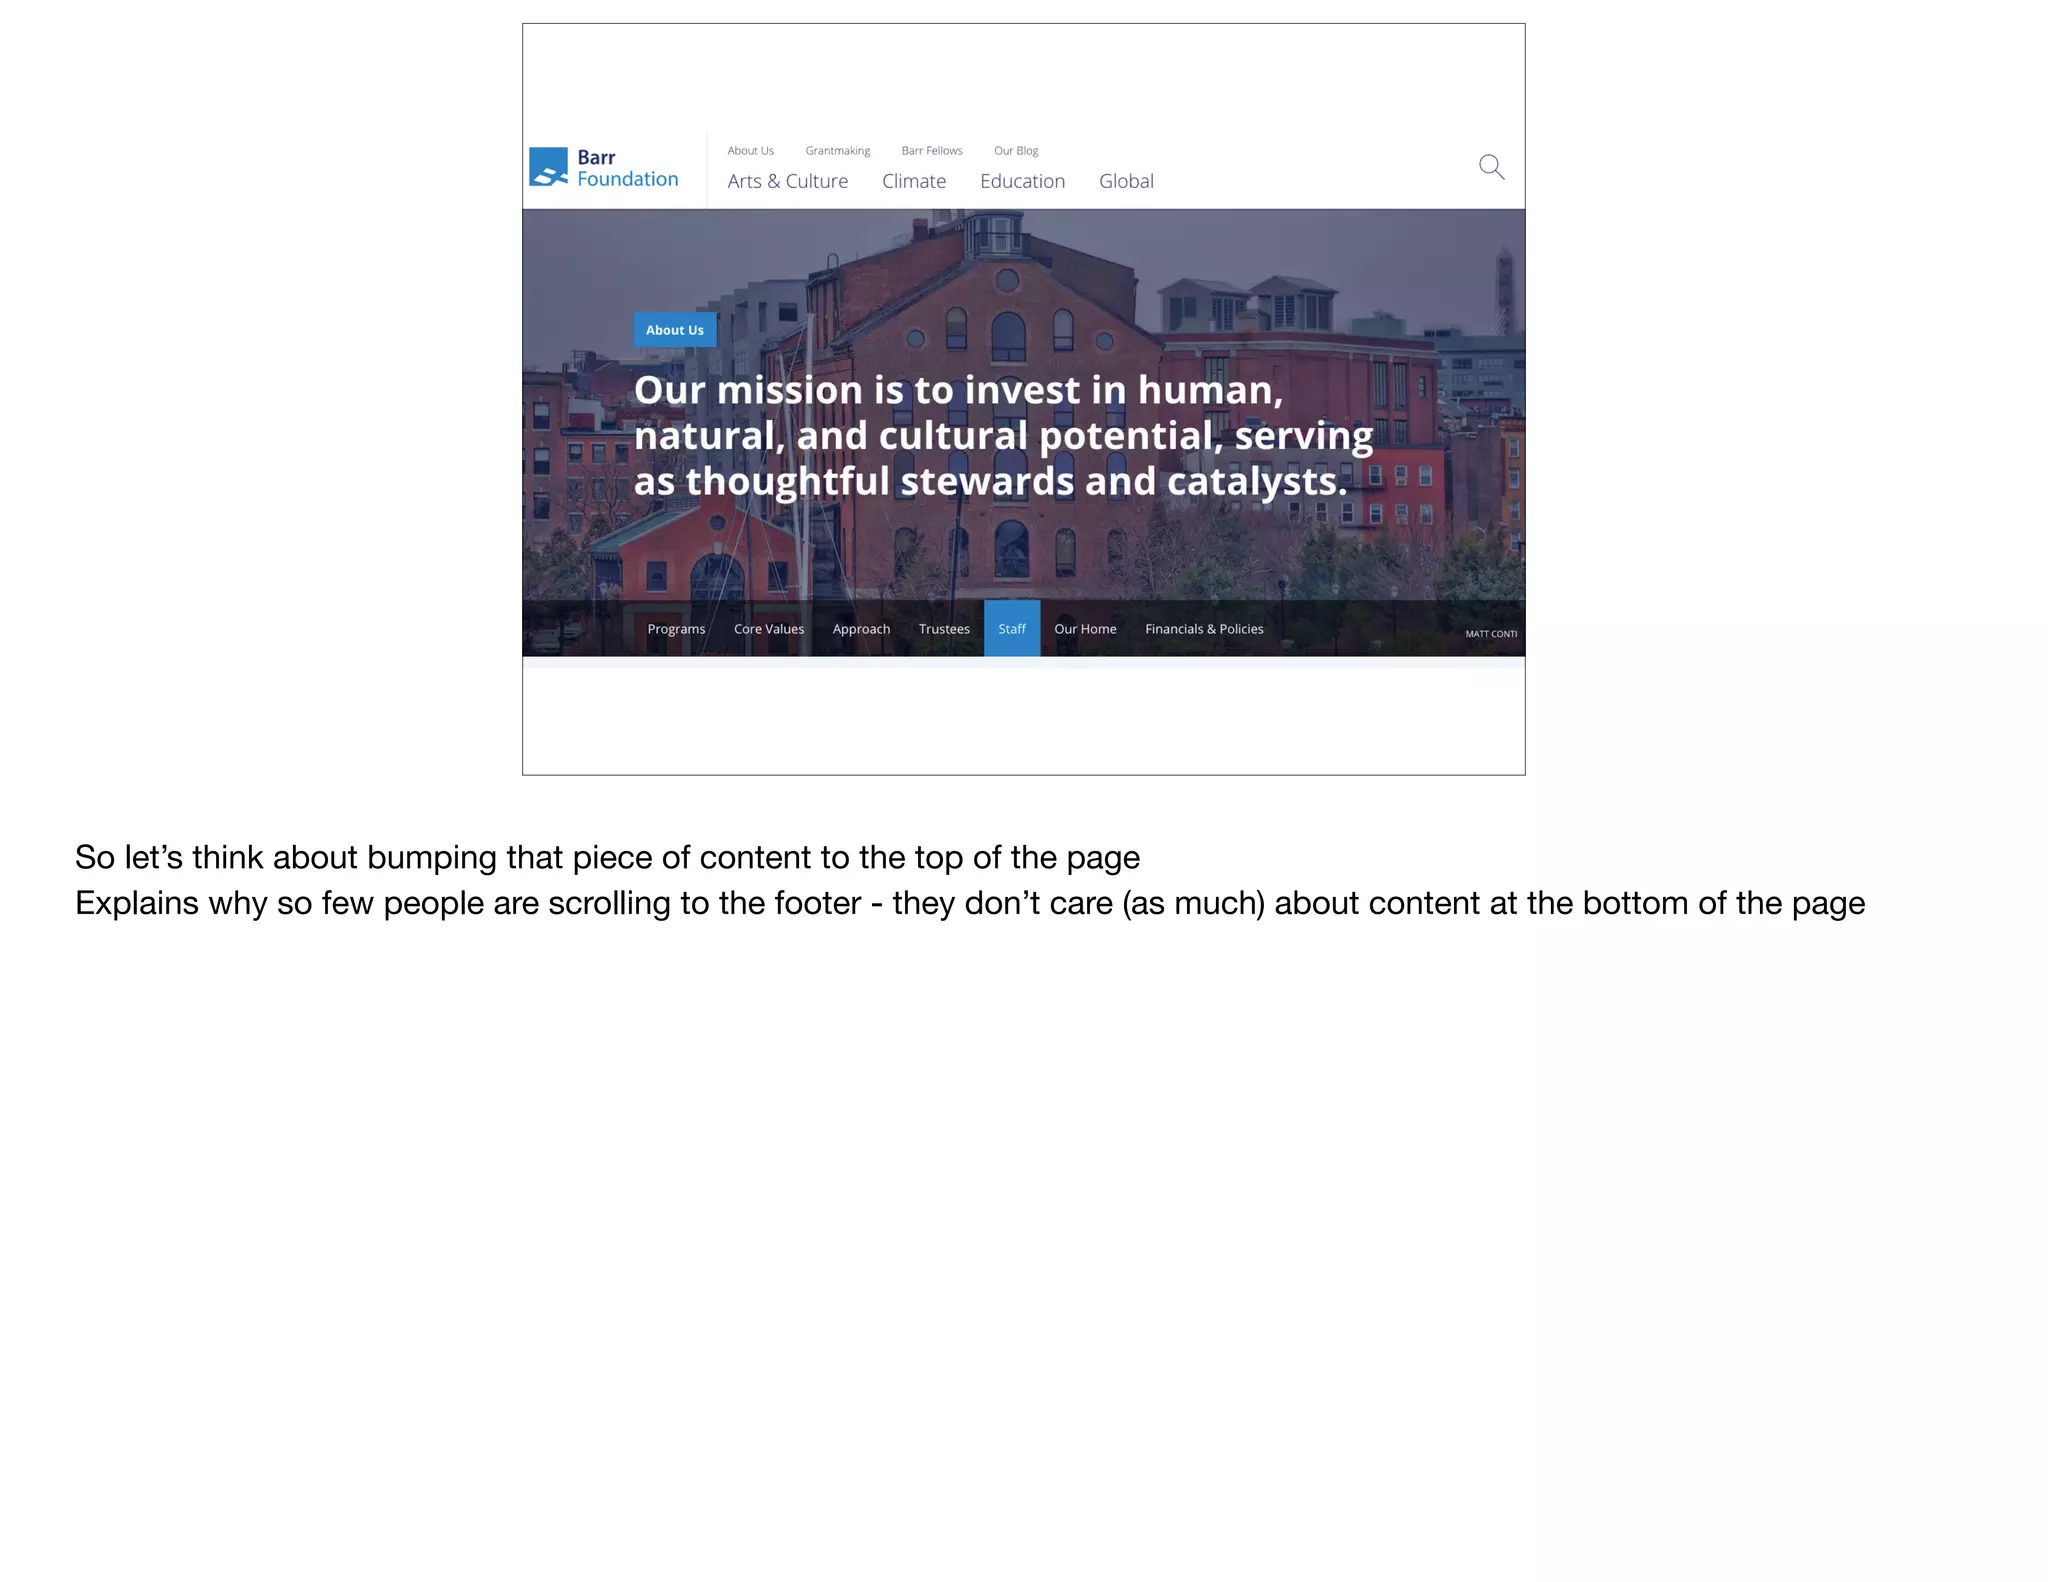
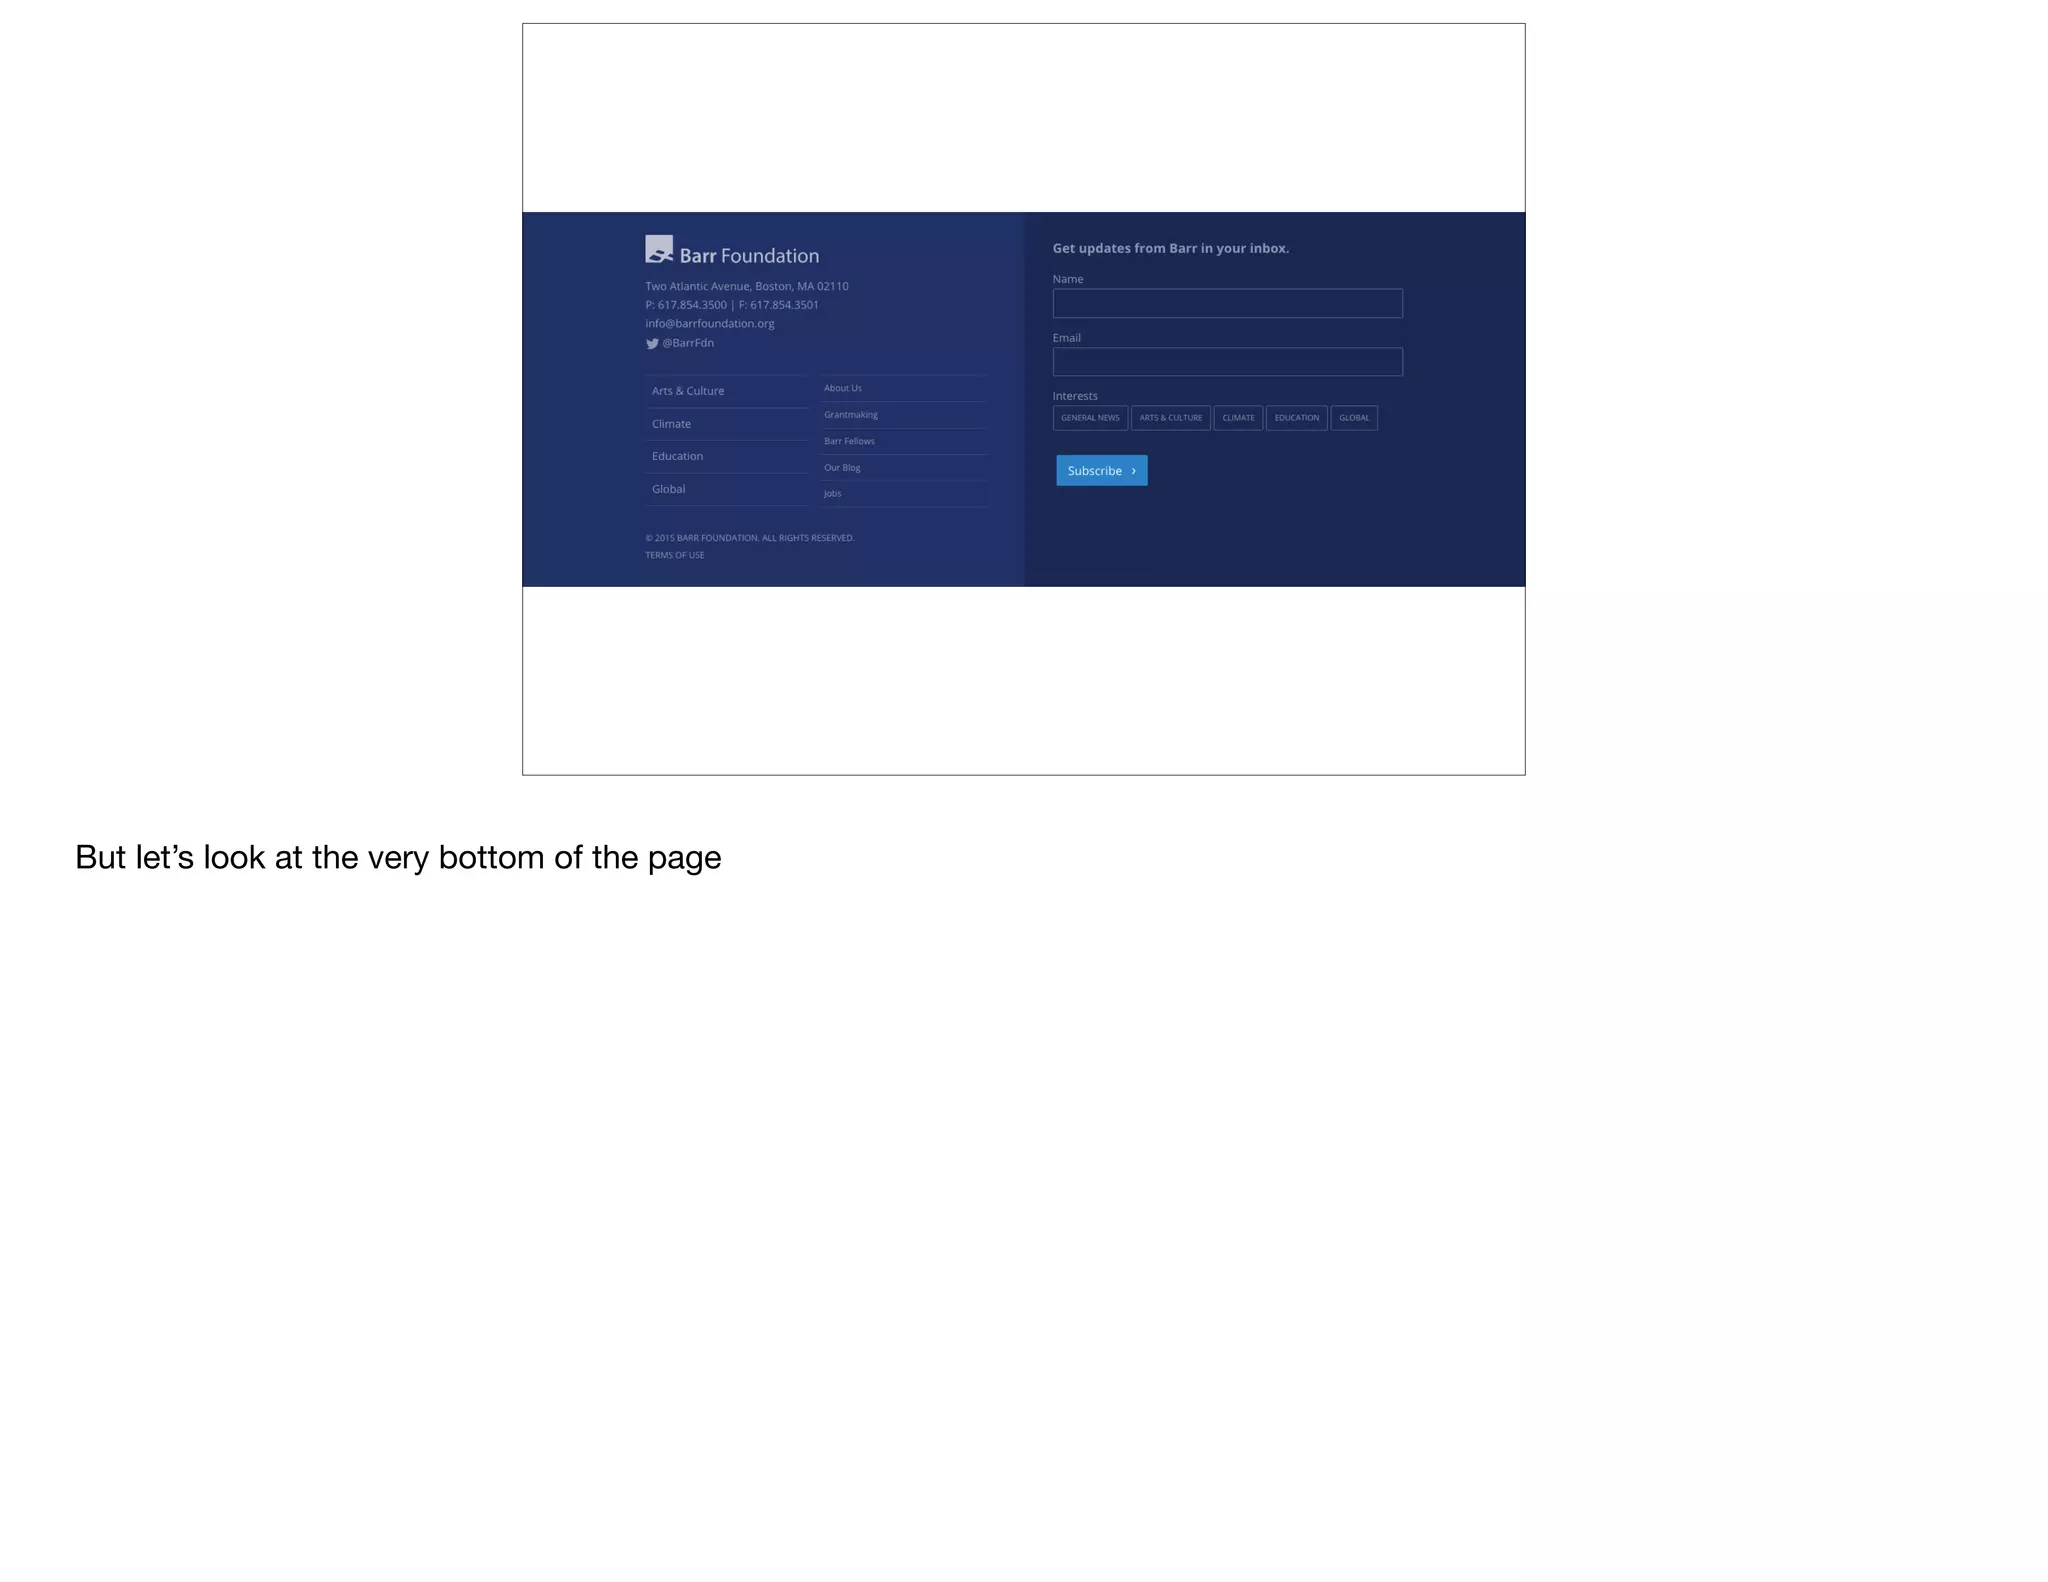
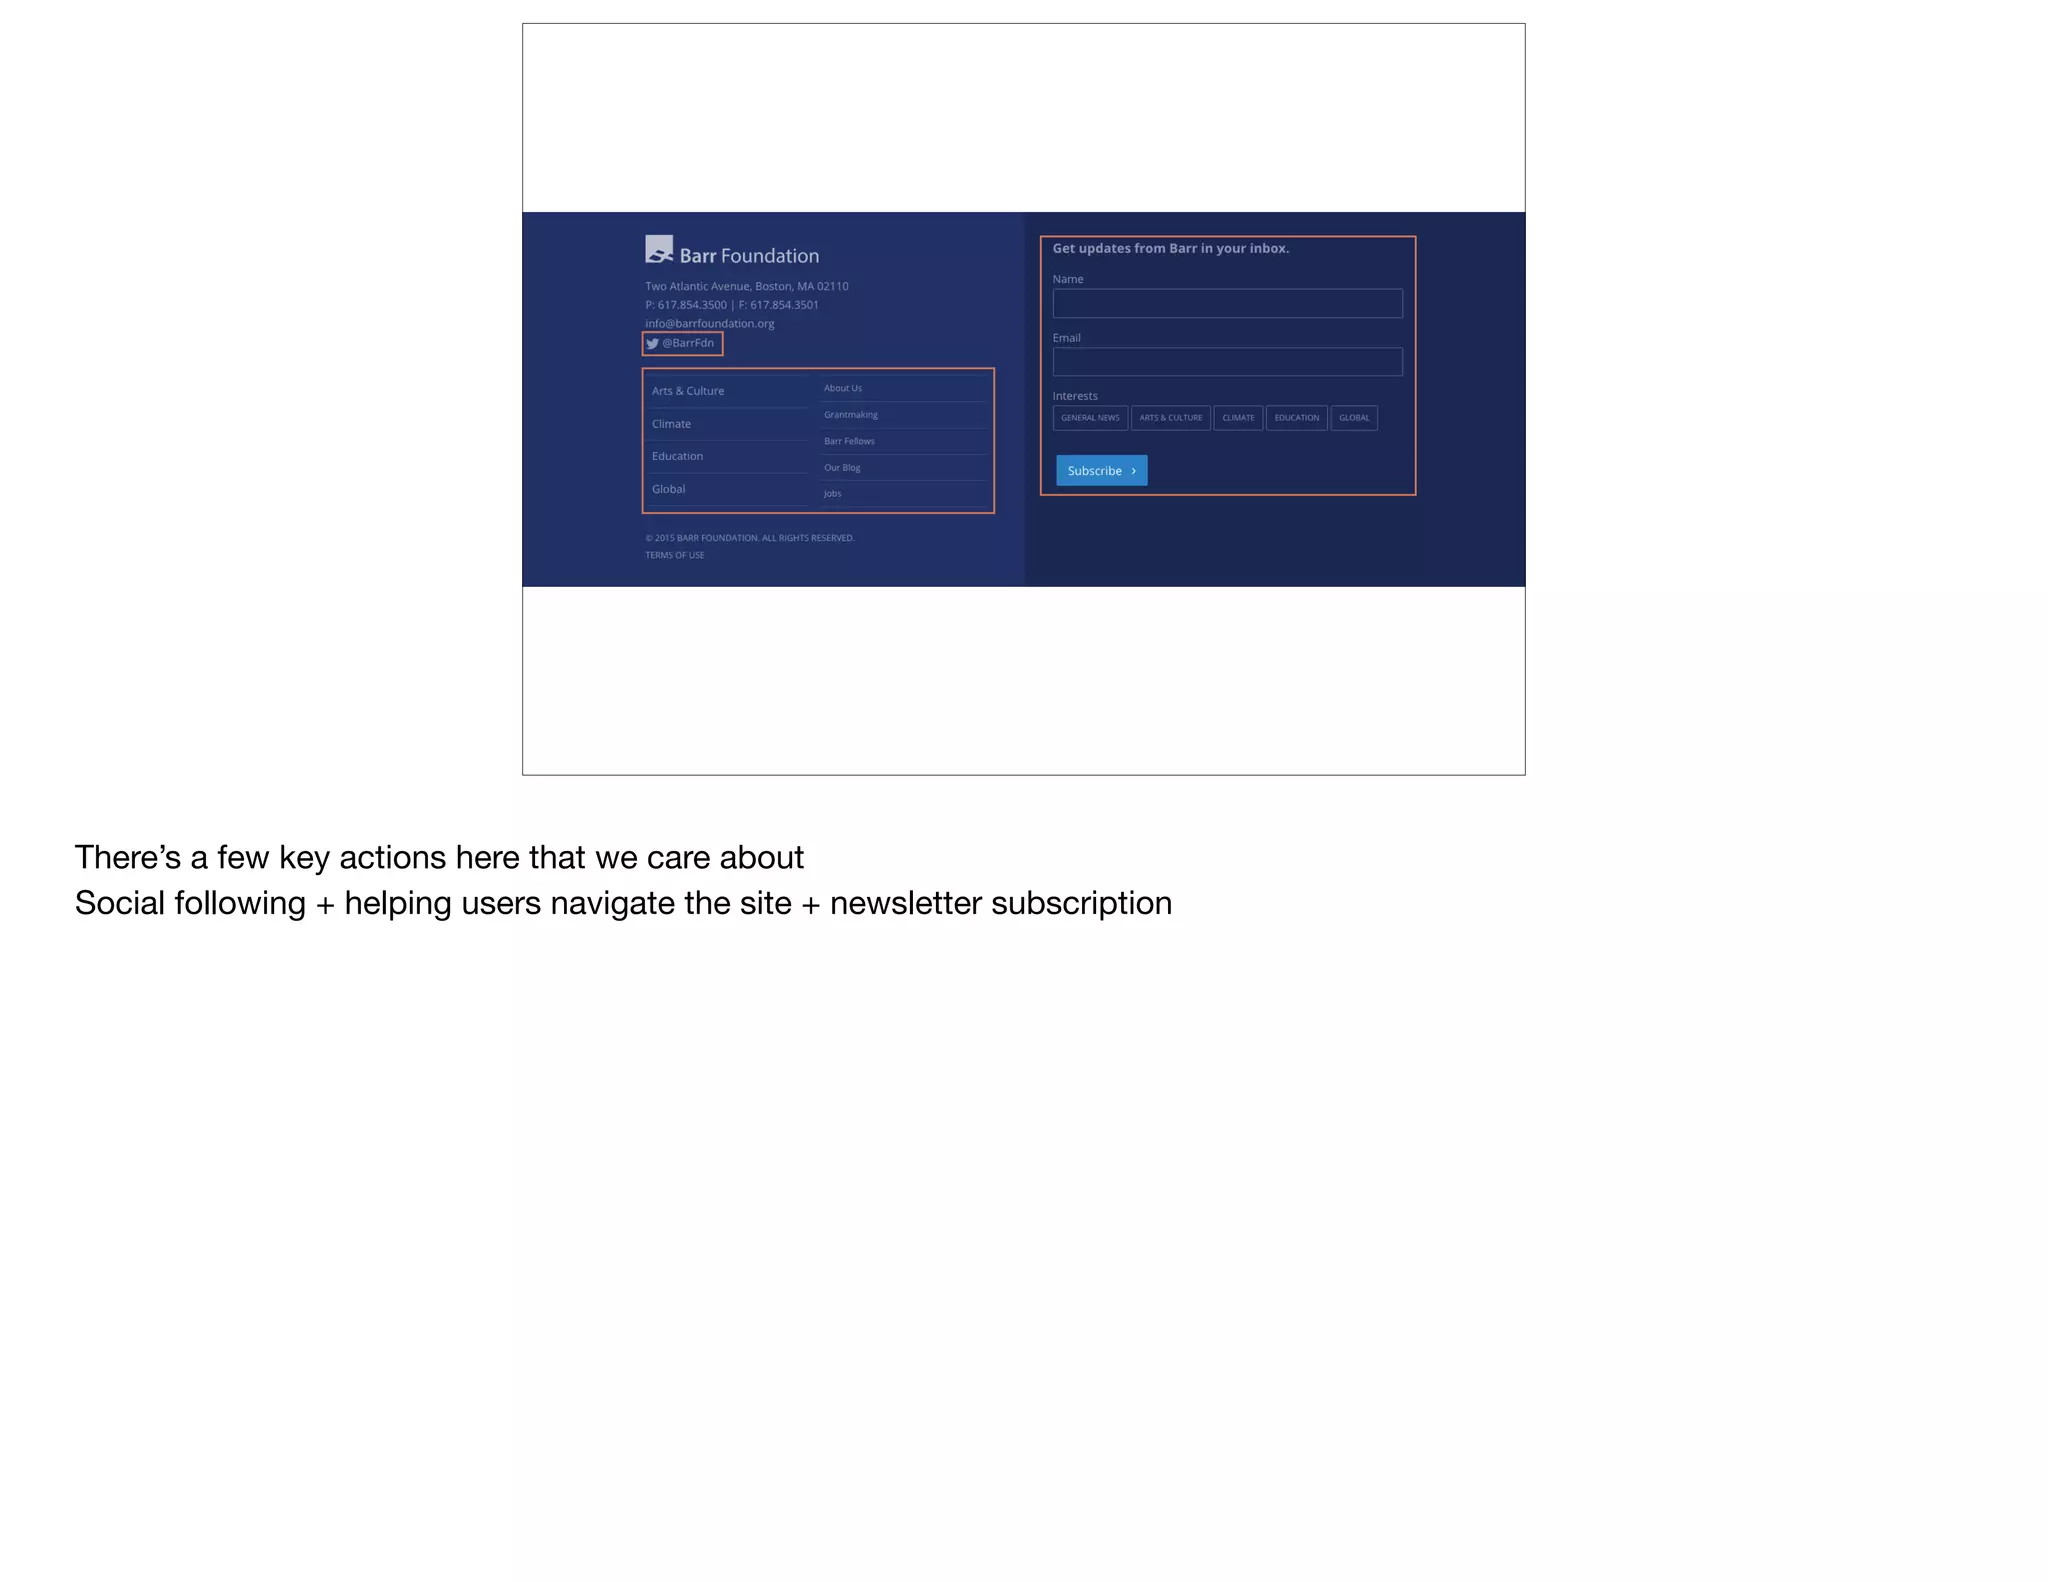
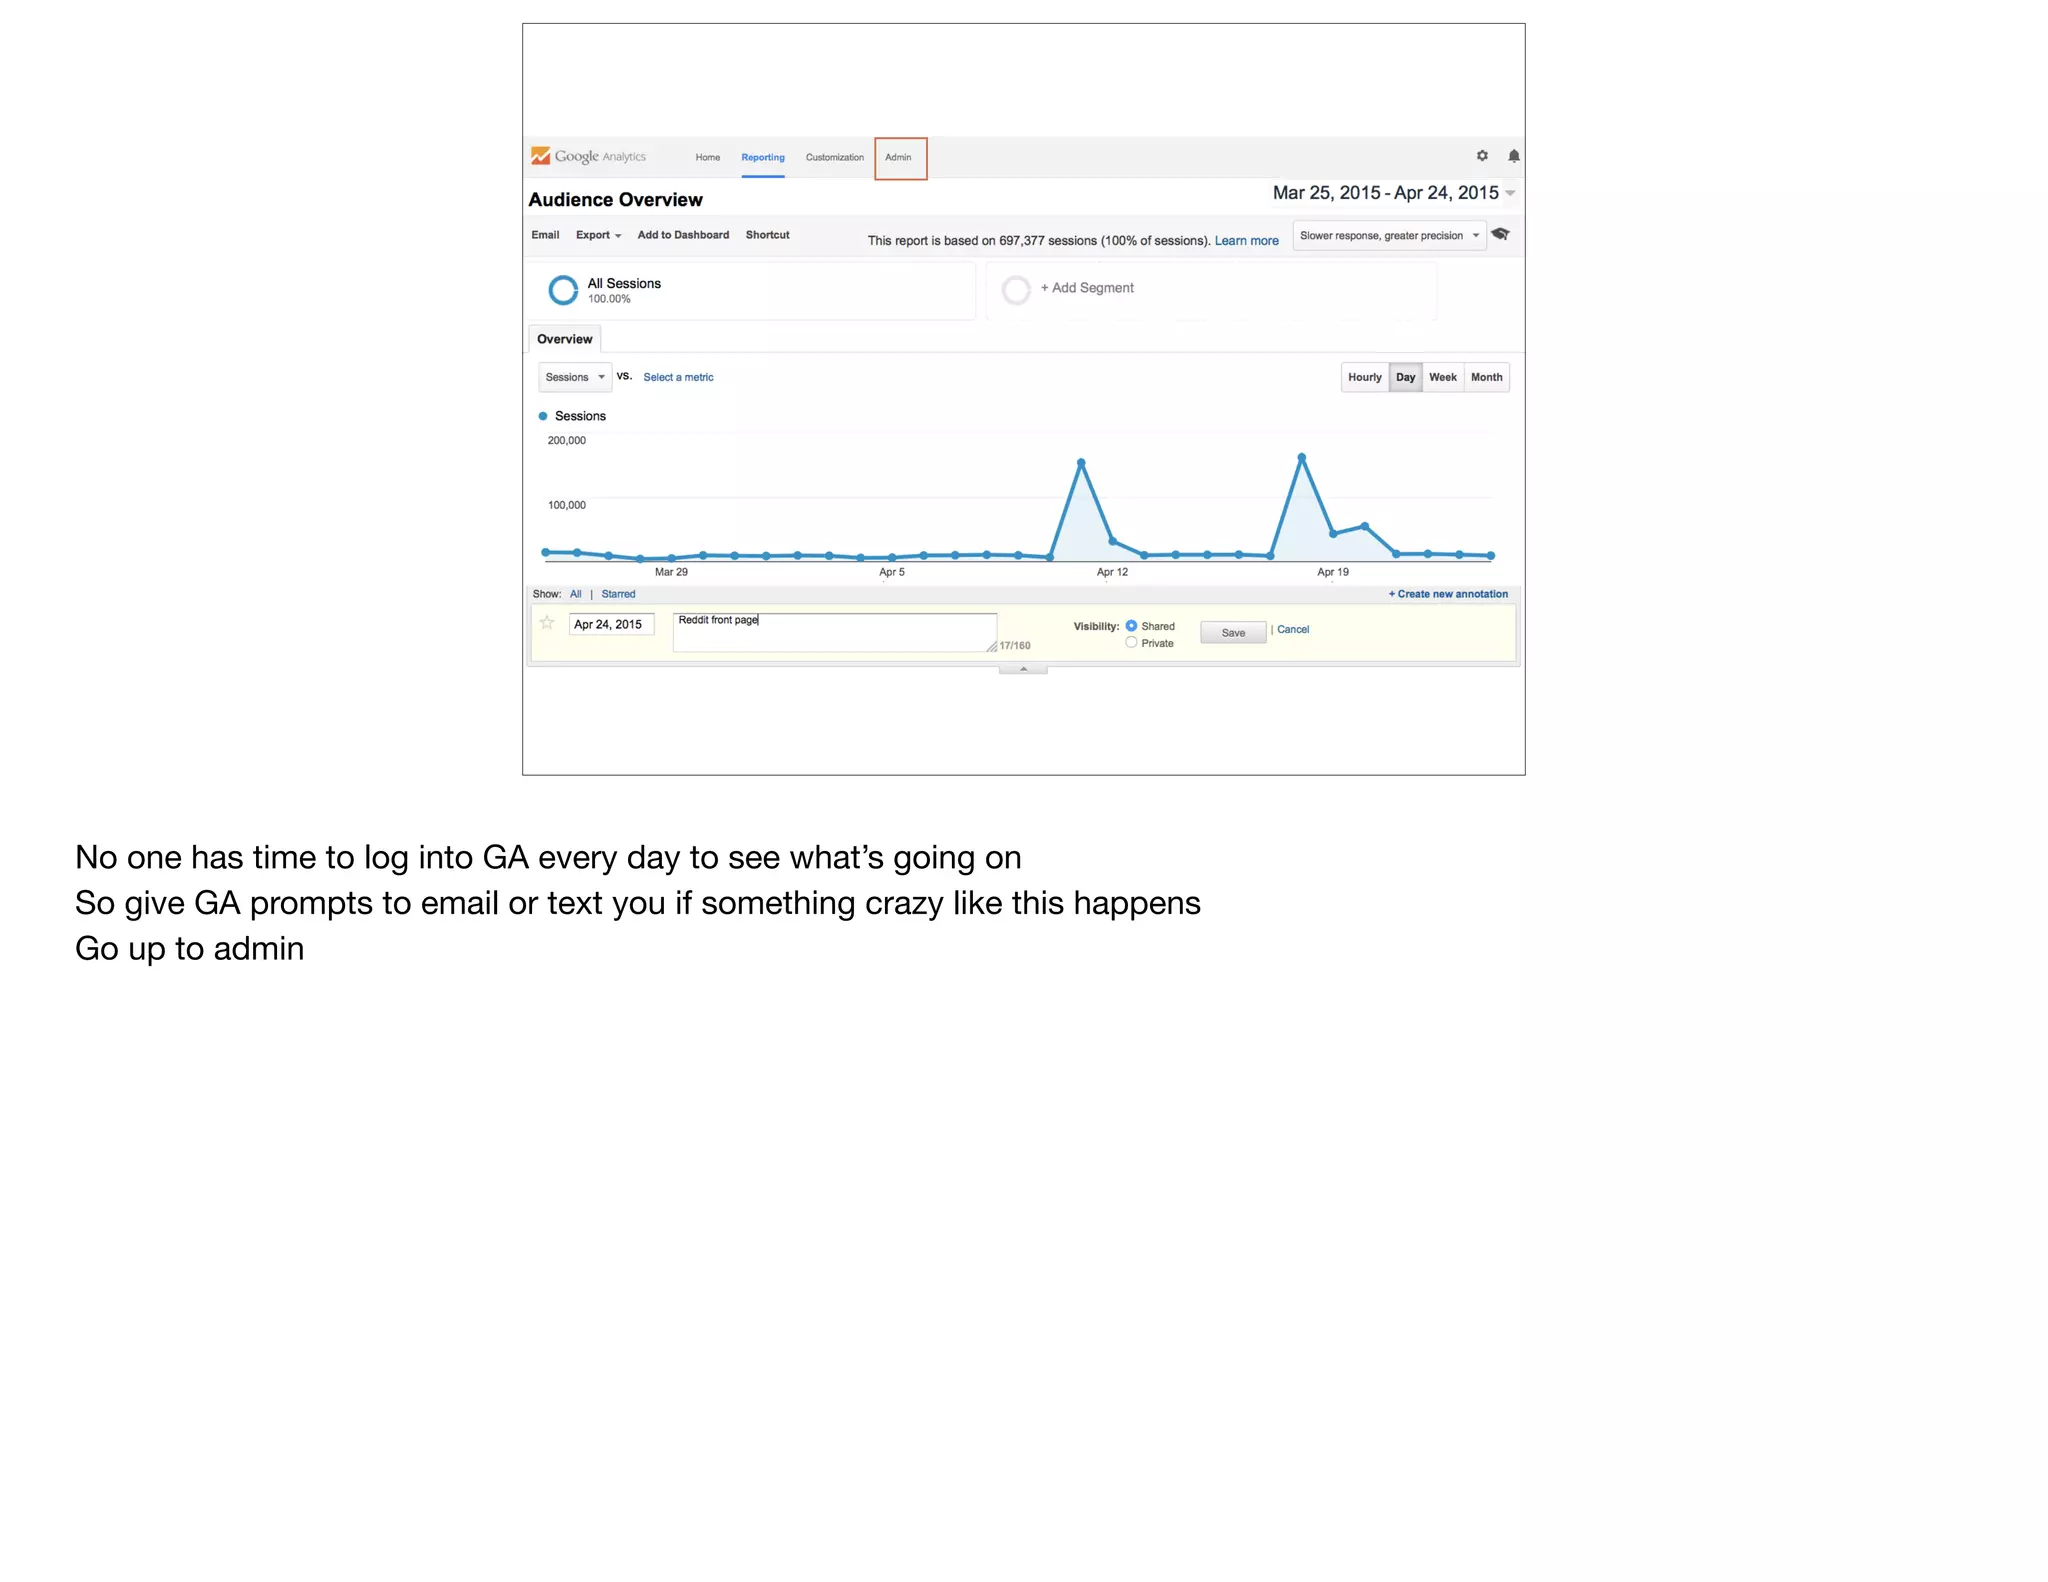
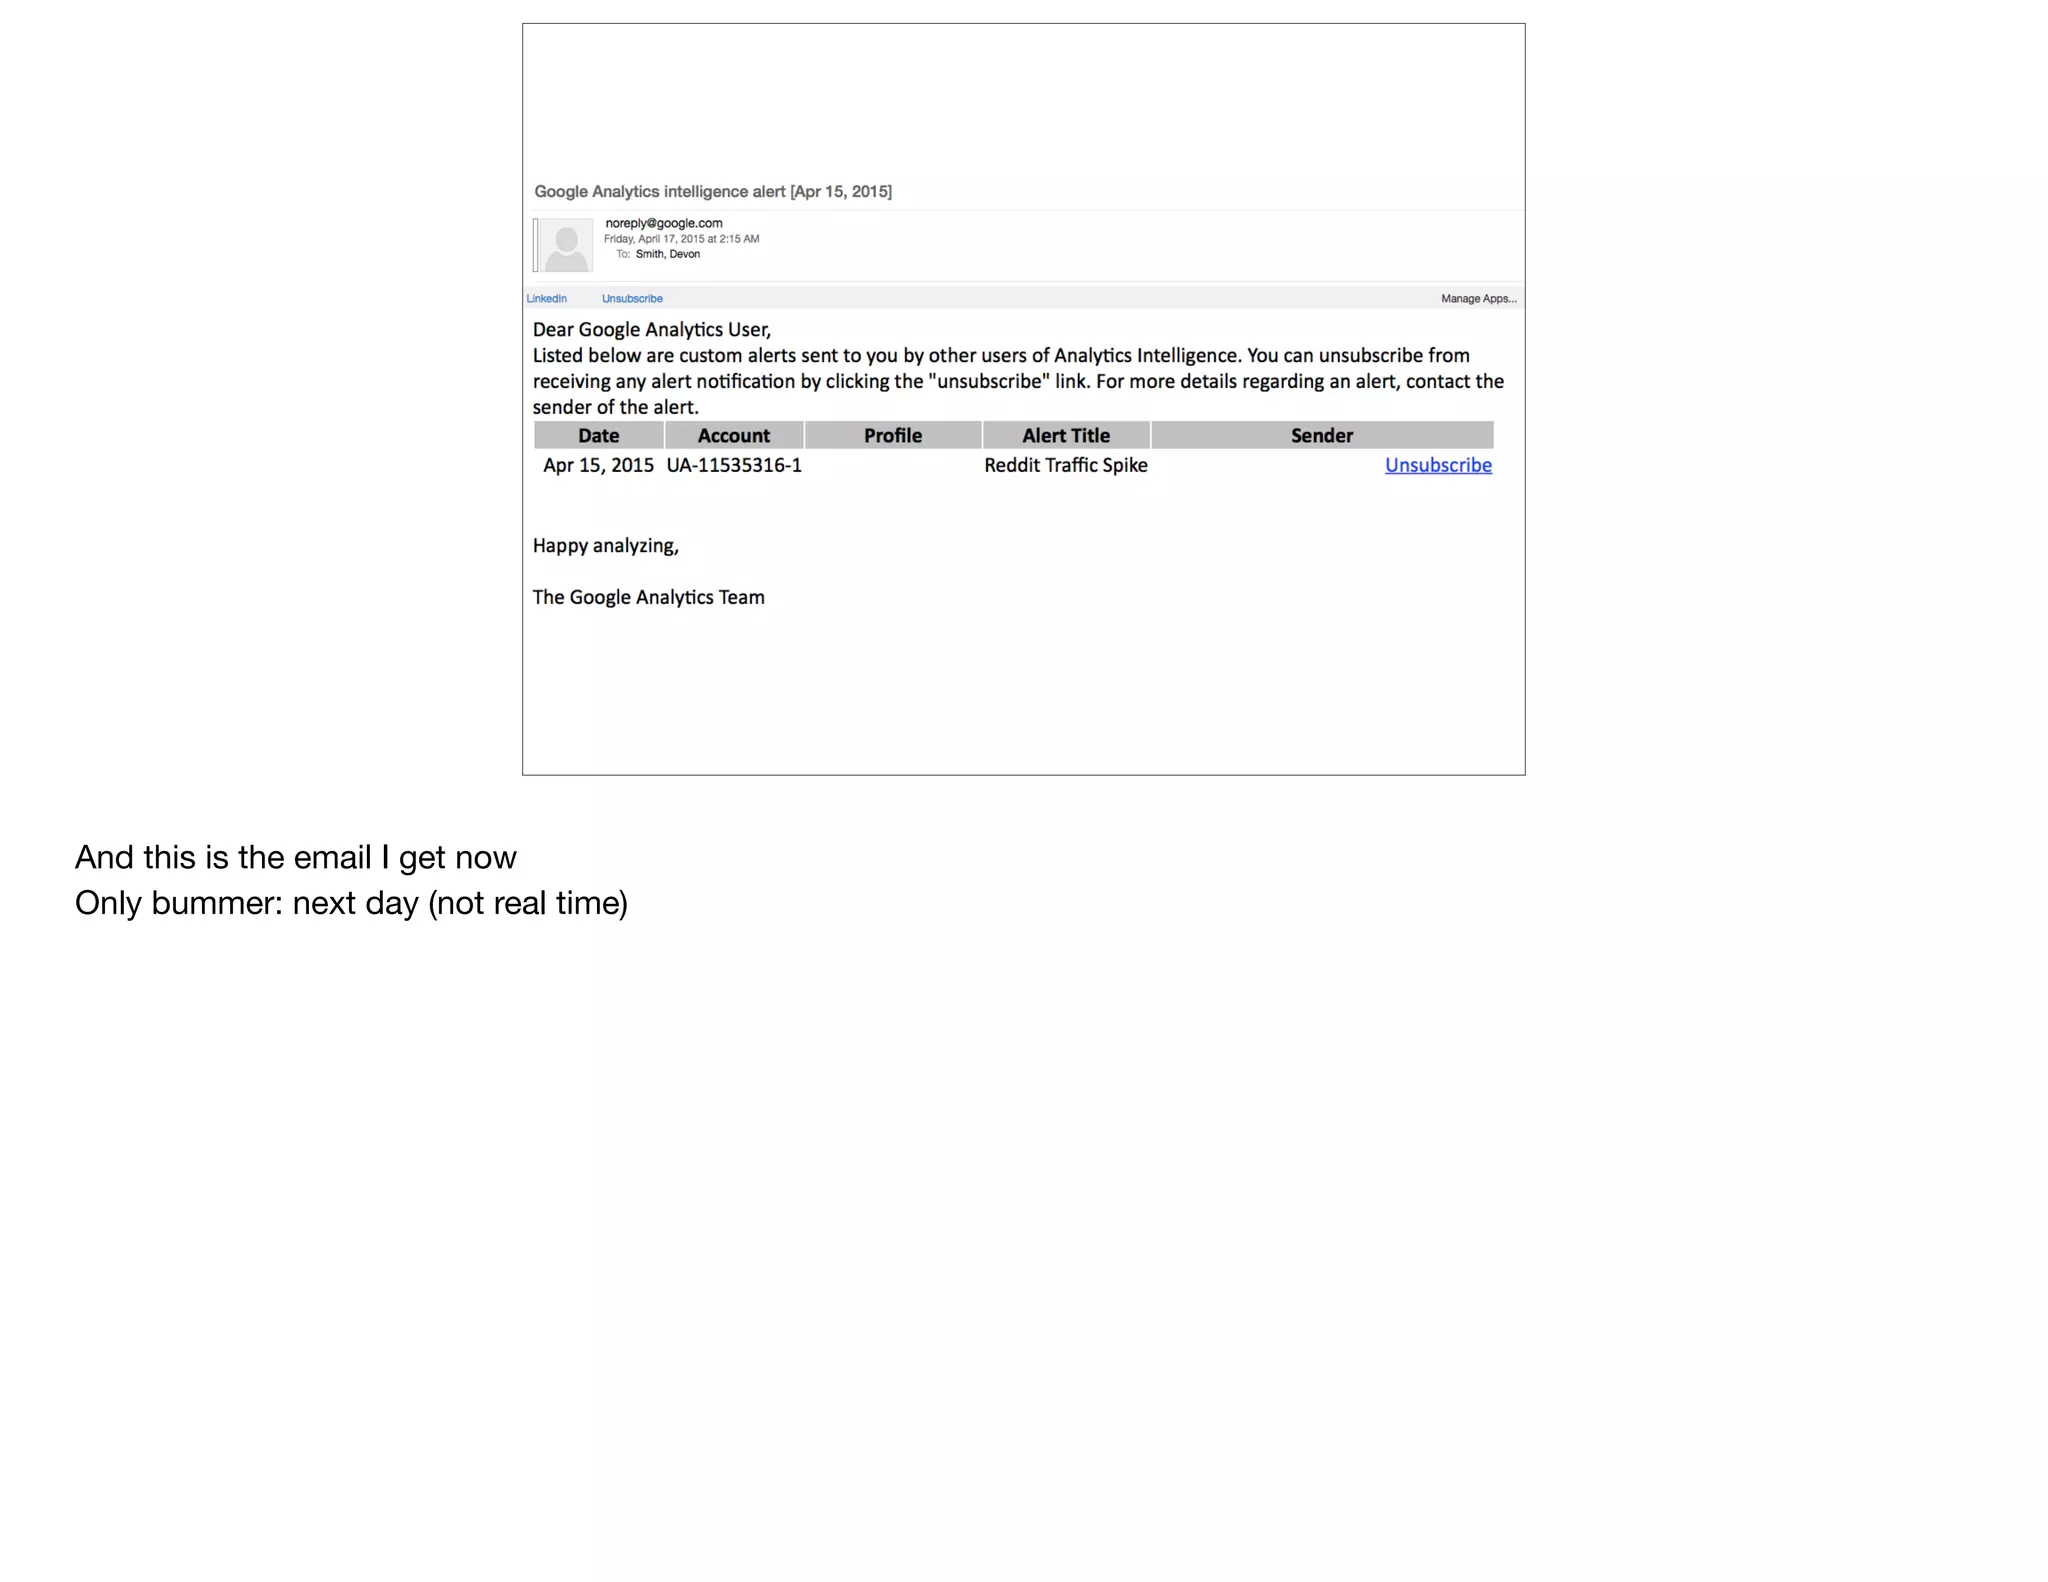
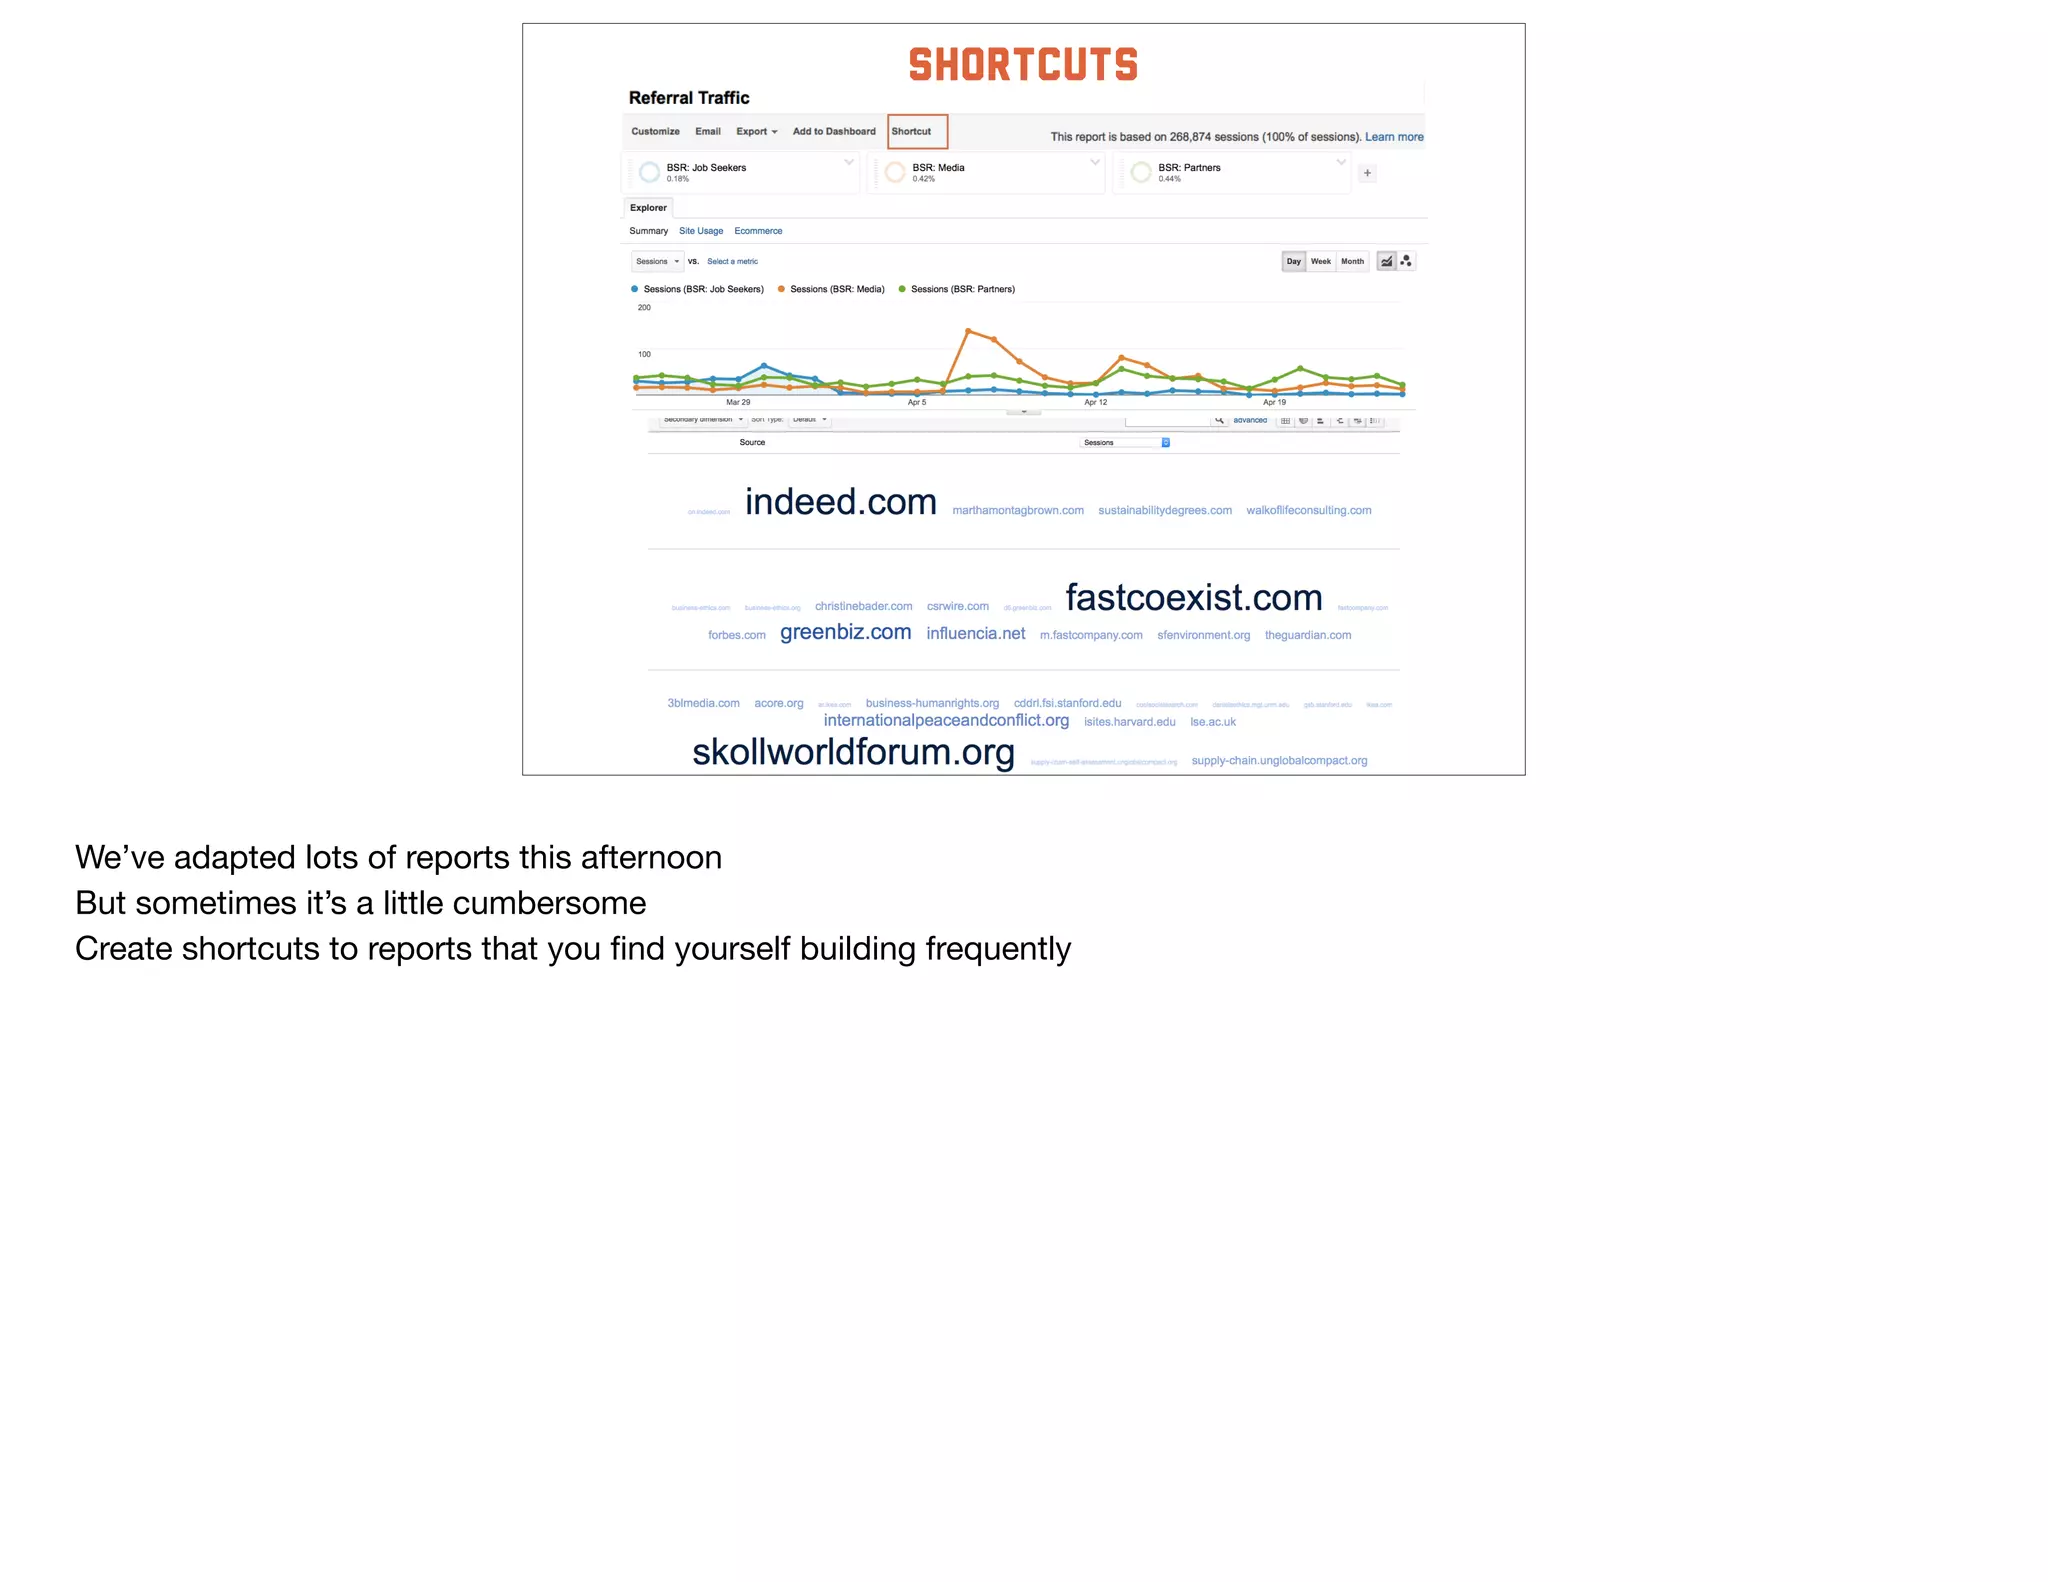
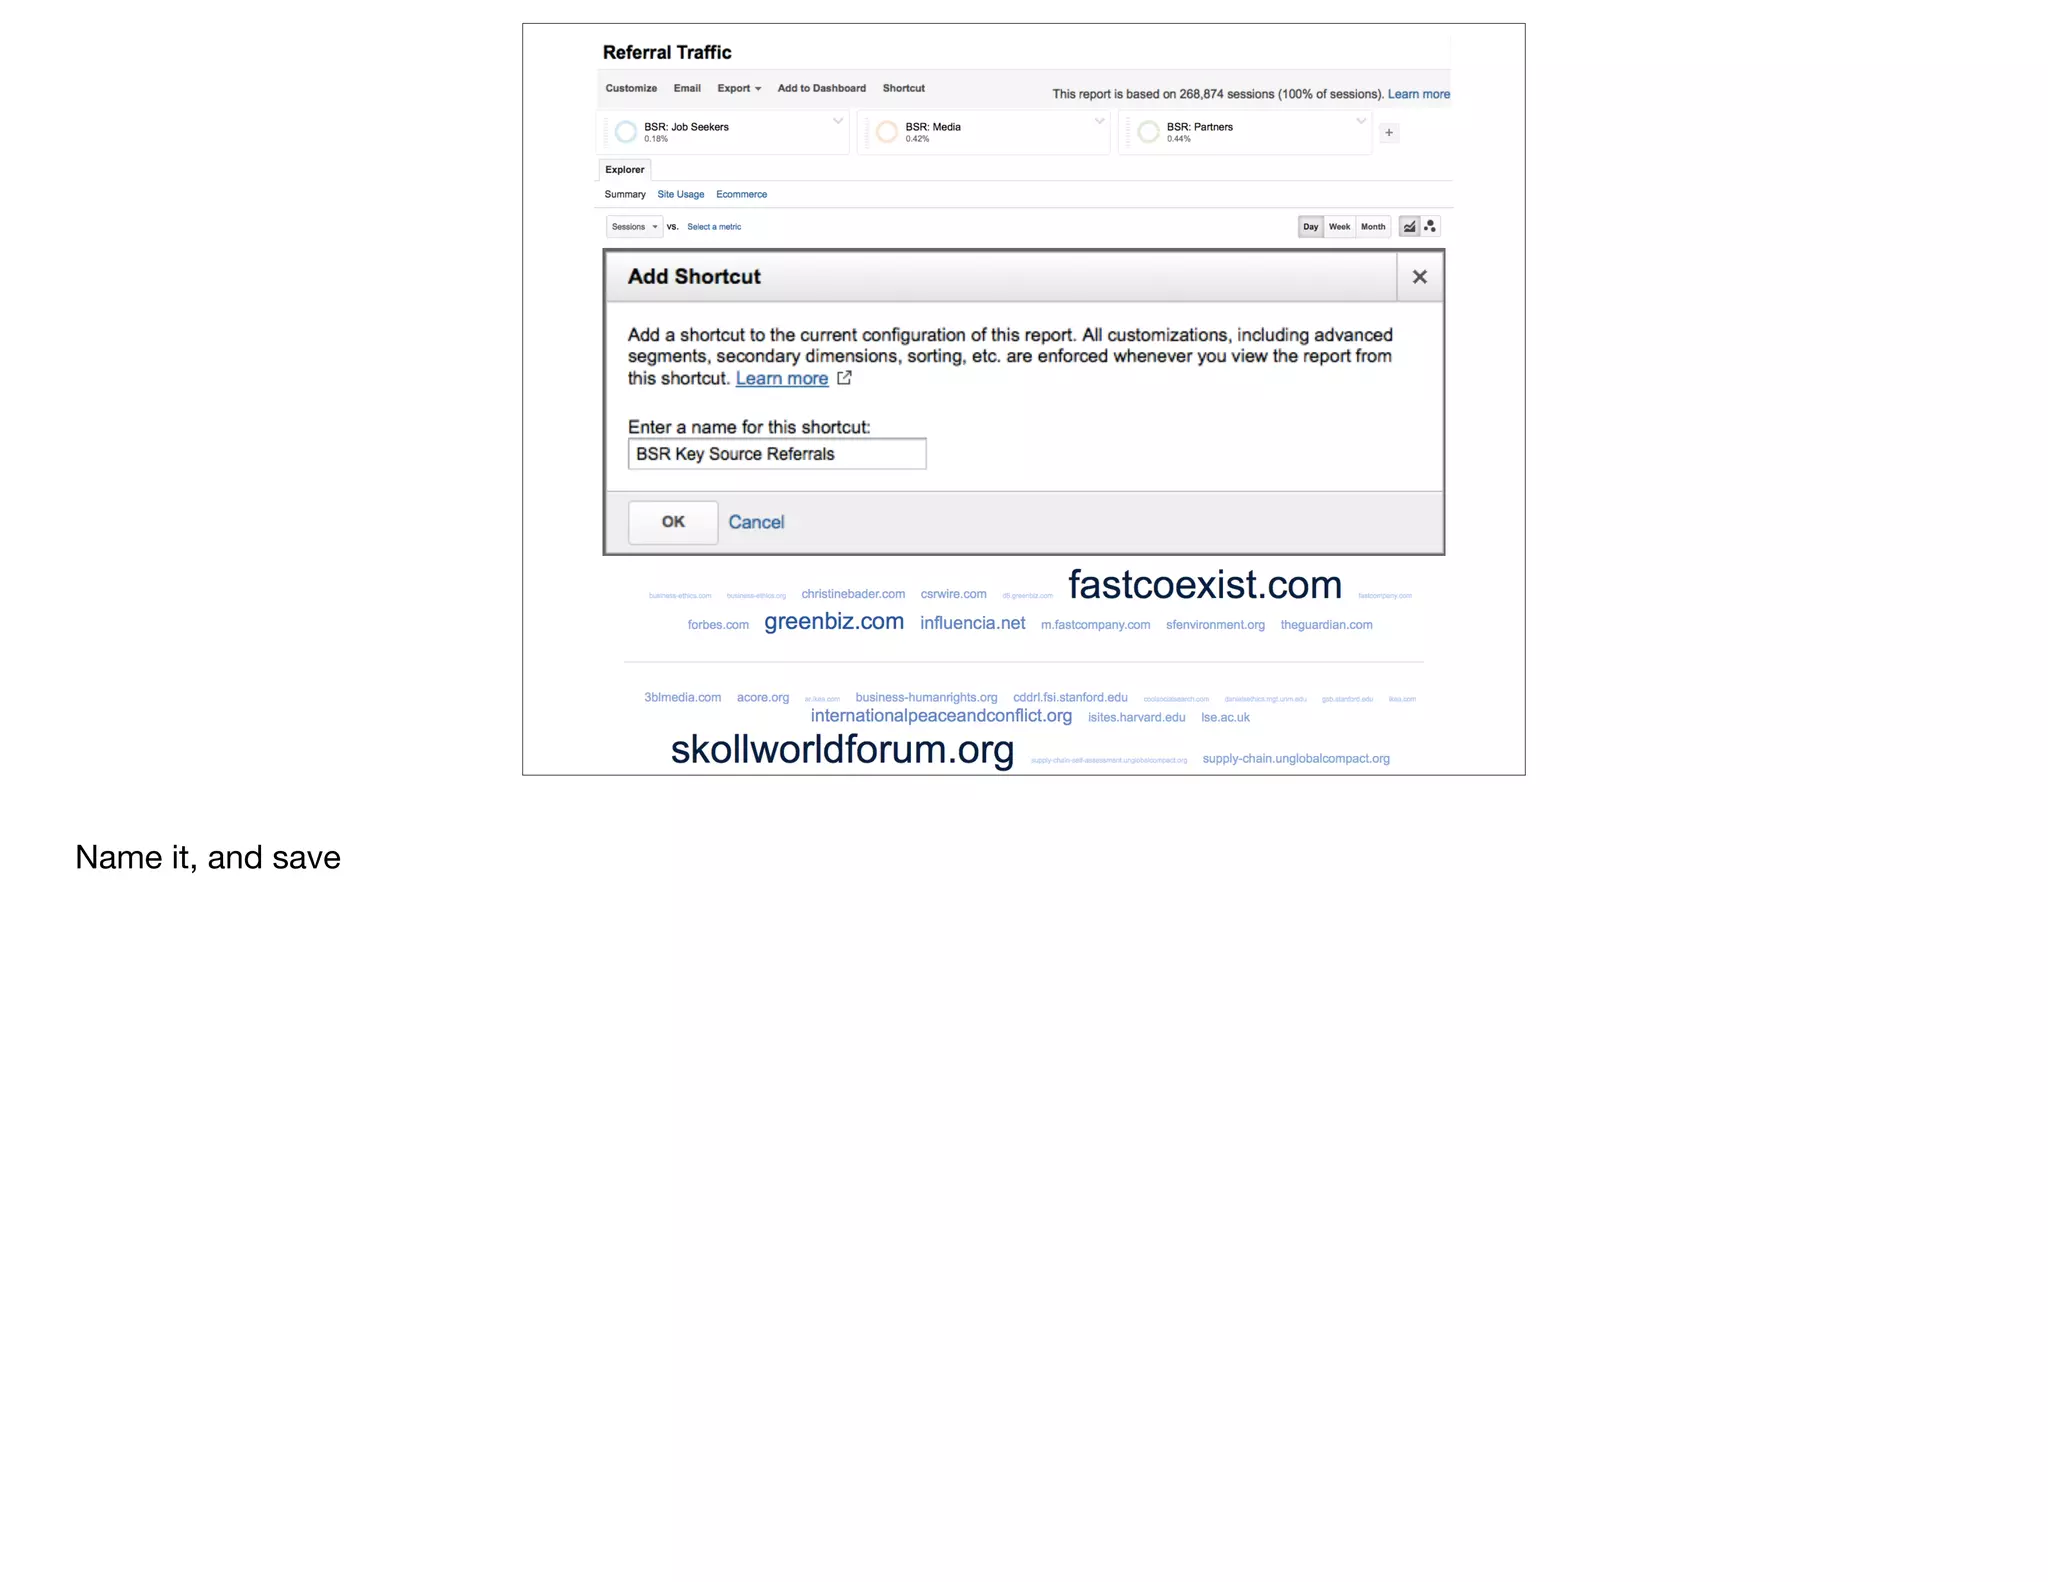
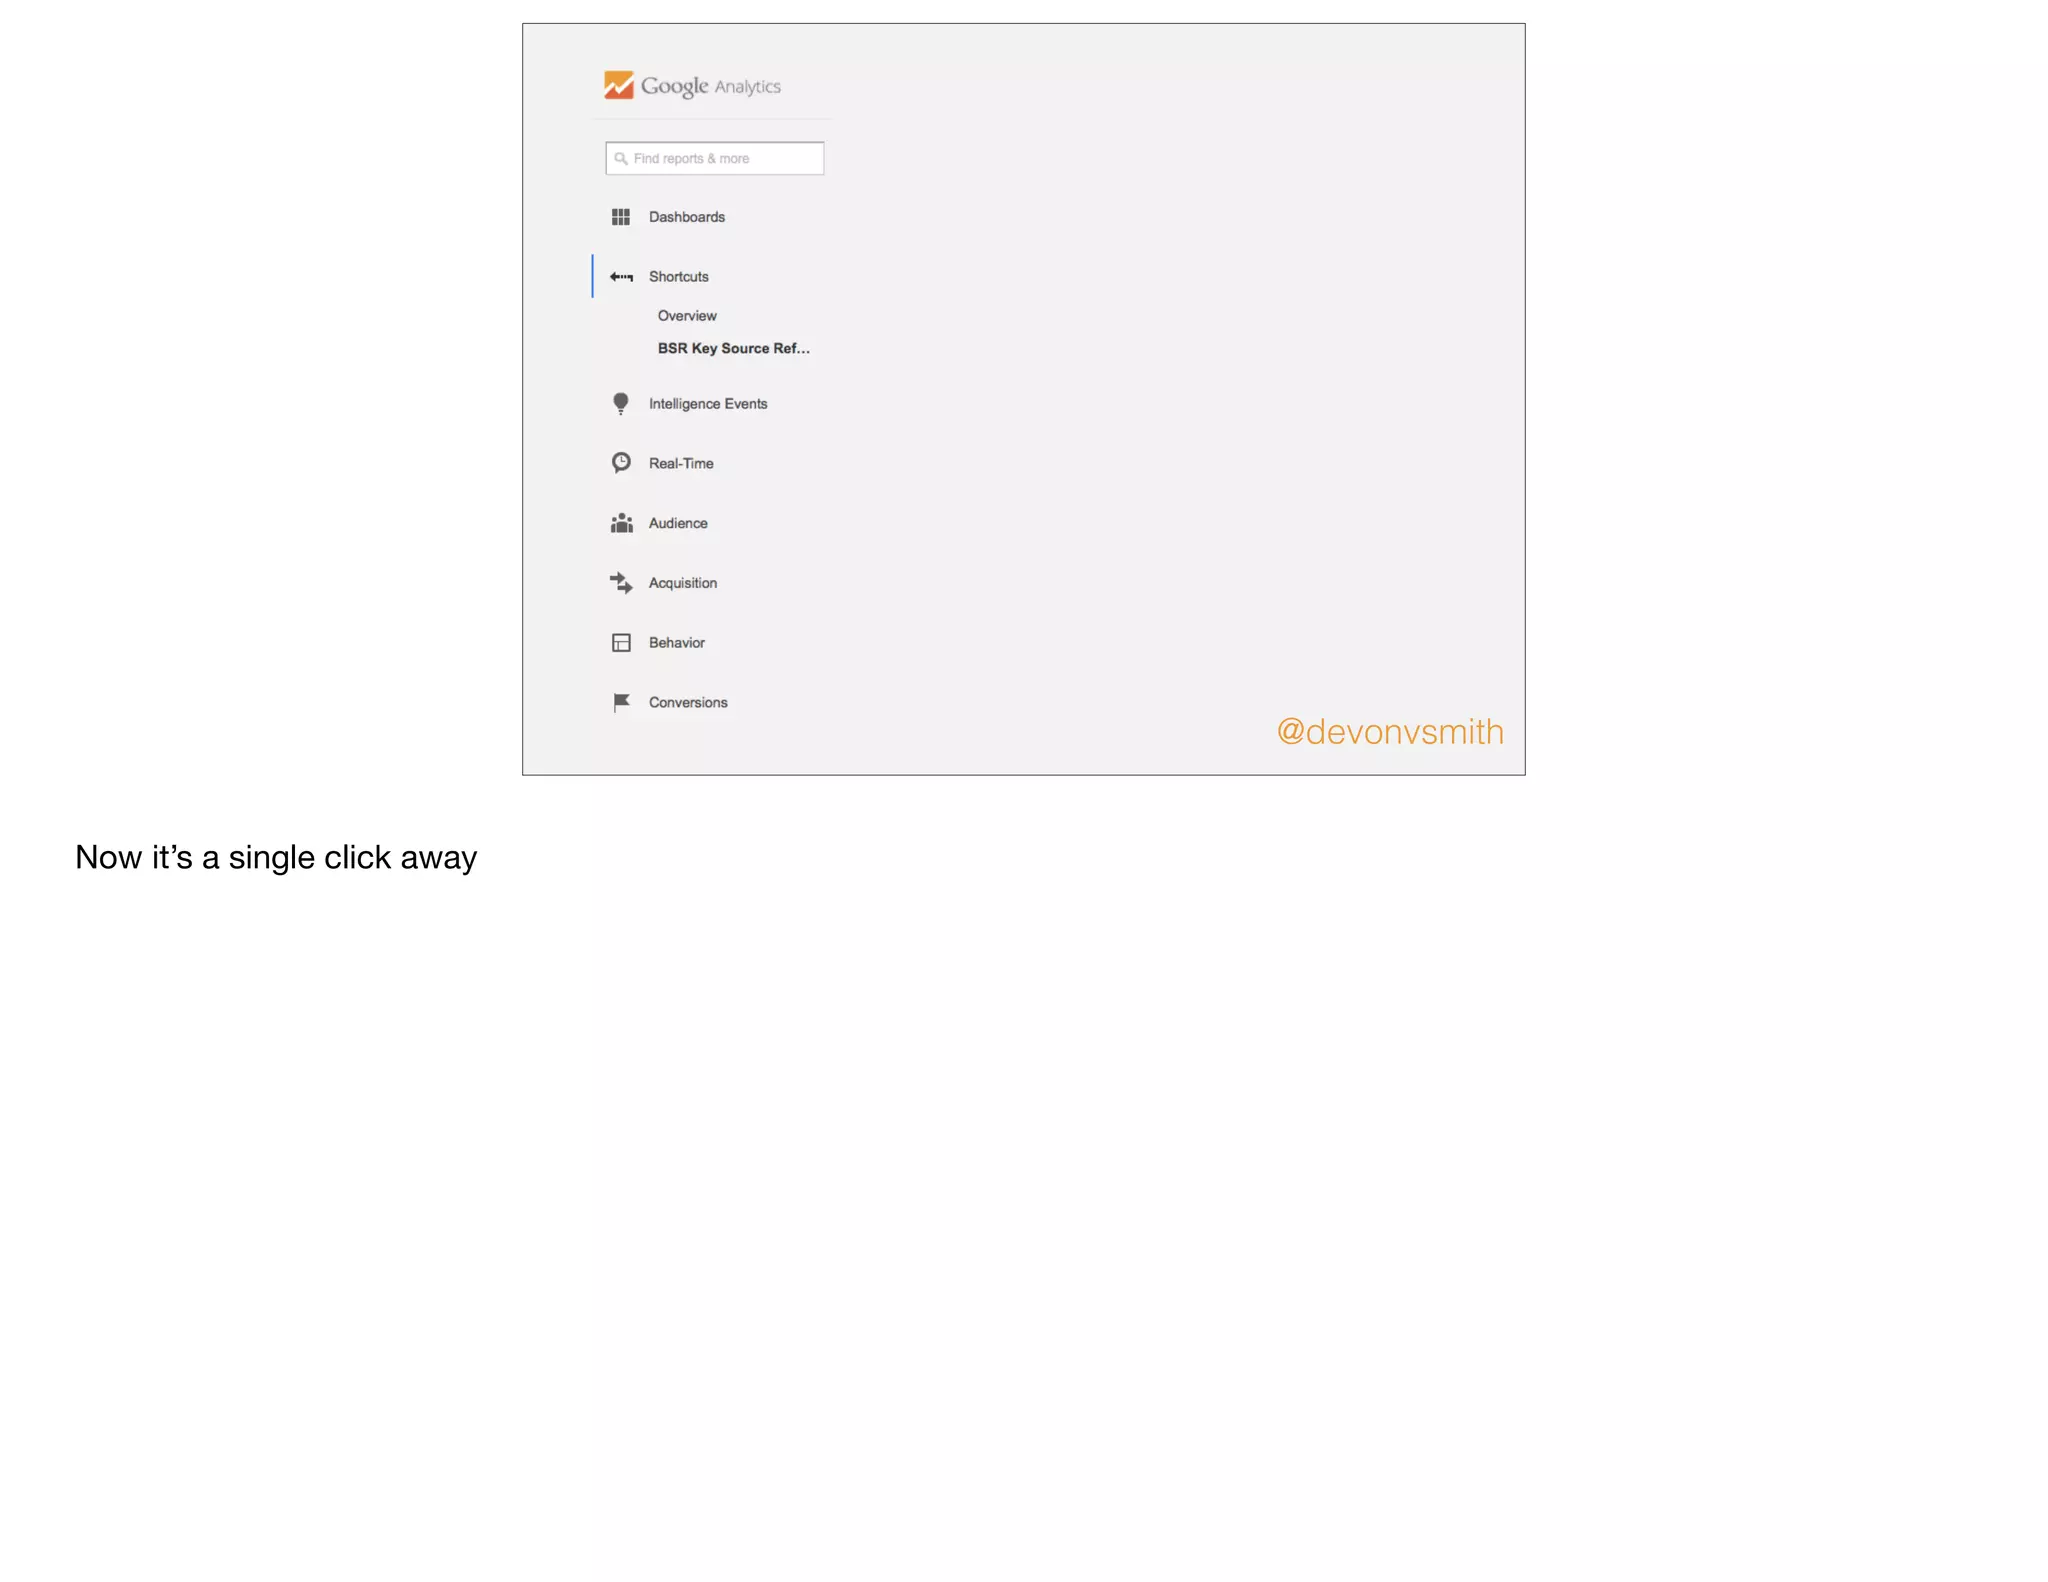
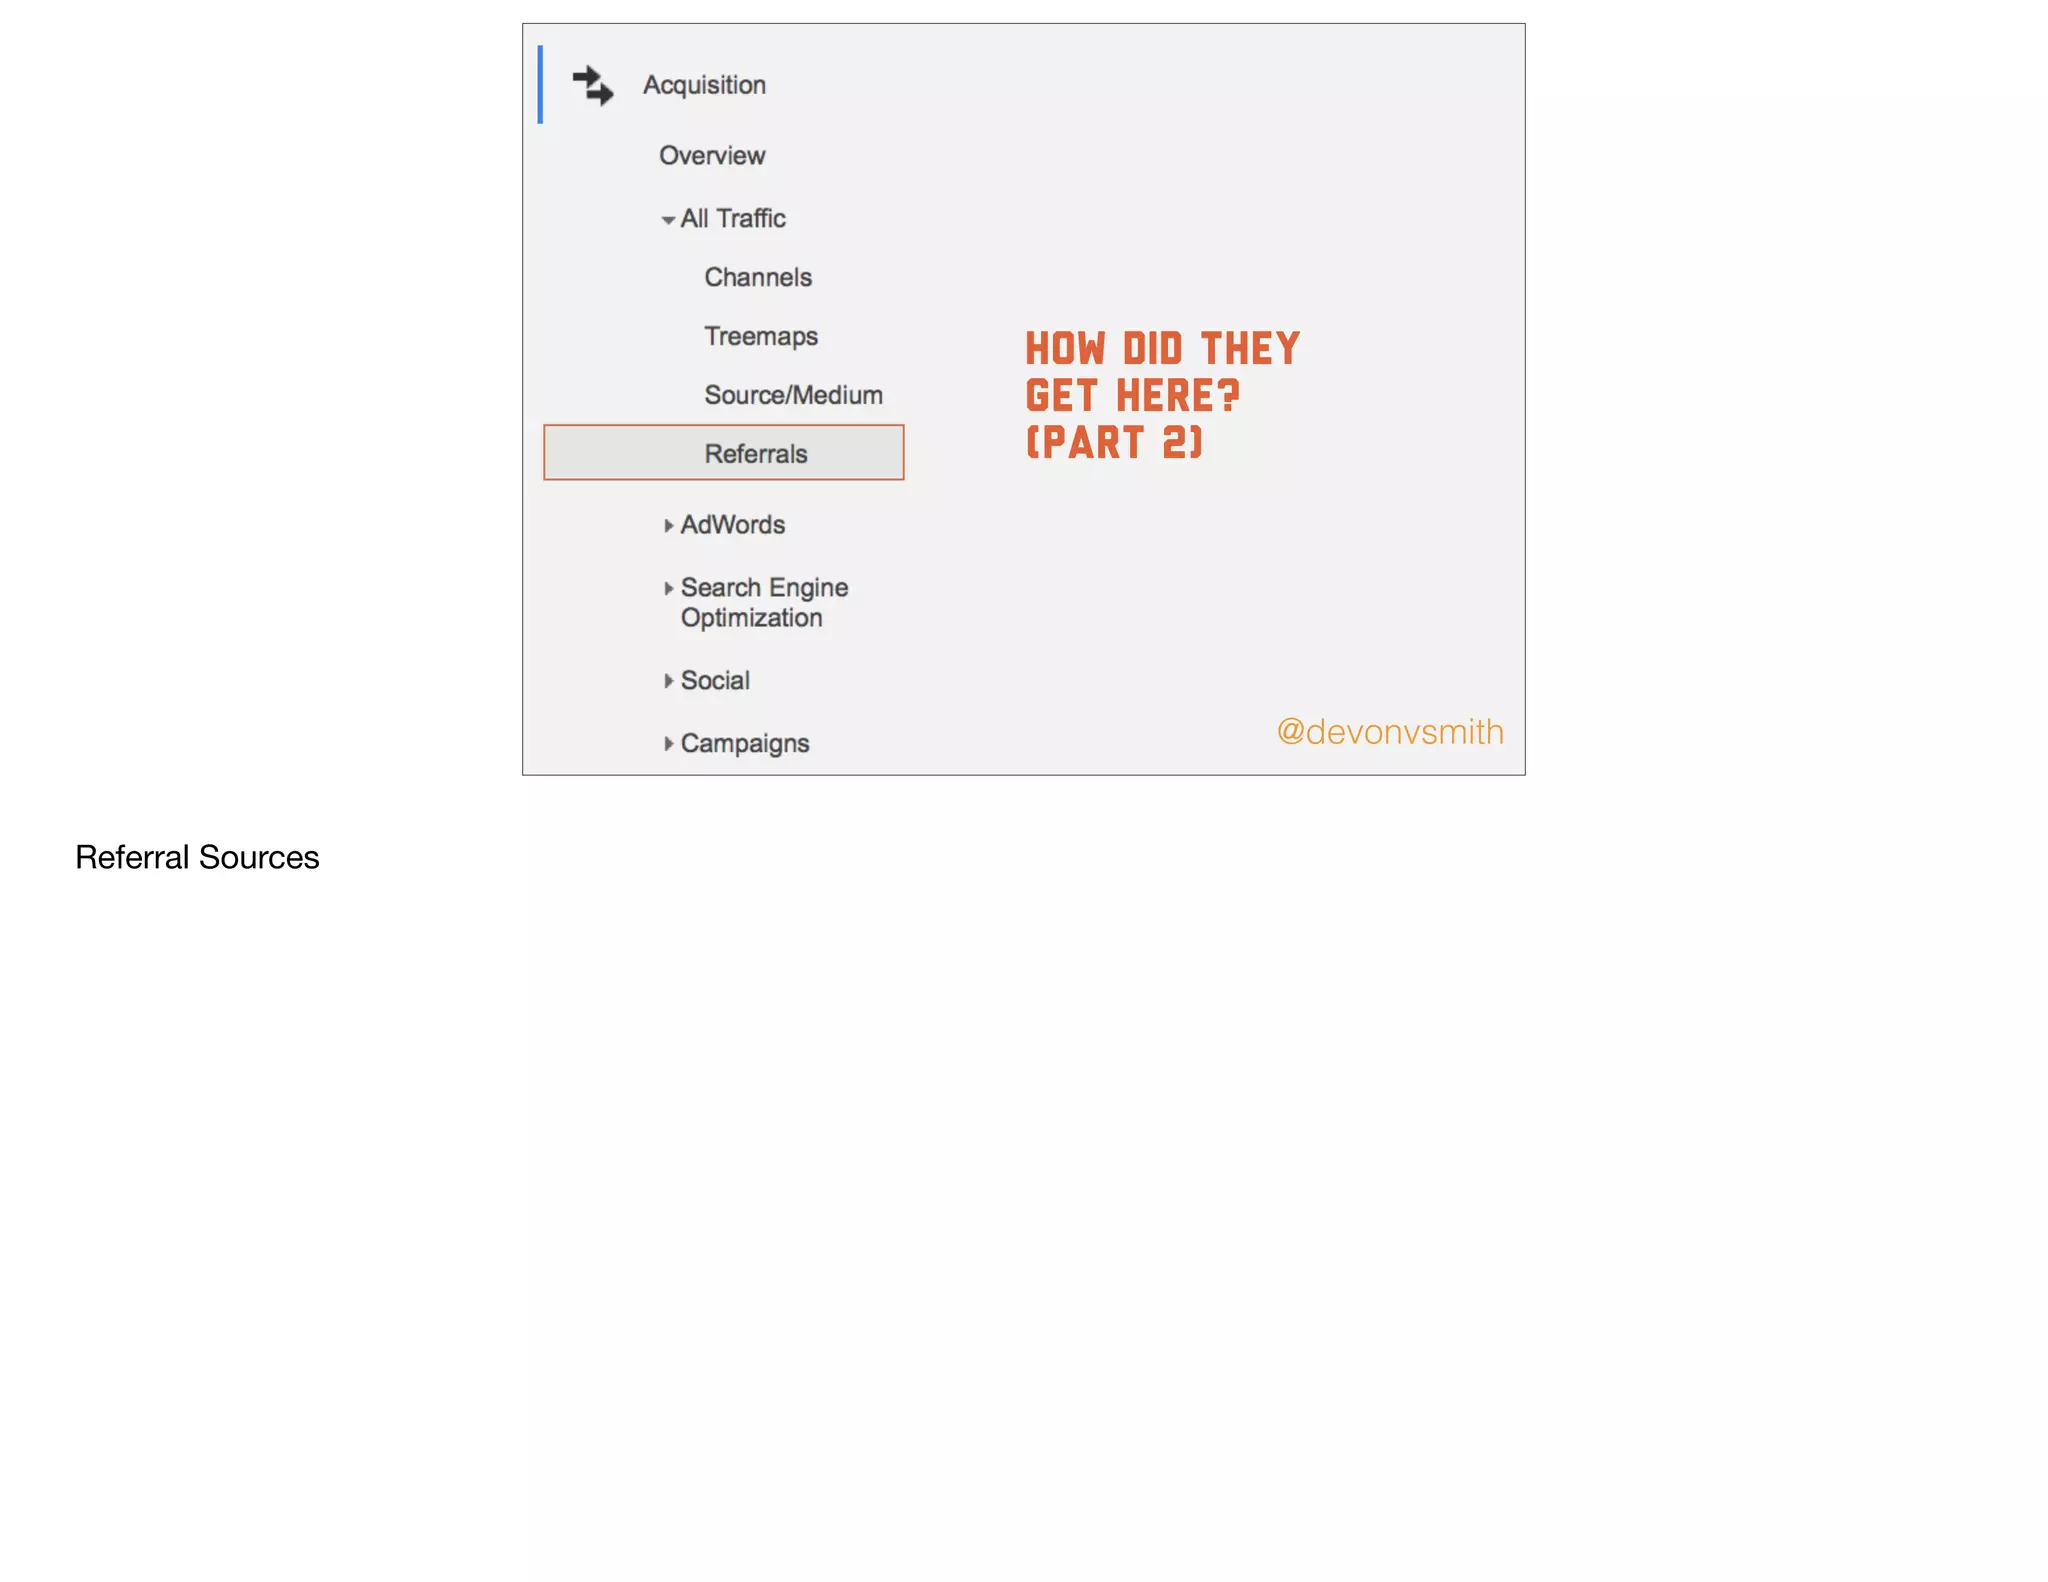
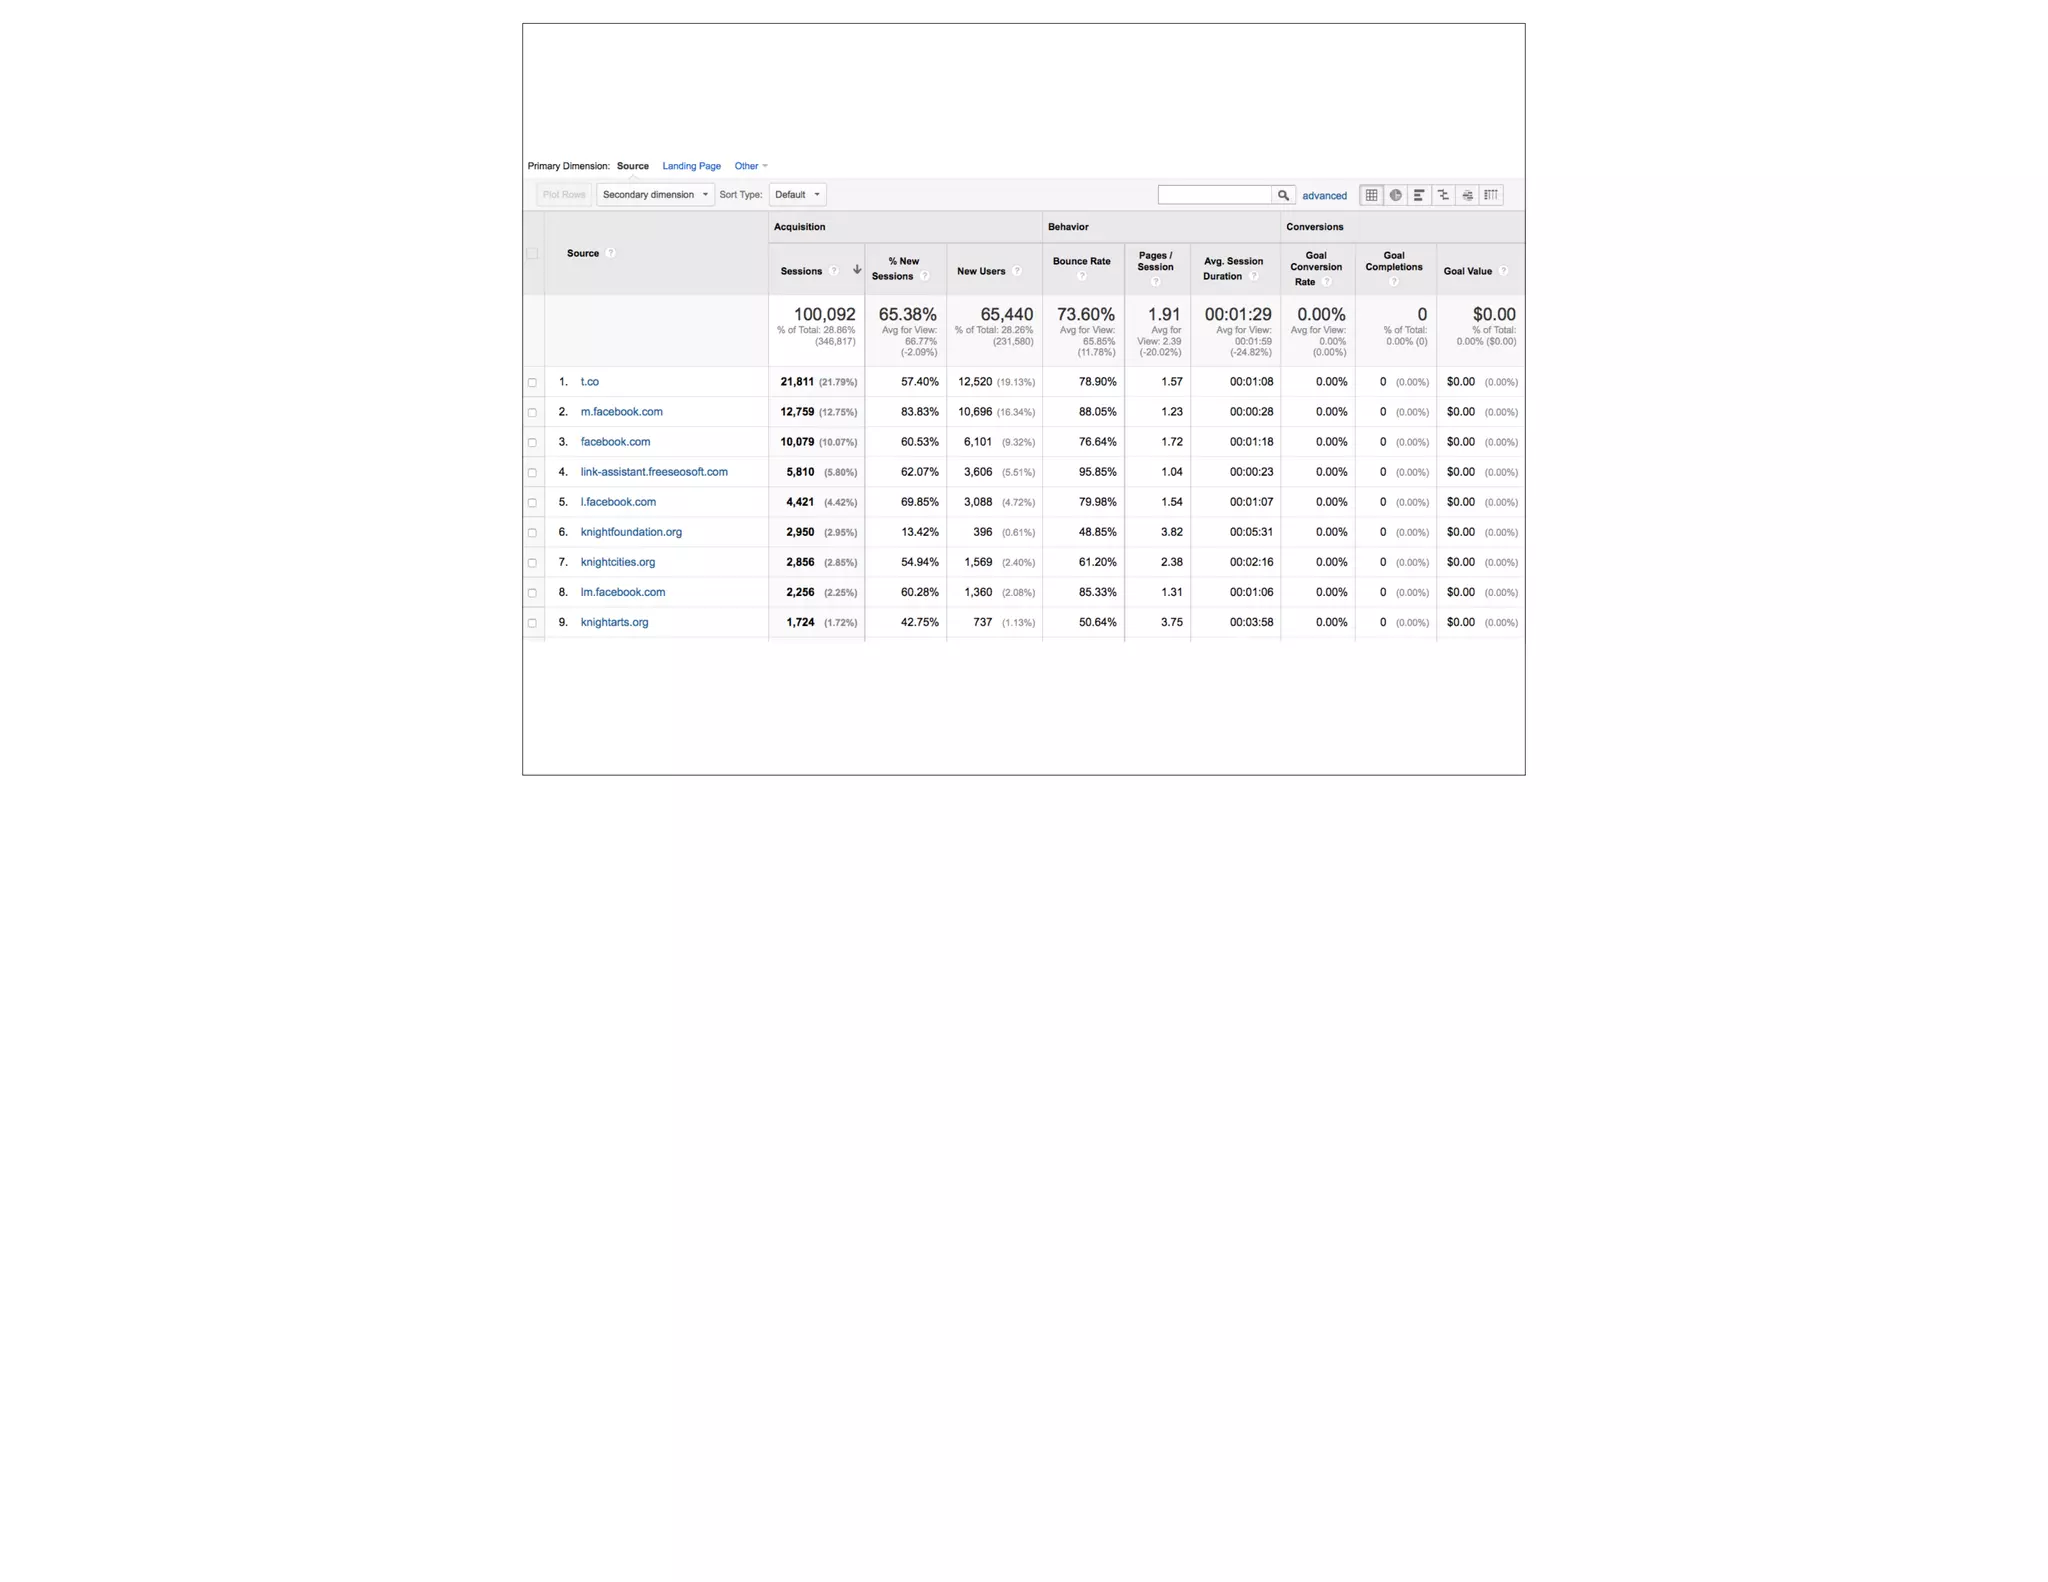
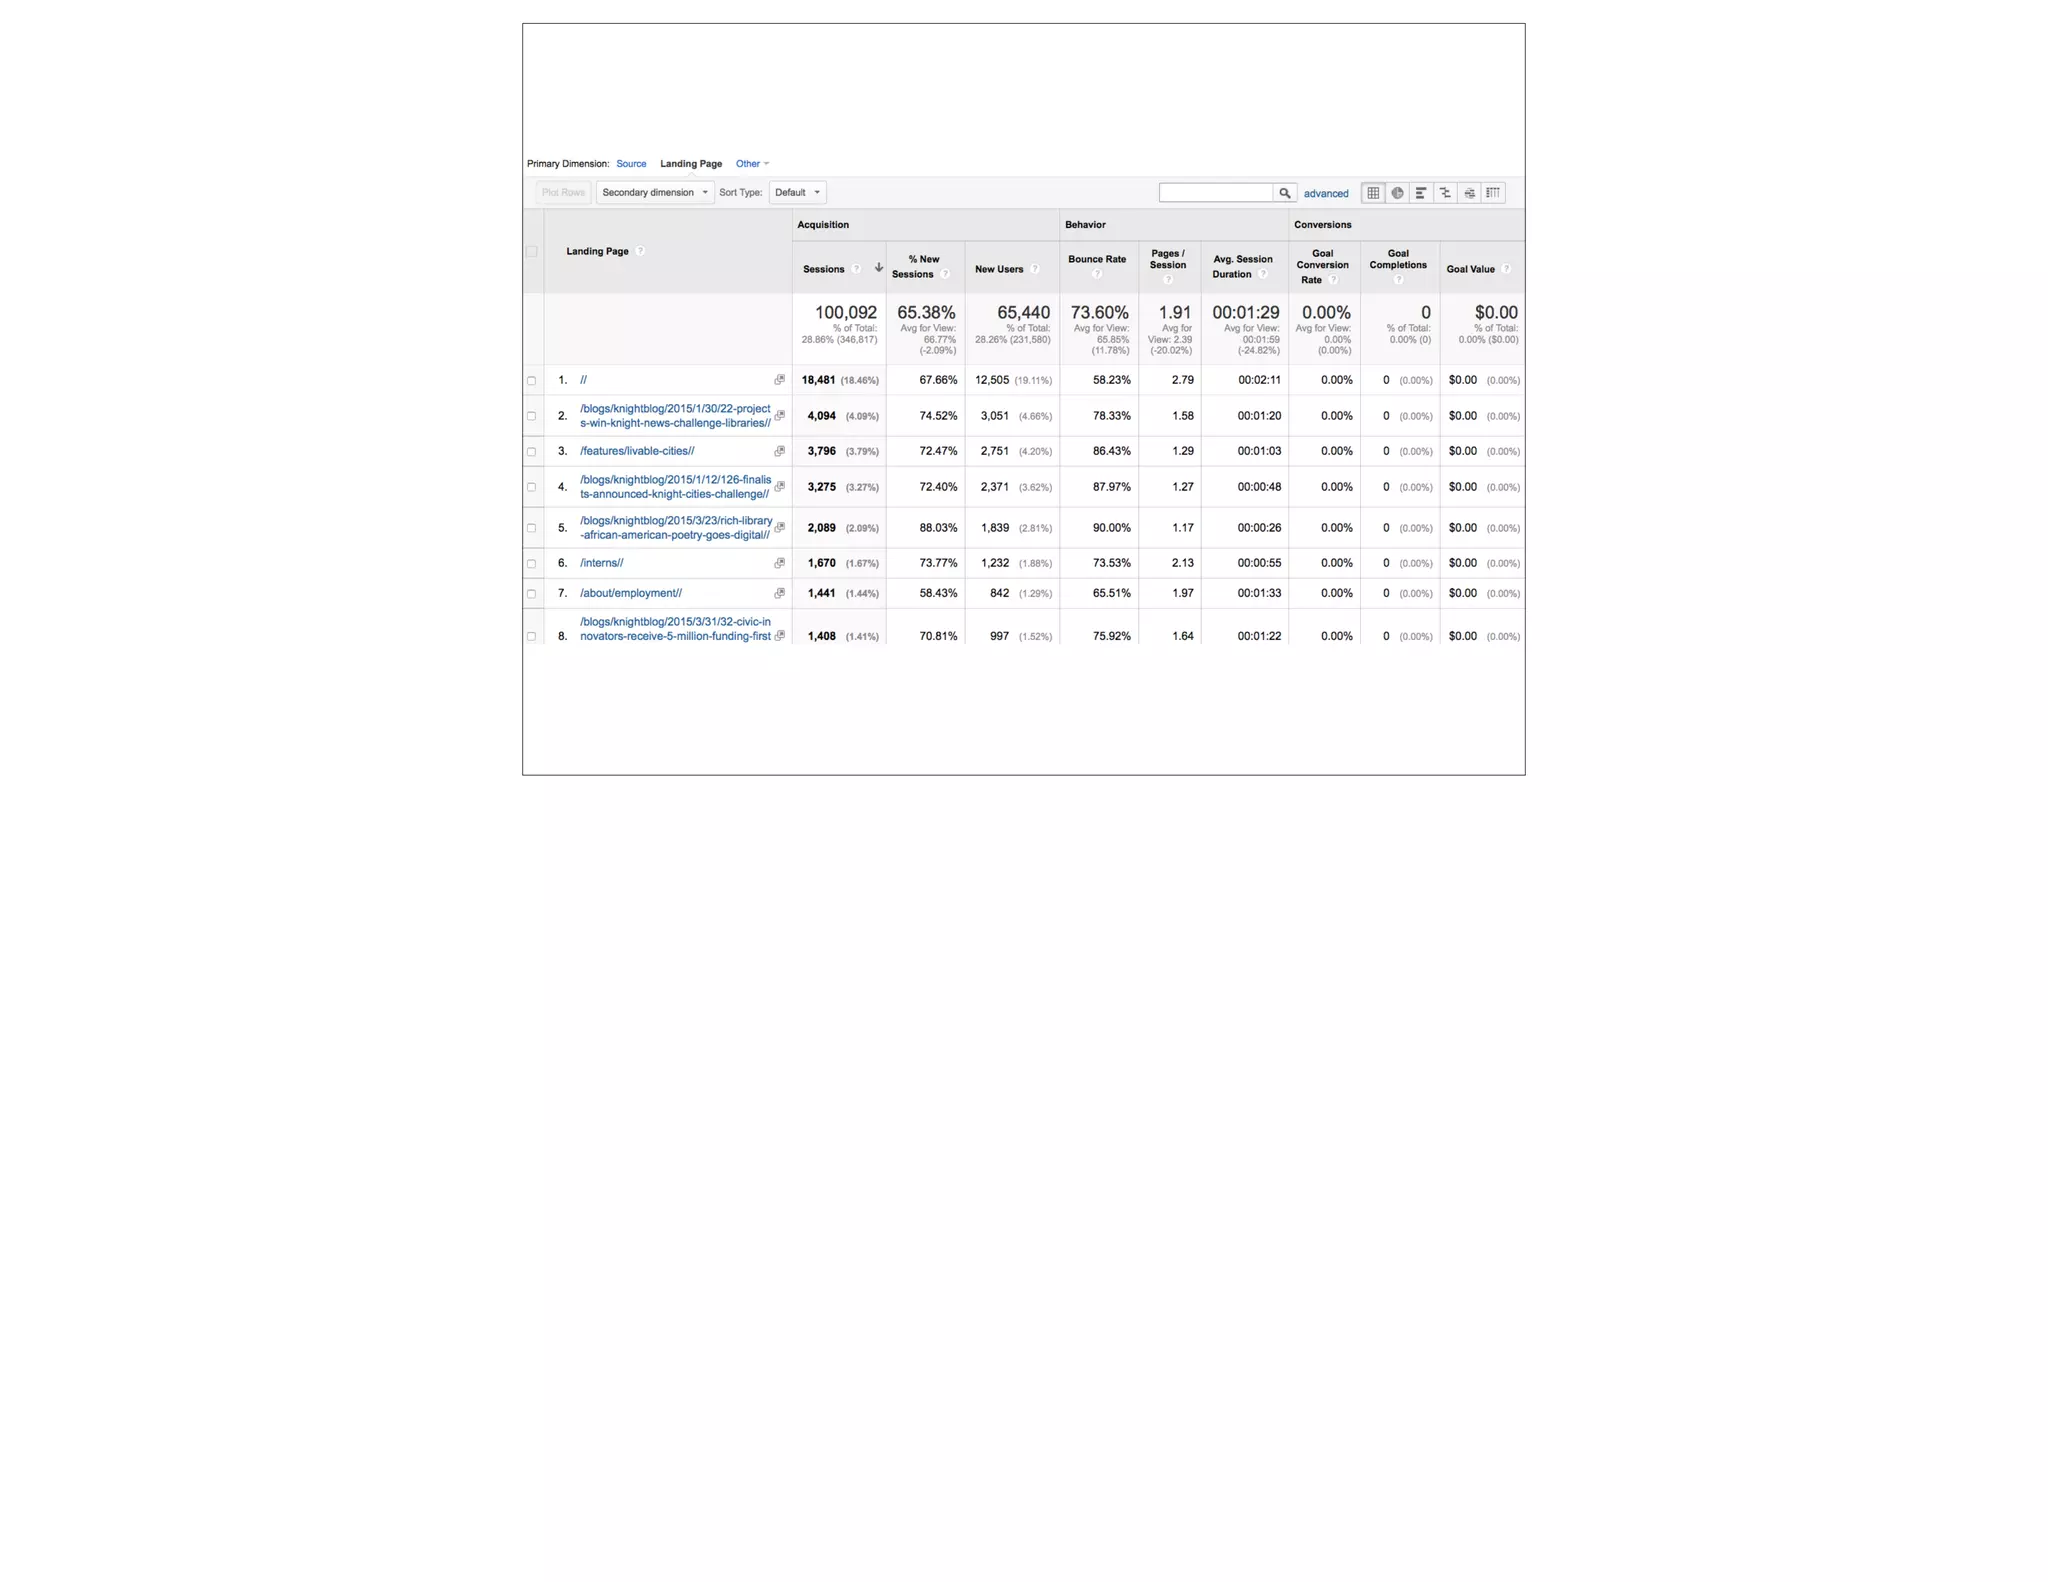
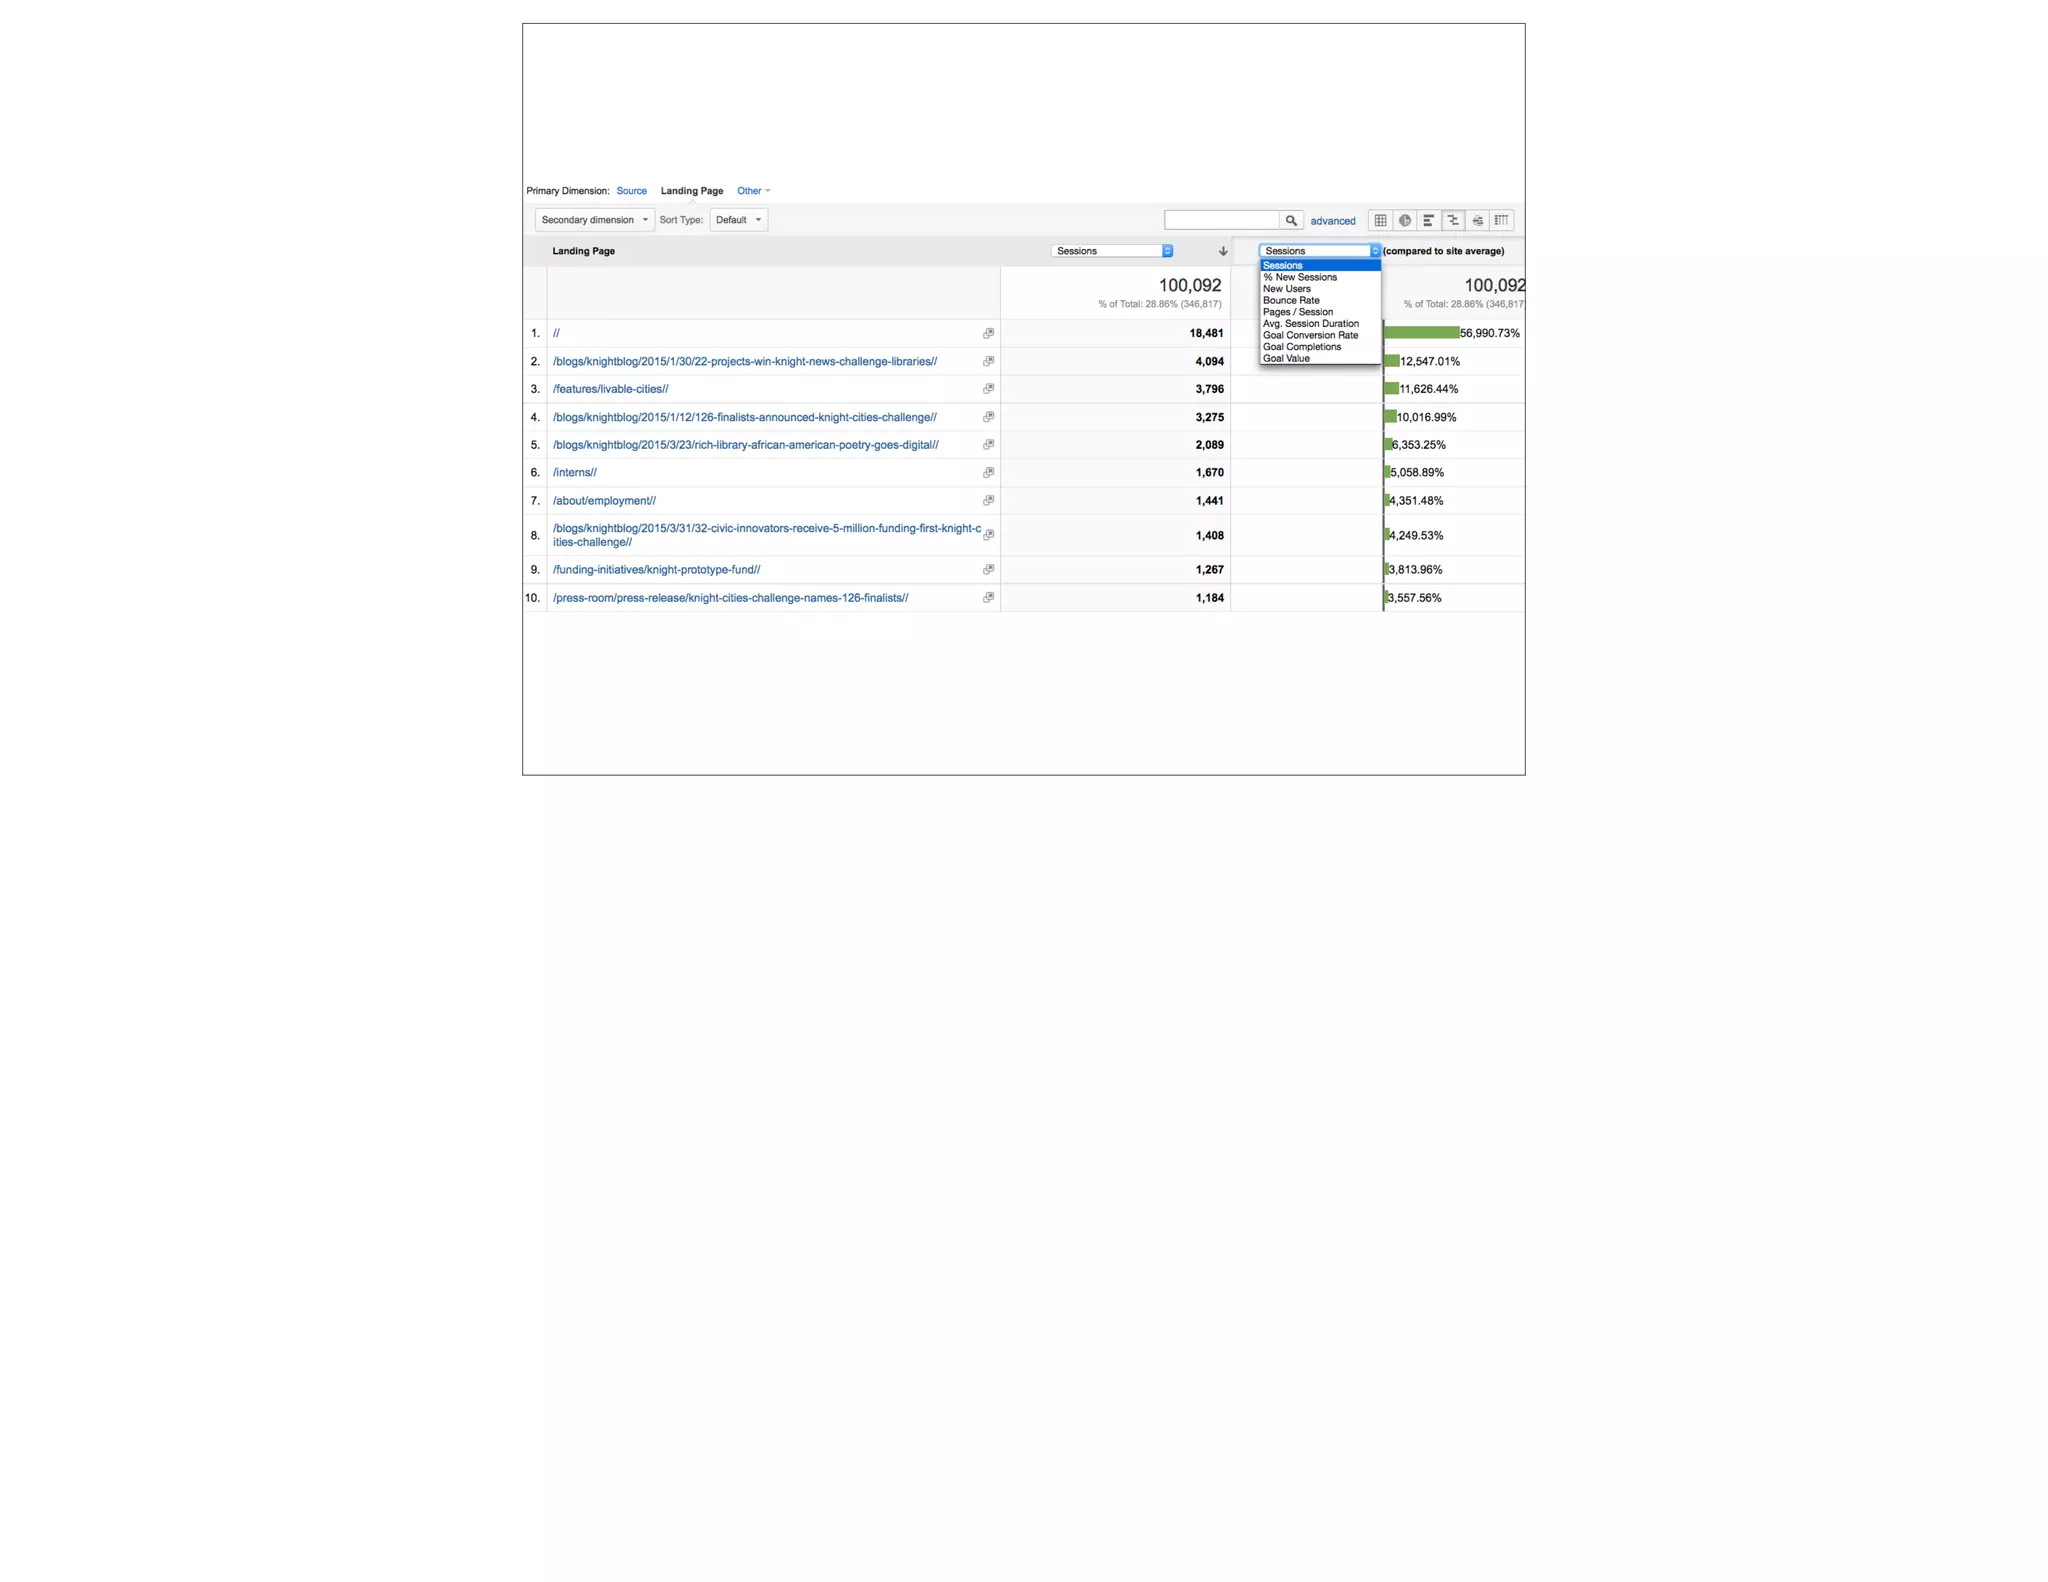
Downloaded 79 times
![[share link to segment]
Hovering over a segment shows you who’s in it
I’m looking for those providers whose names include any of these; exclude those](https://image.slidesharecdn.com/dogooddatahiddensecretsofgoogleanalytics-150430155241-conversion-gate01/75/Hidden-Secrets-of-Google-Analytics-Do-Good-Data-2015-13-2048.jpg)
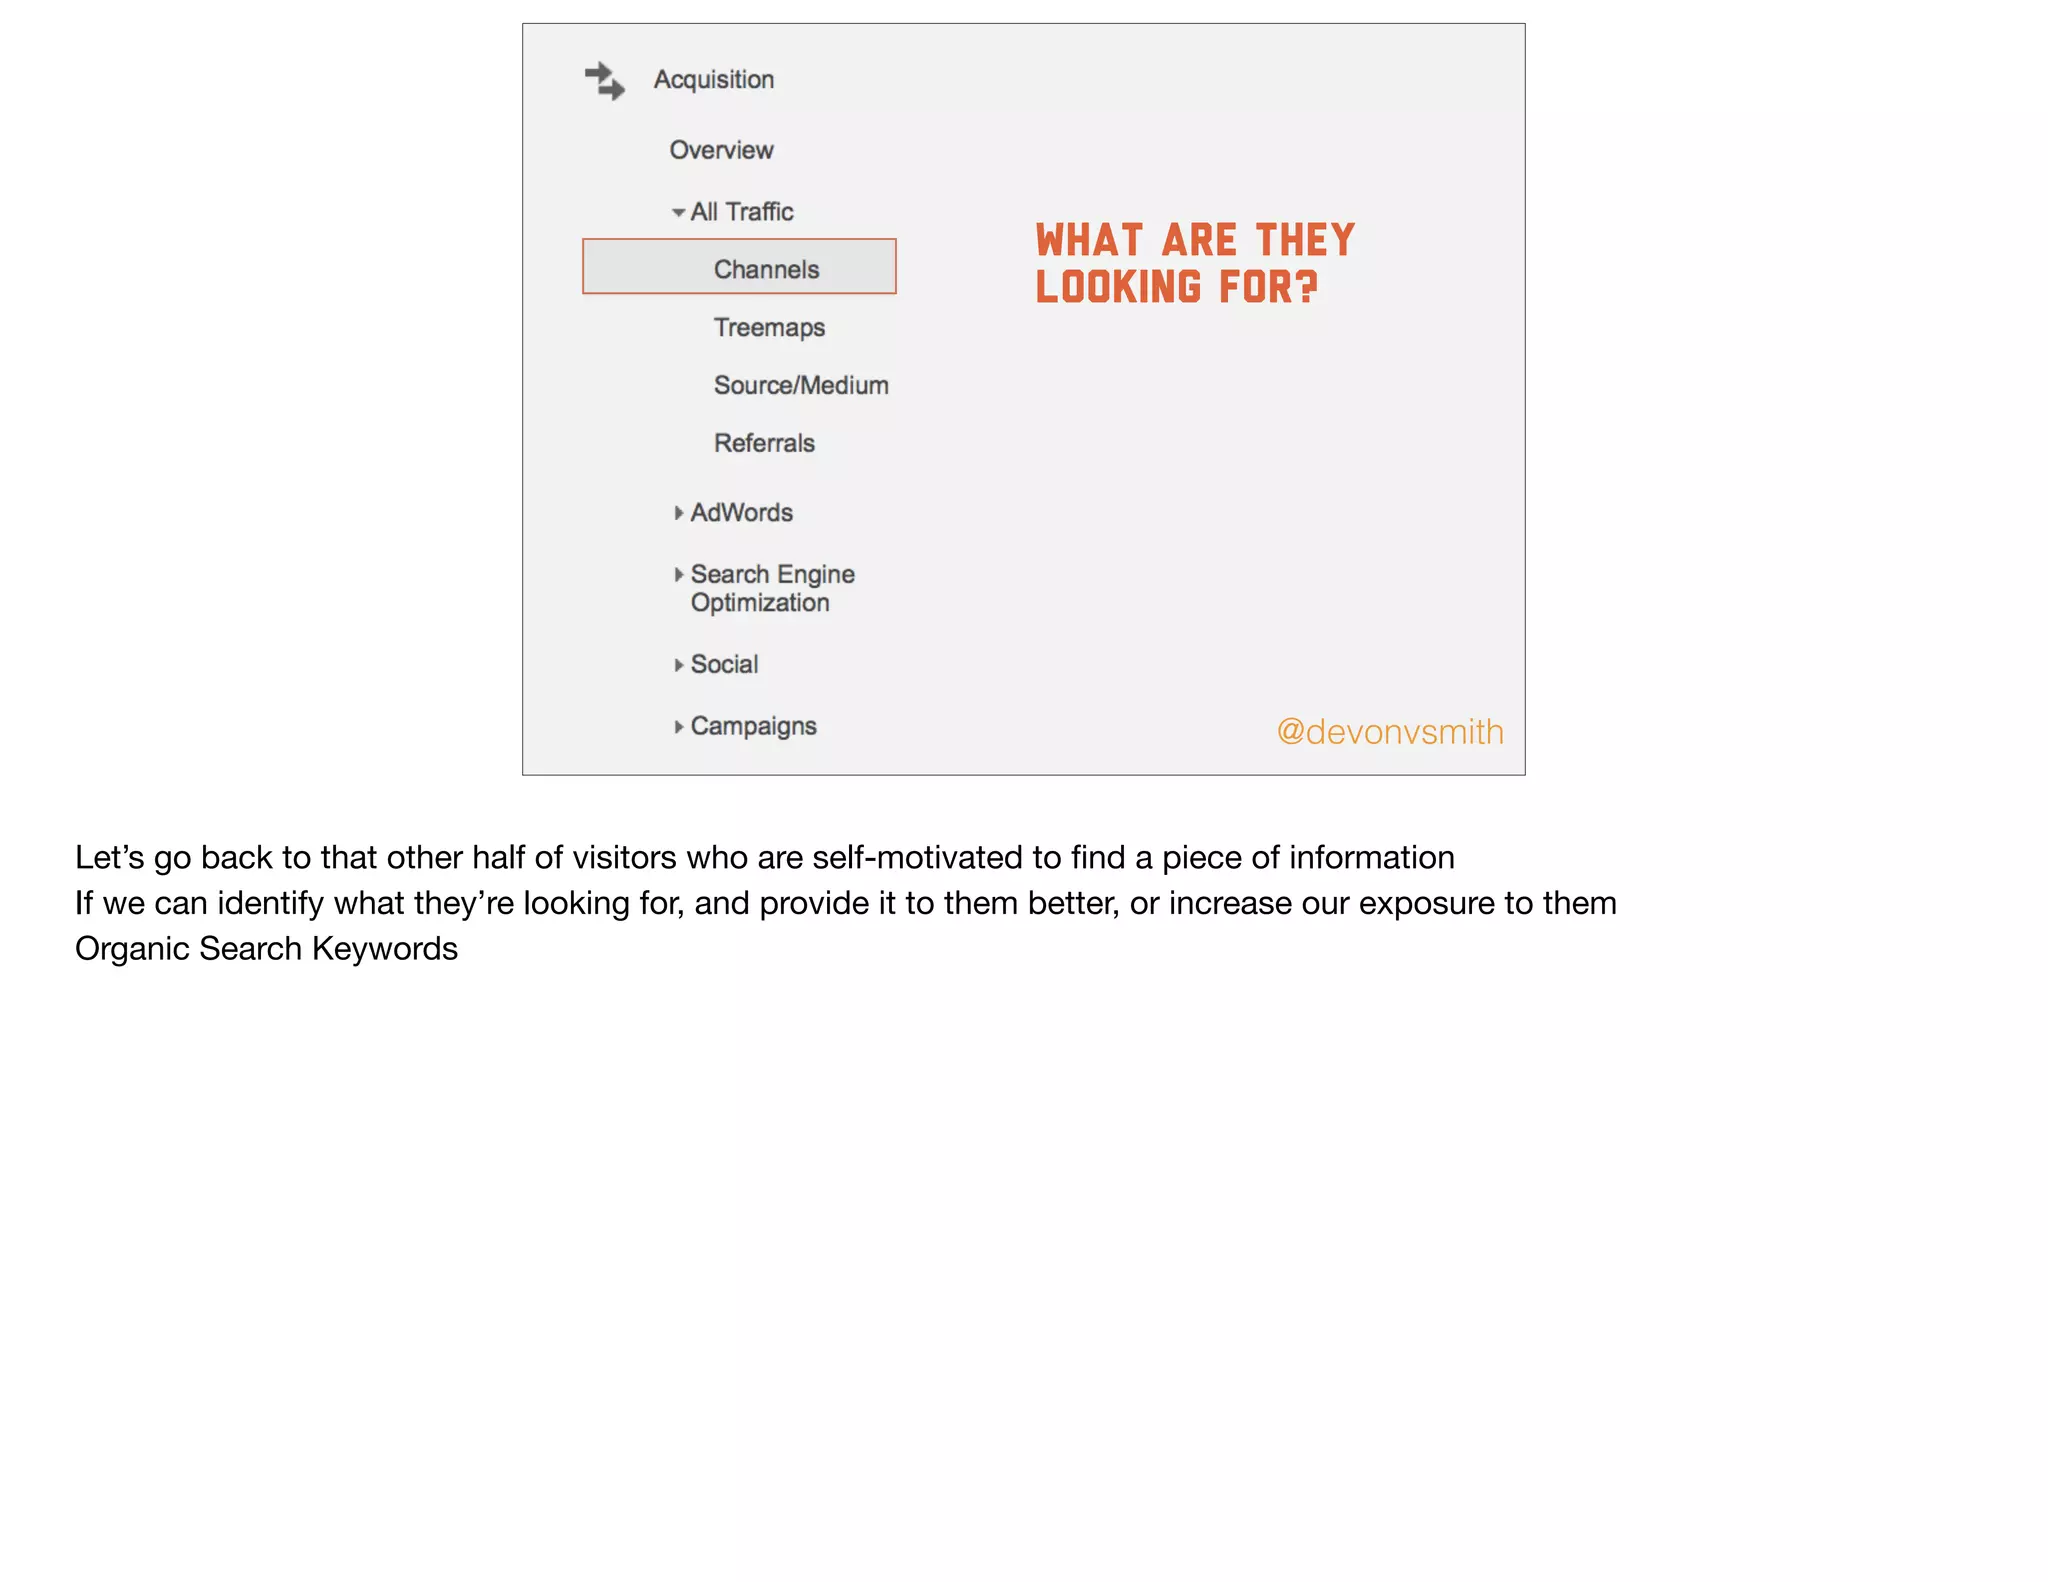
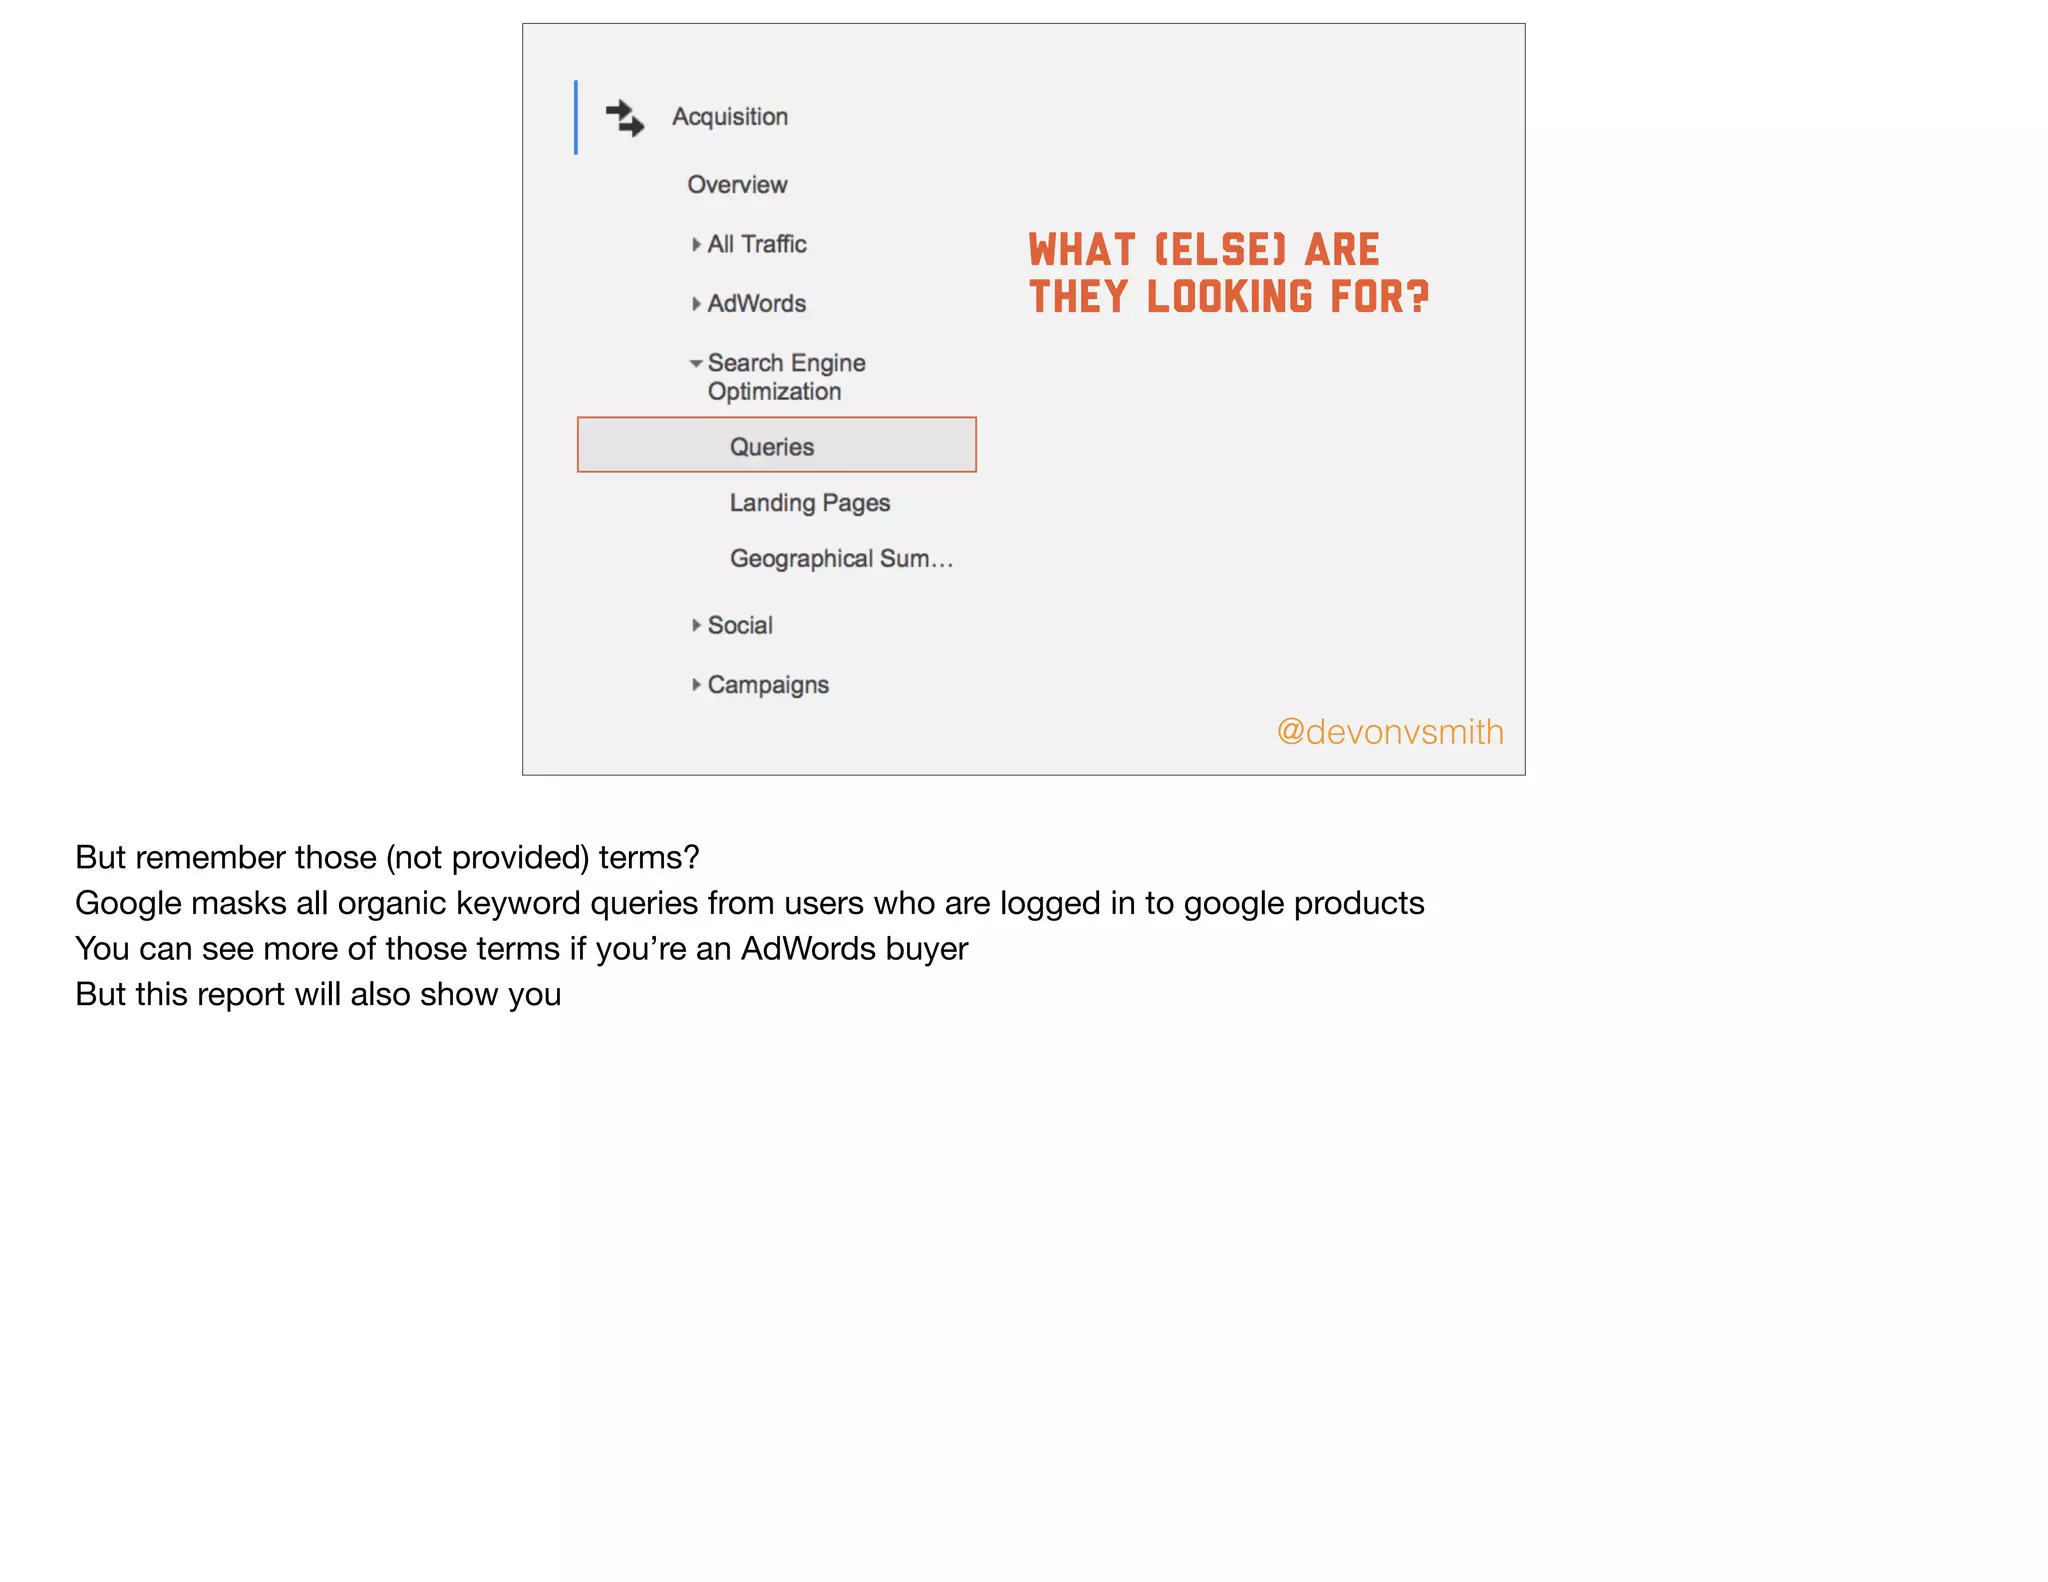
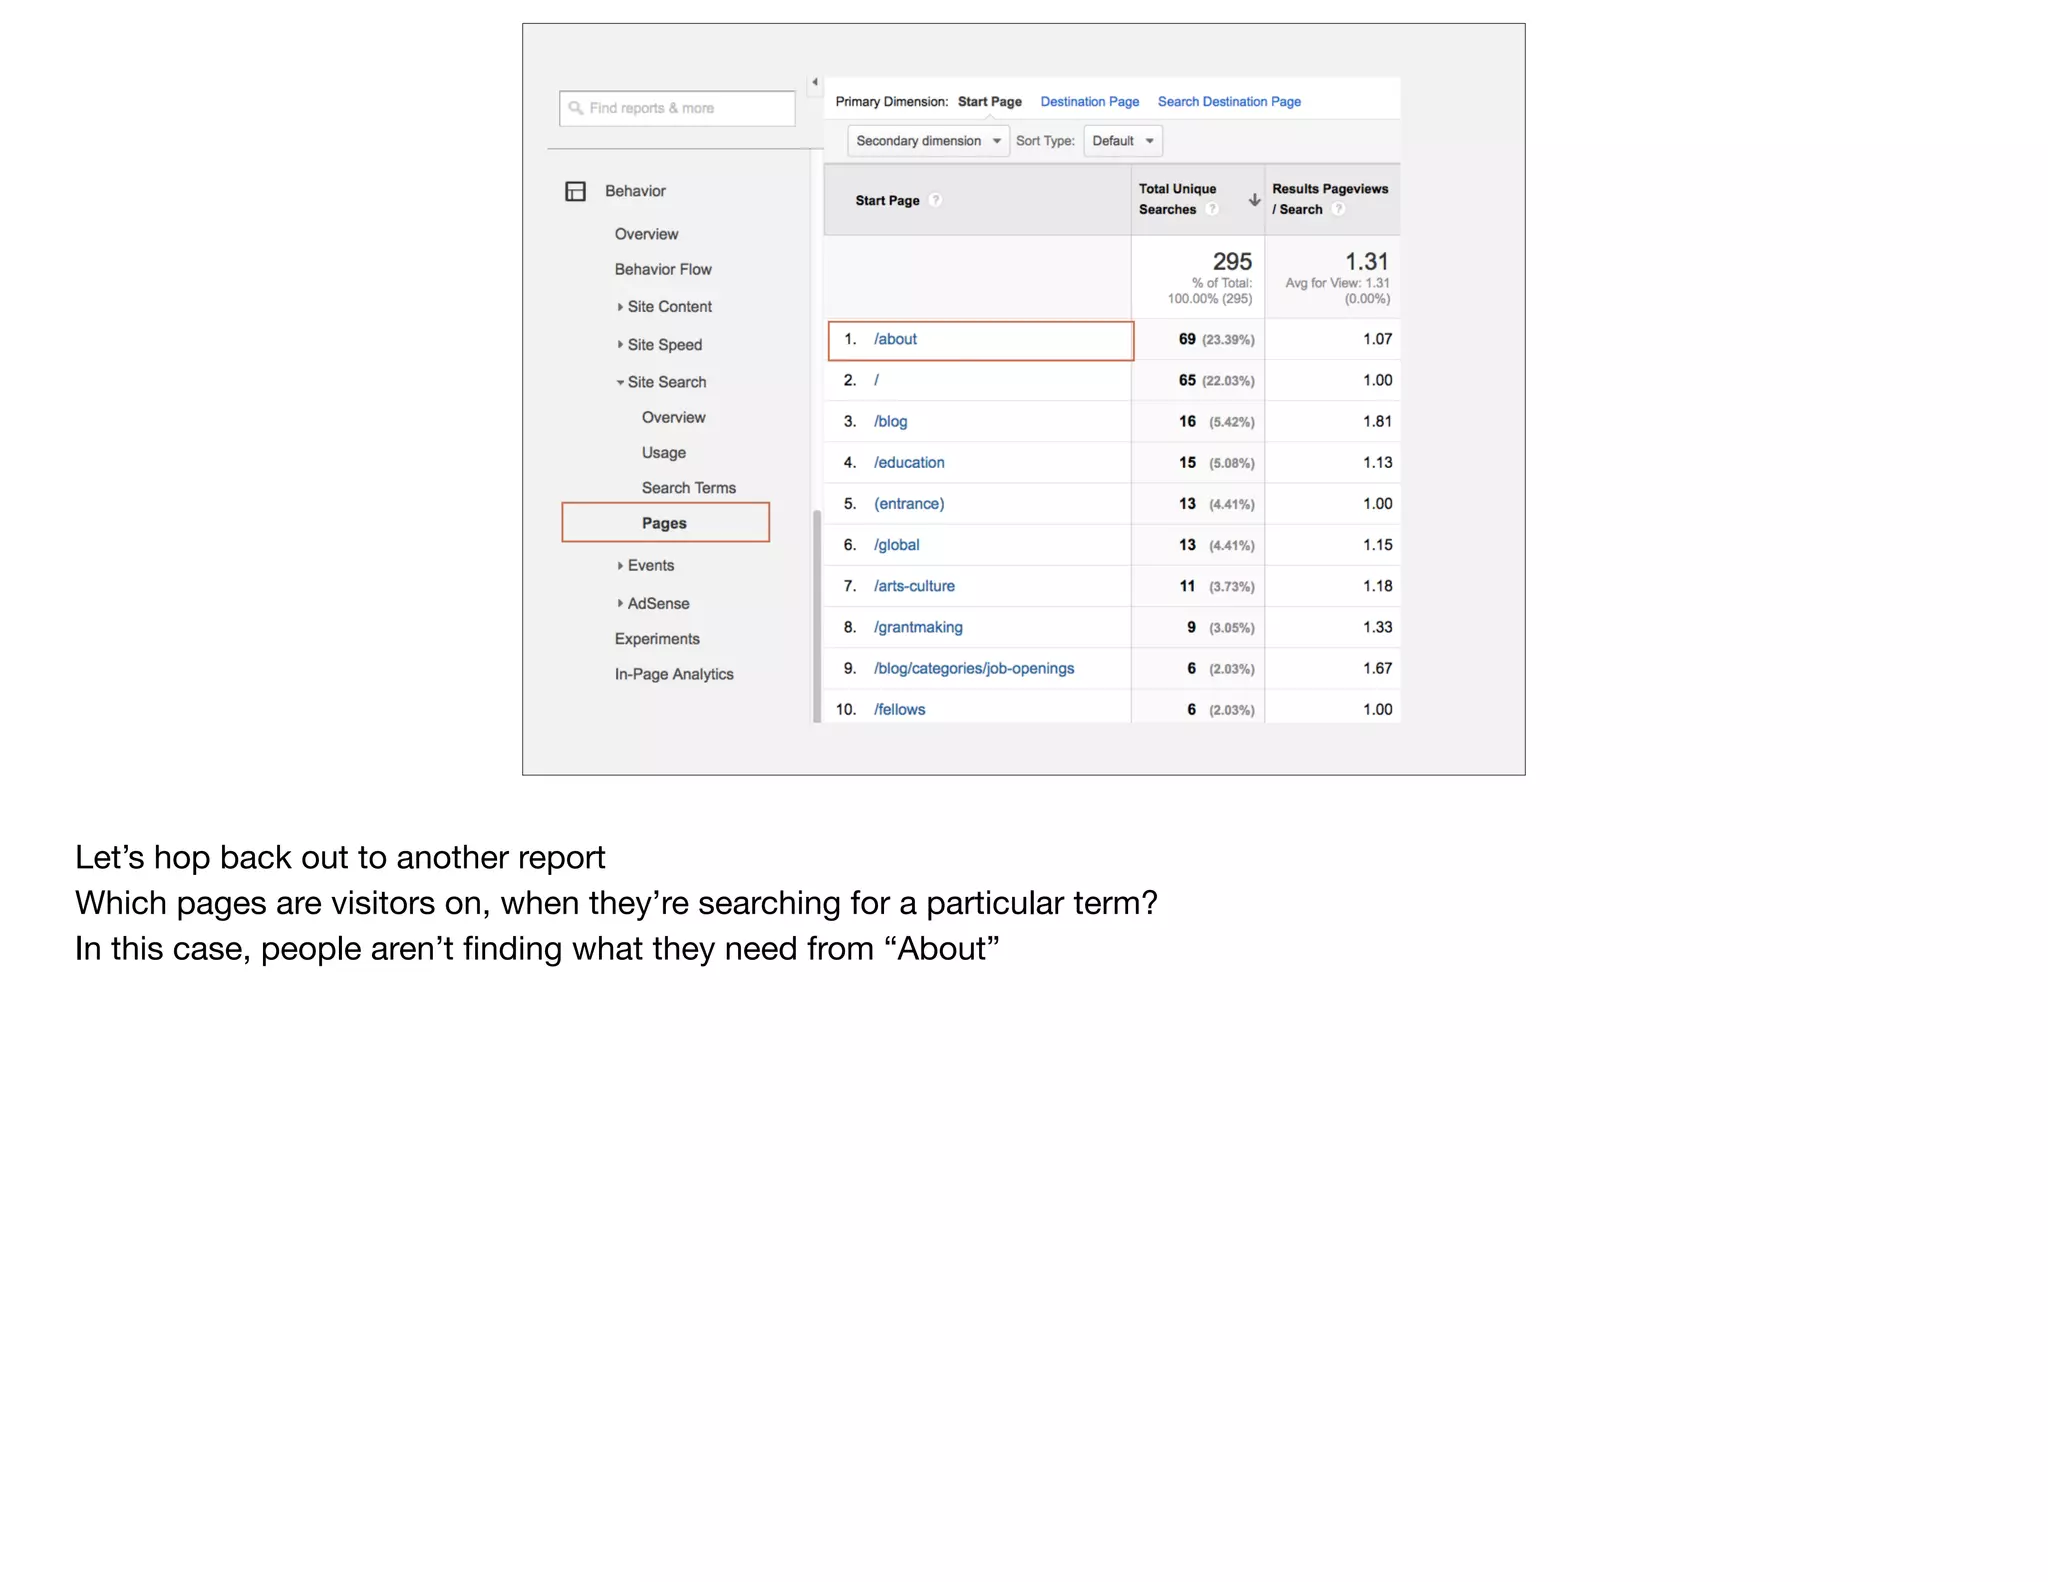
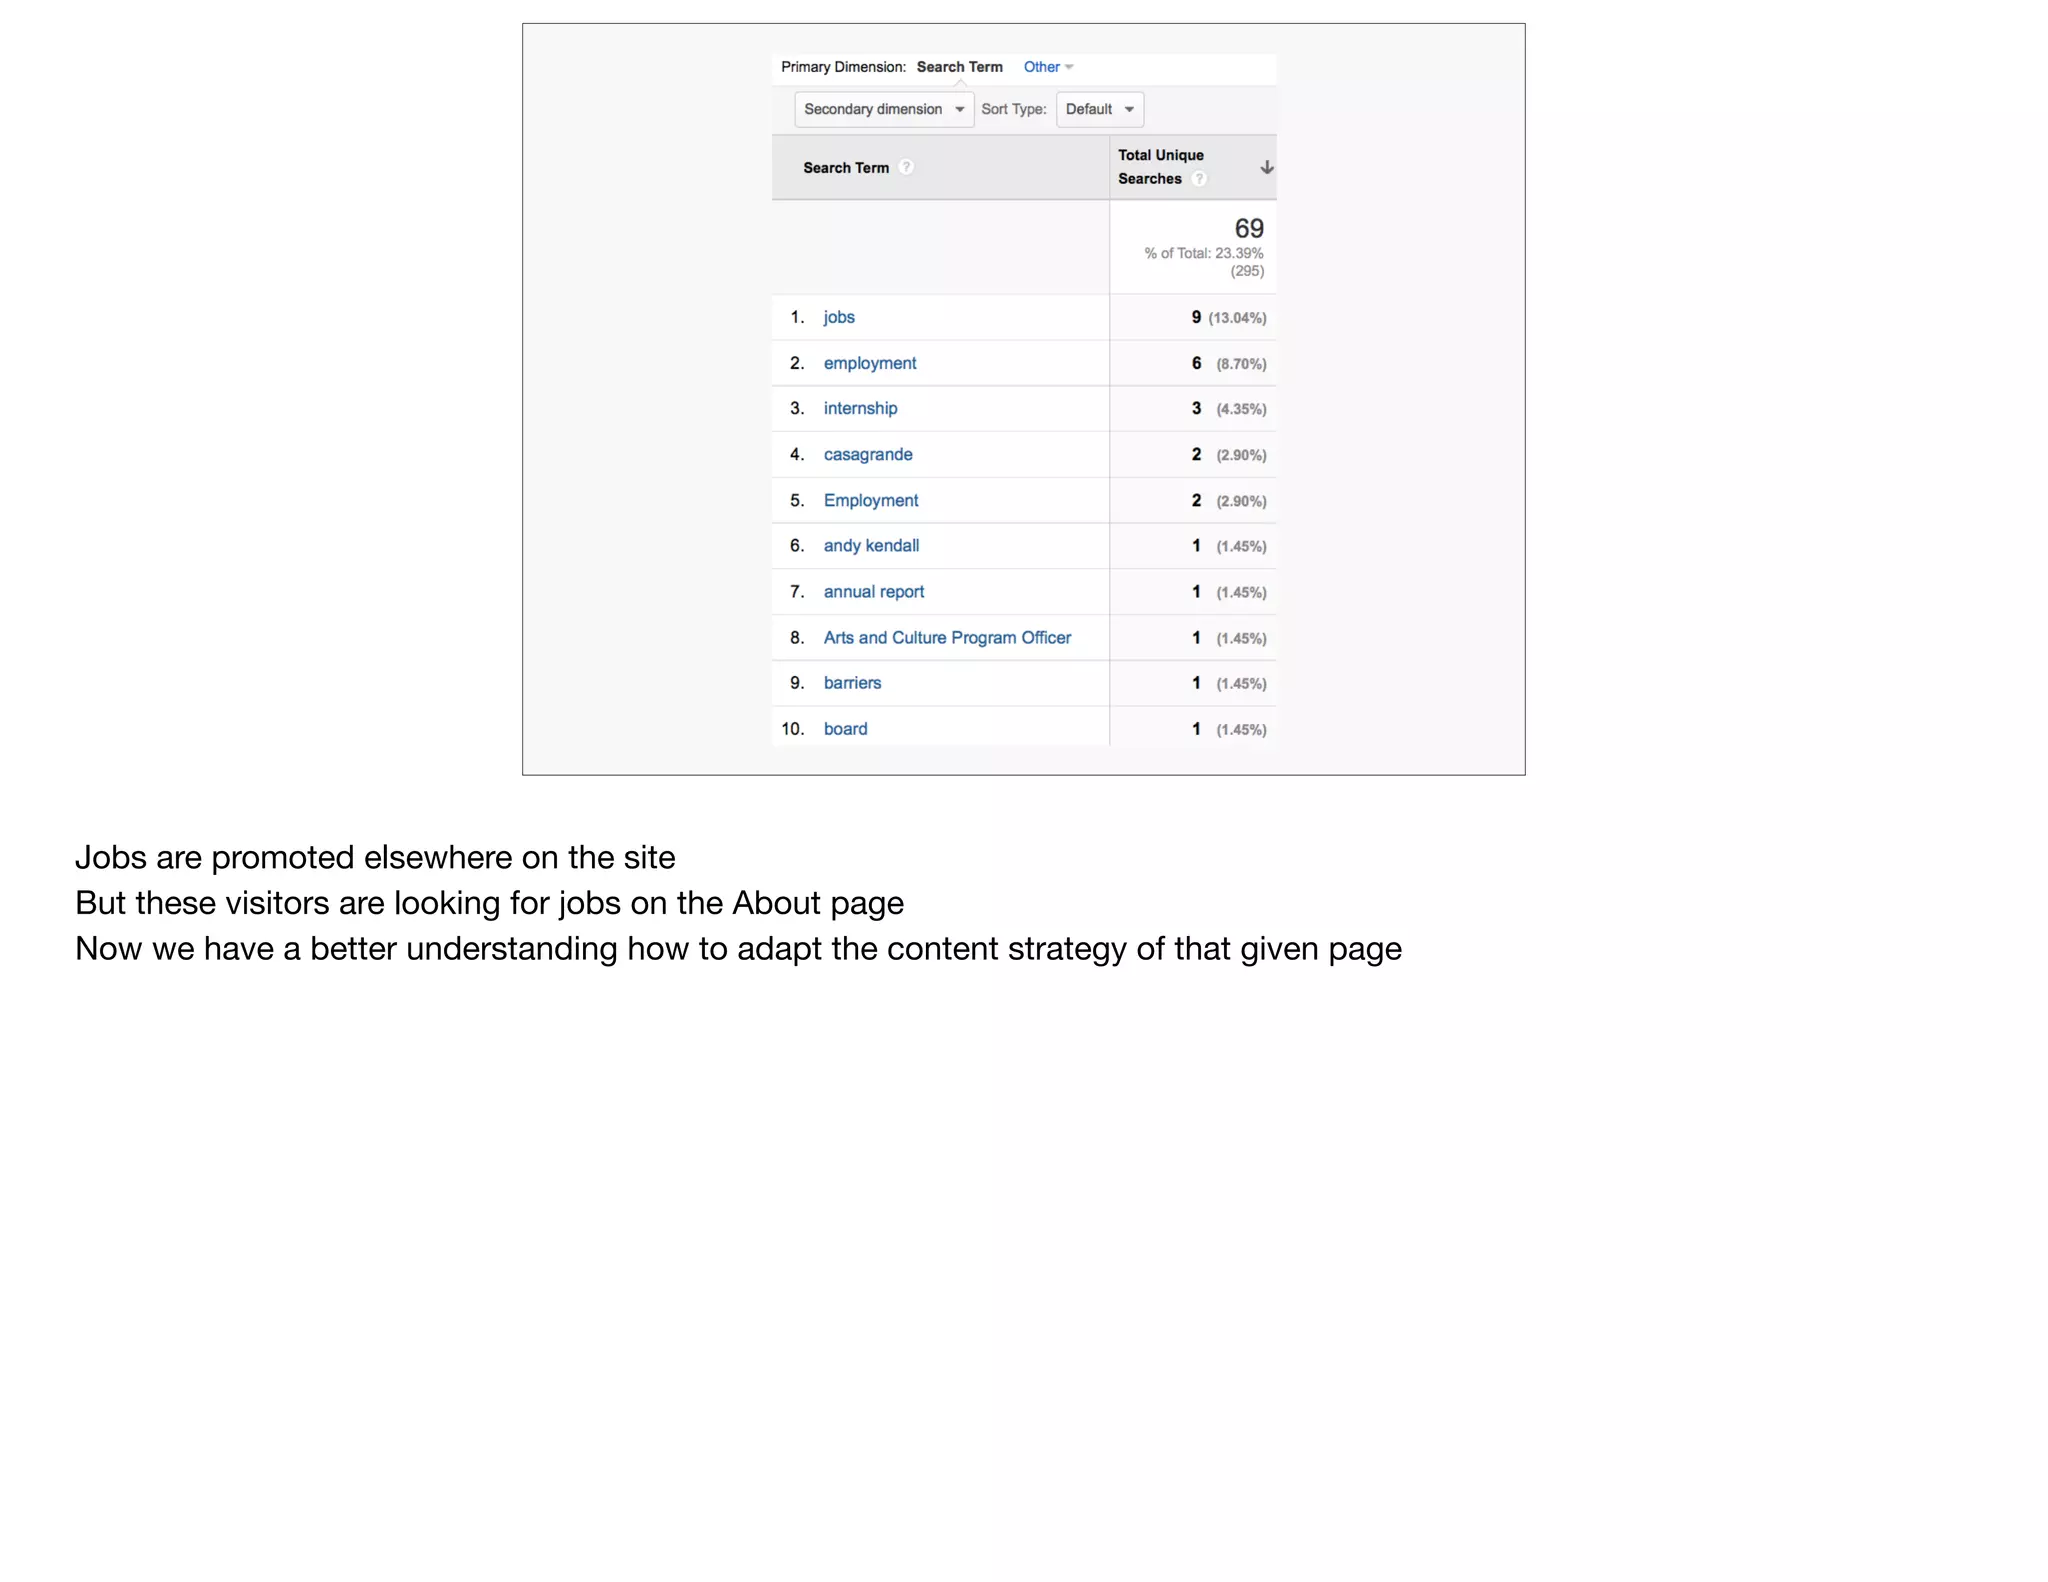
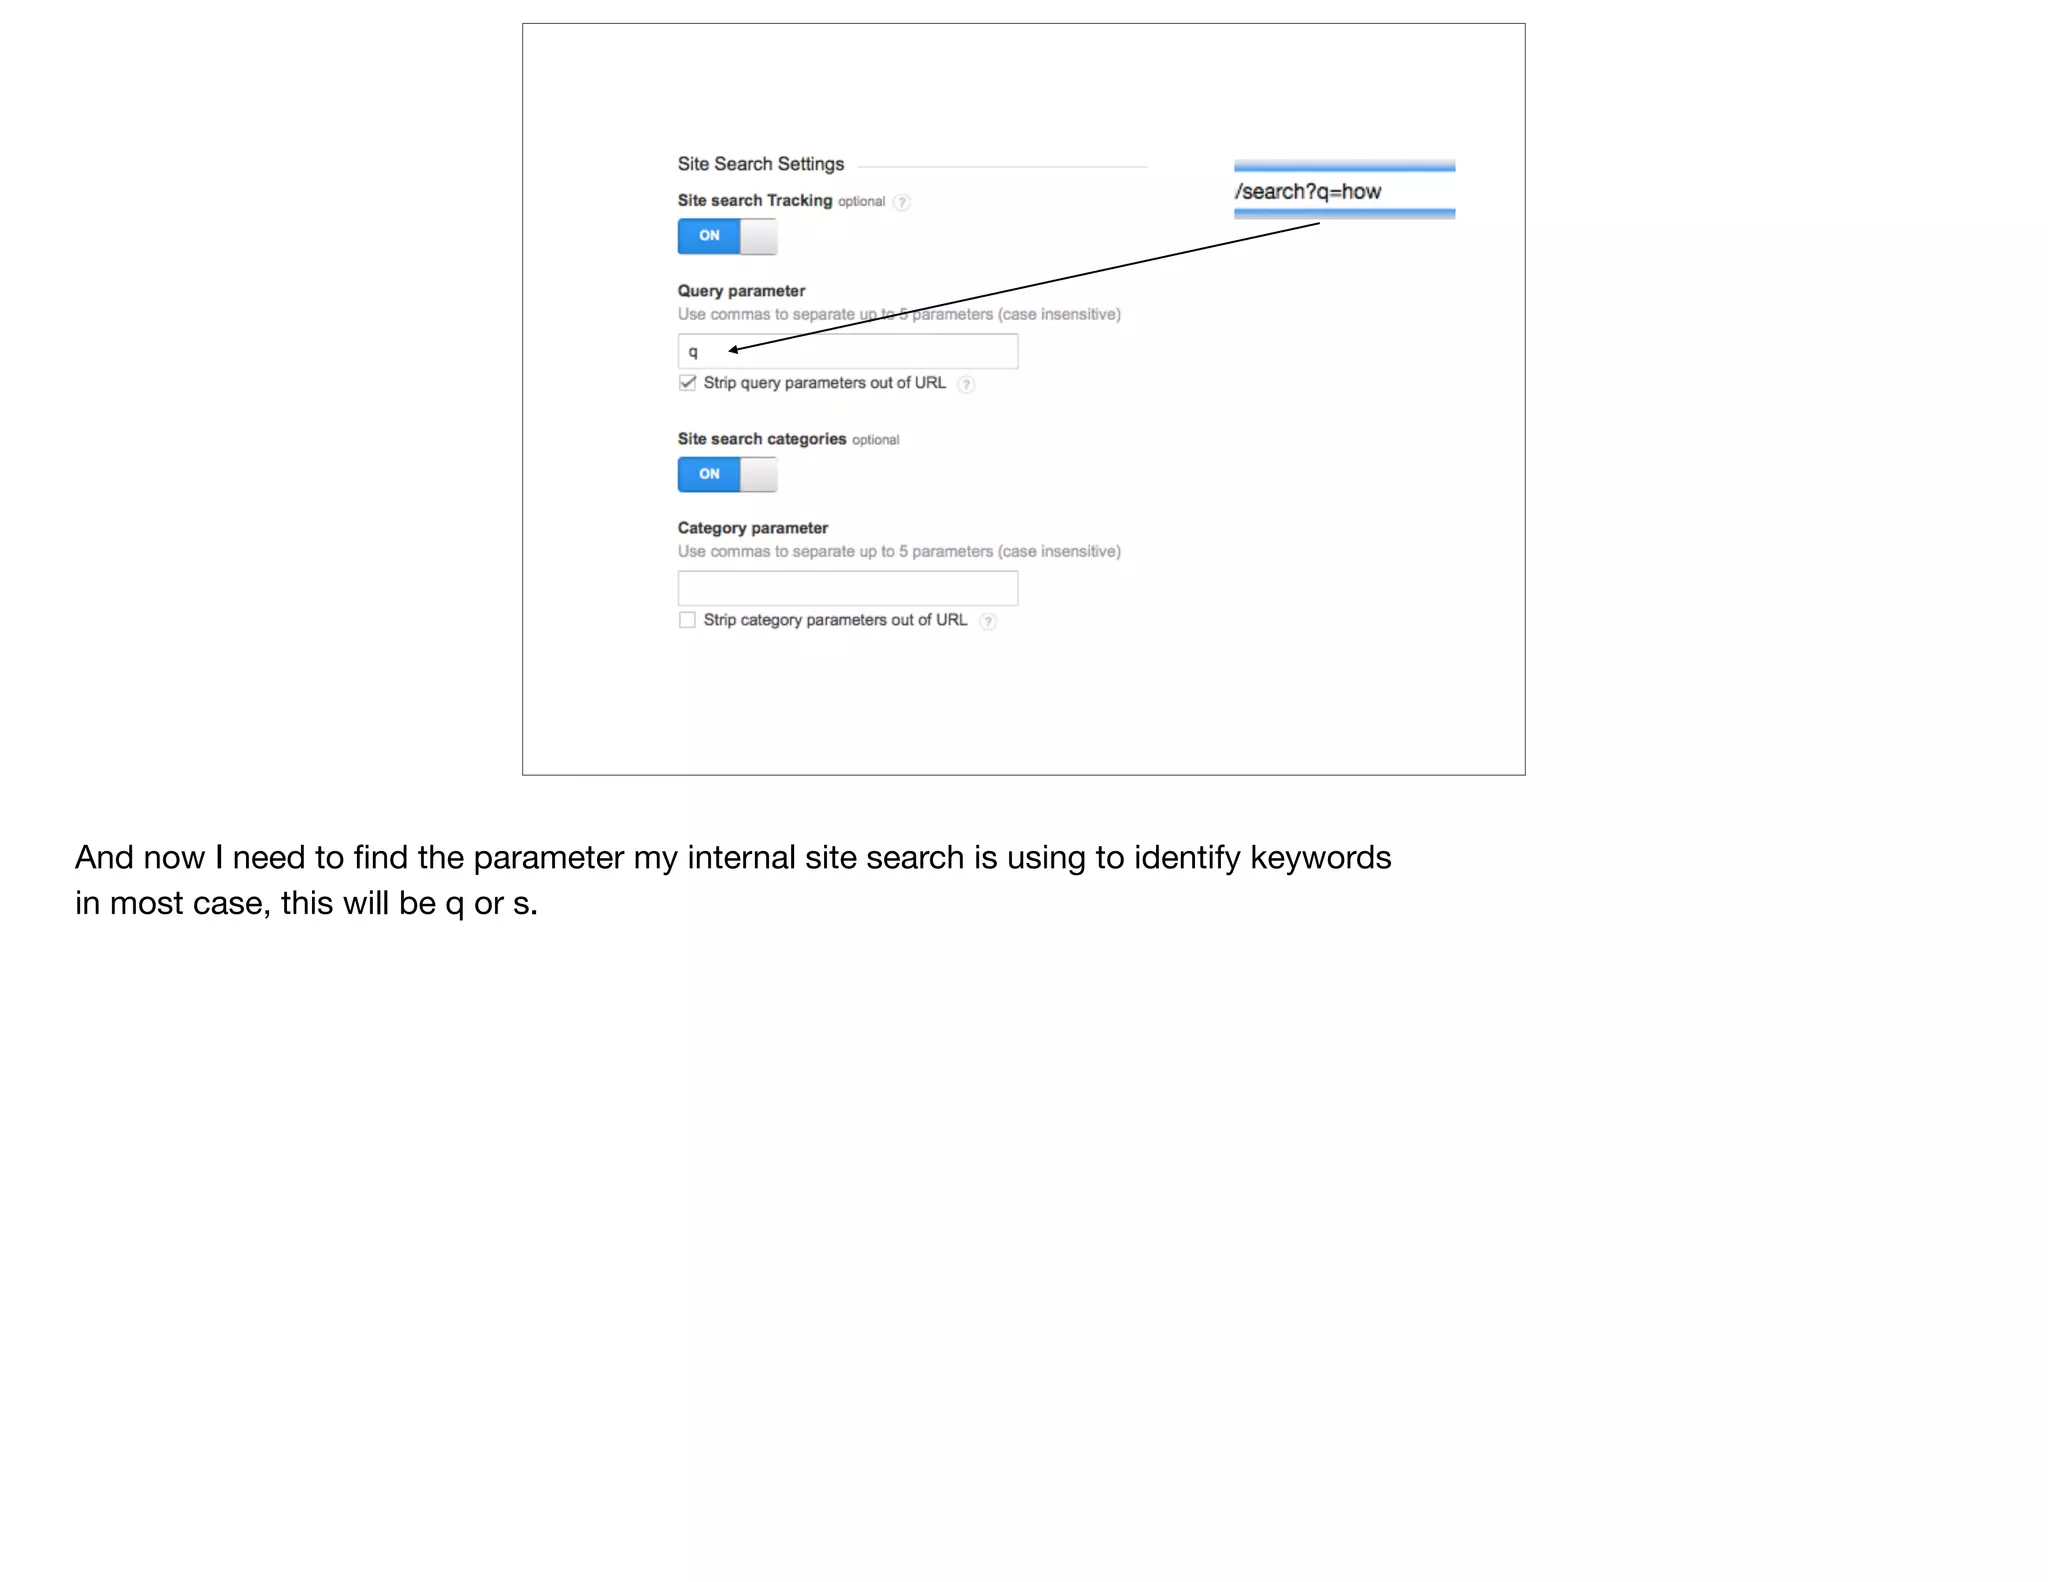
![@devonvsmith
What are they
looking for
right [here]?
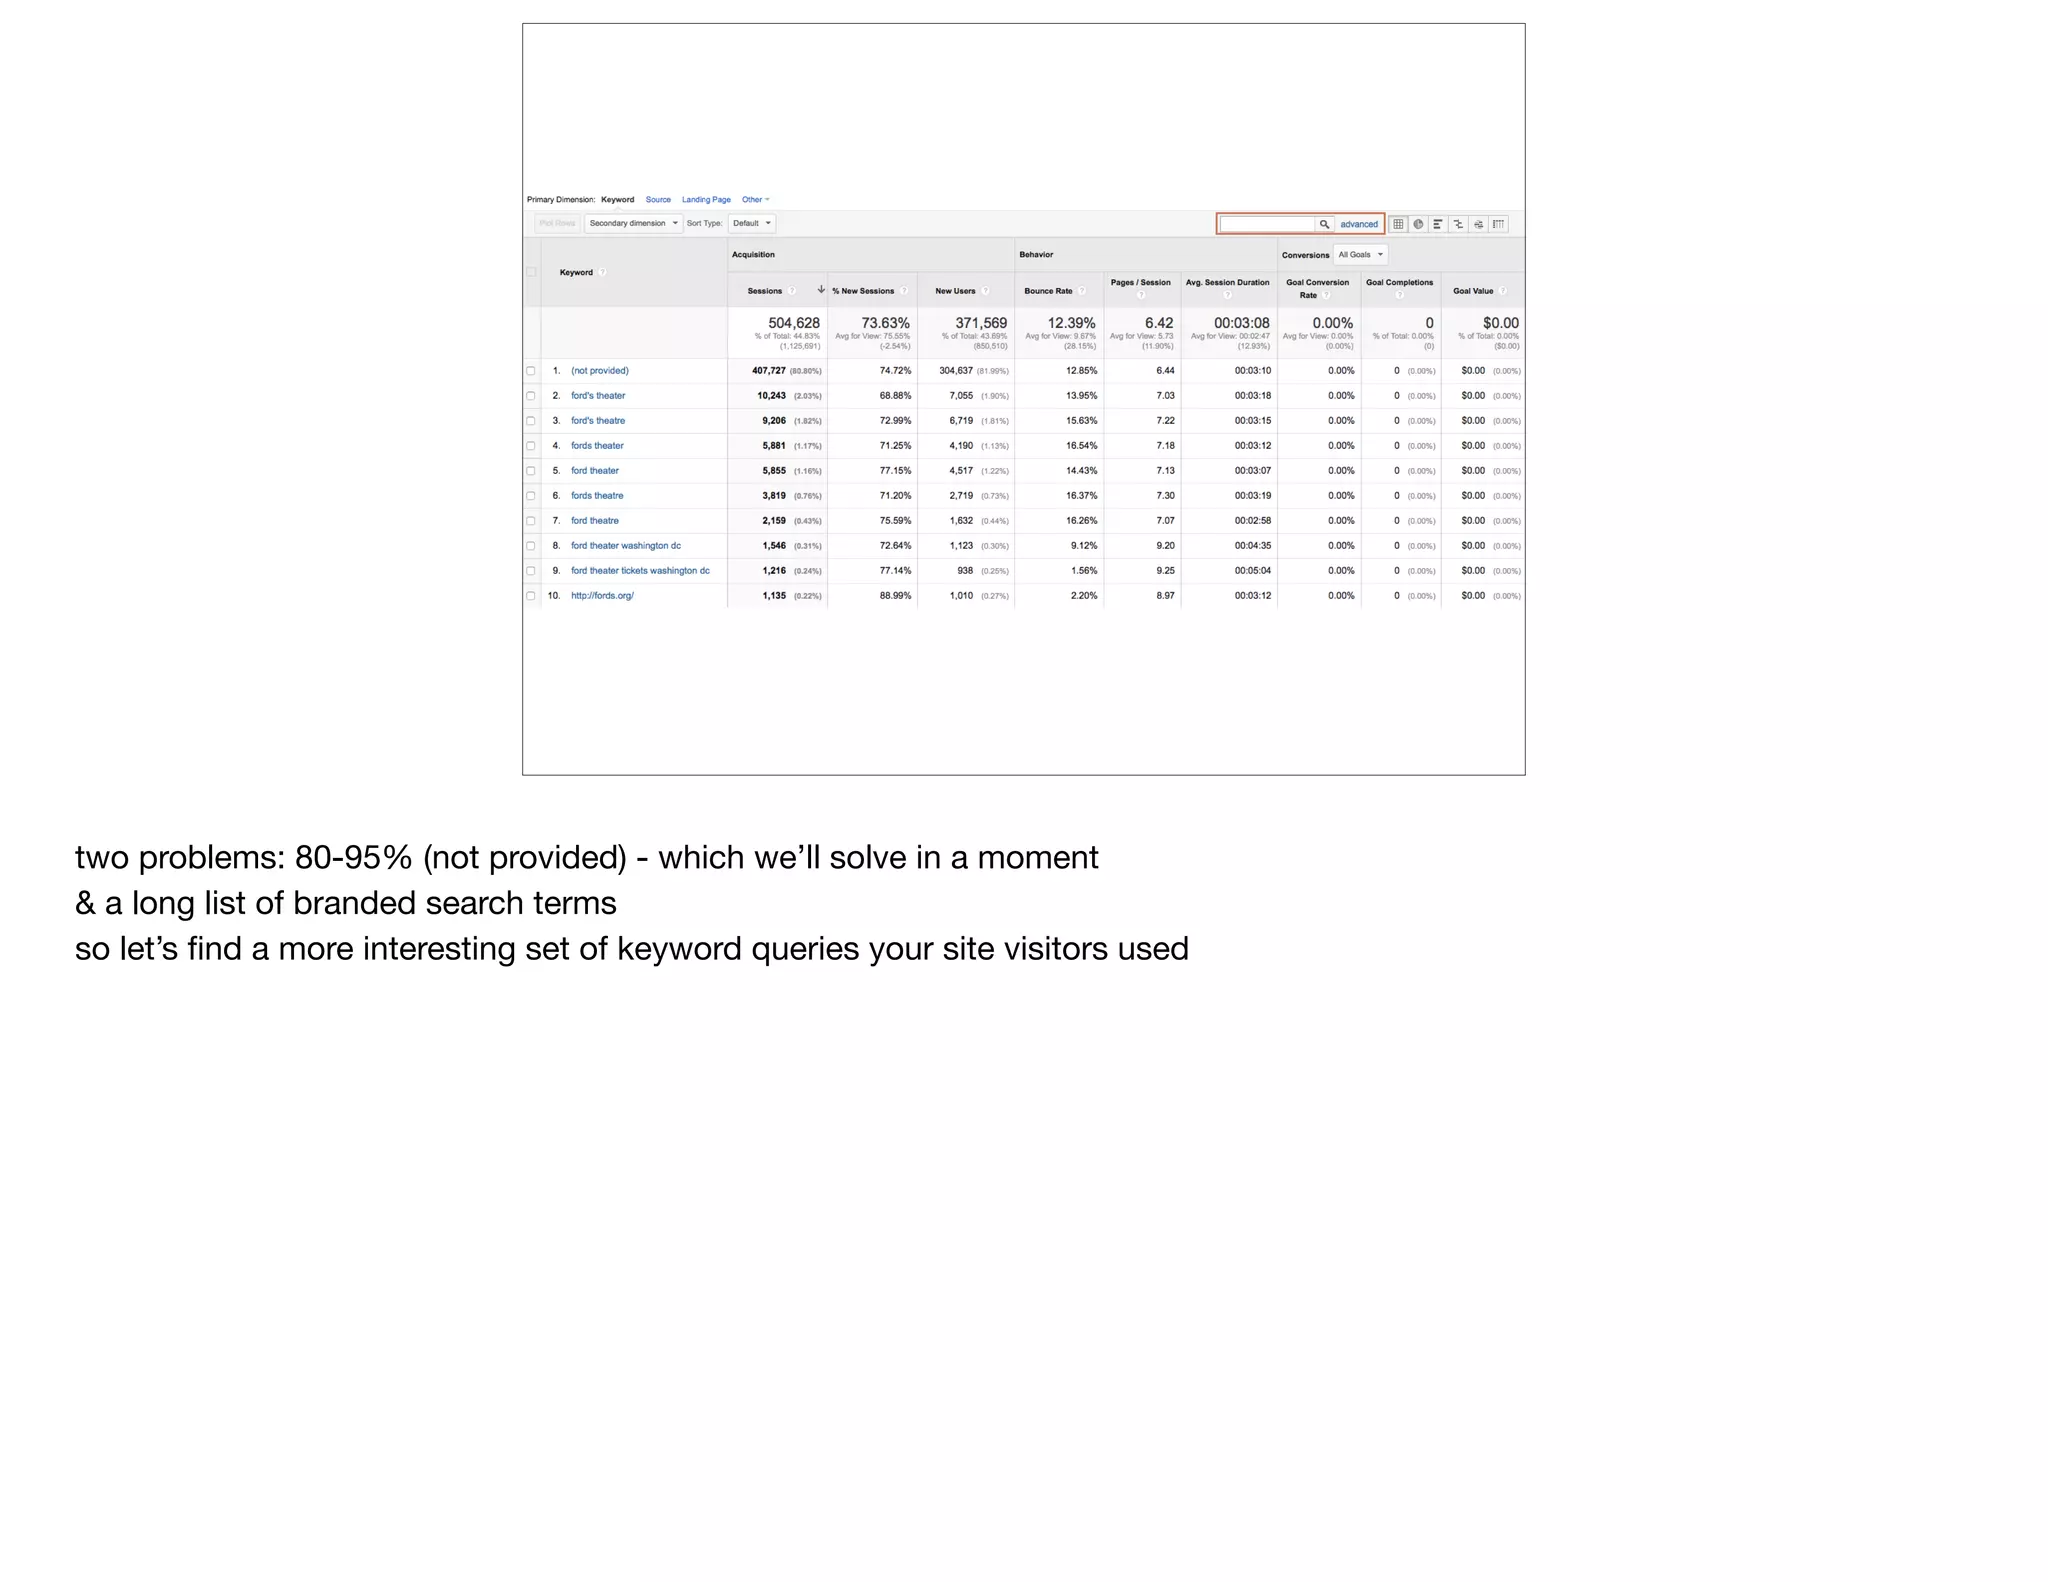
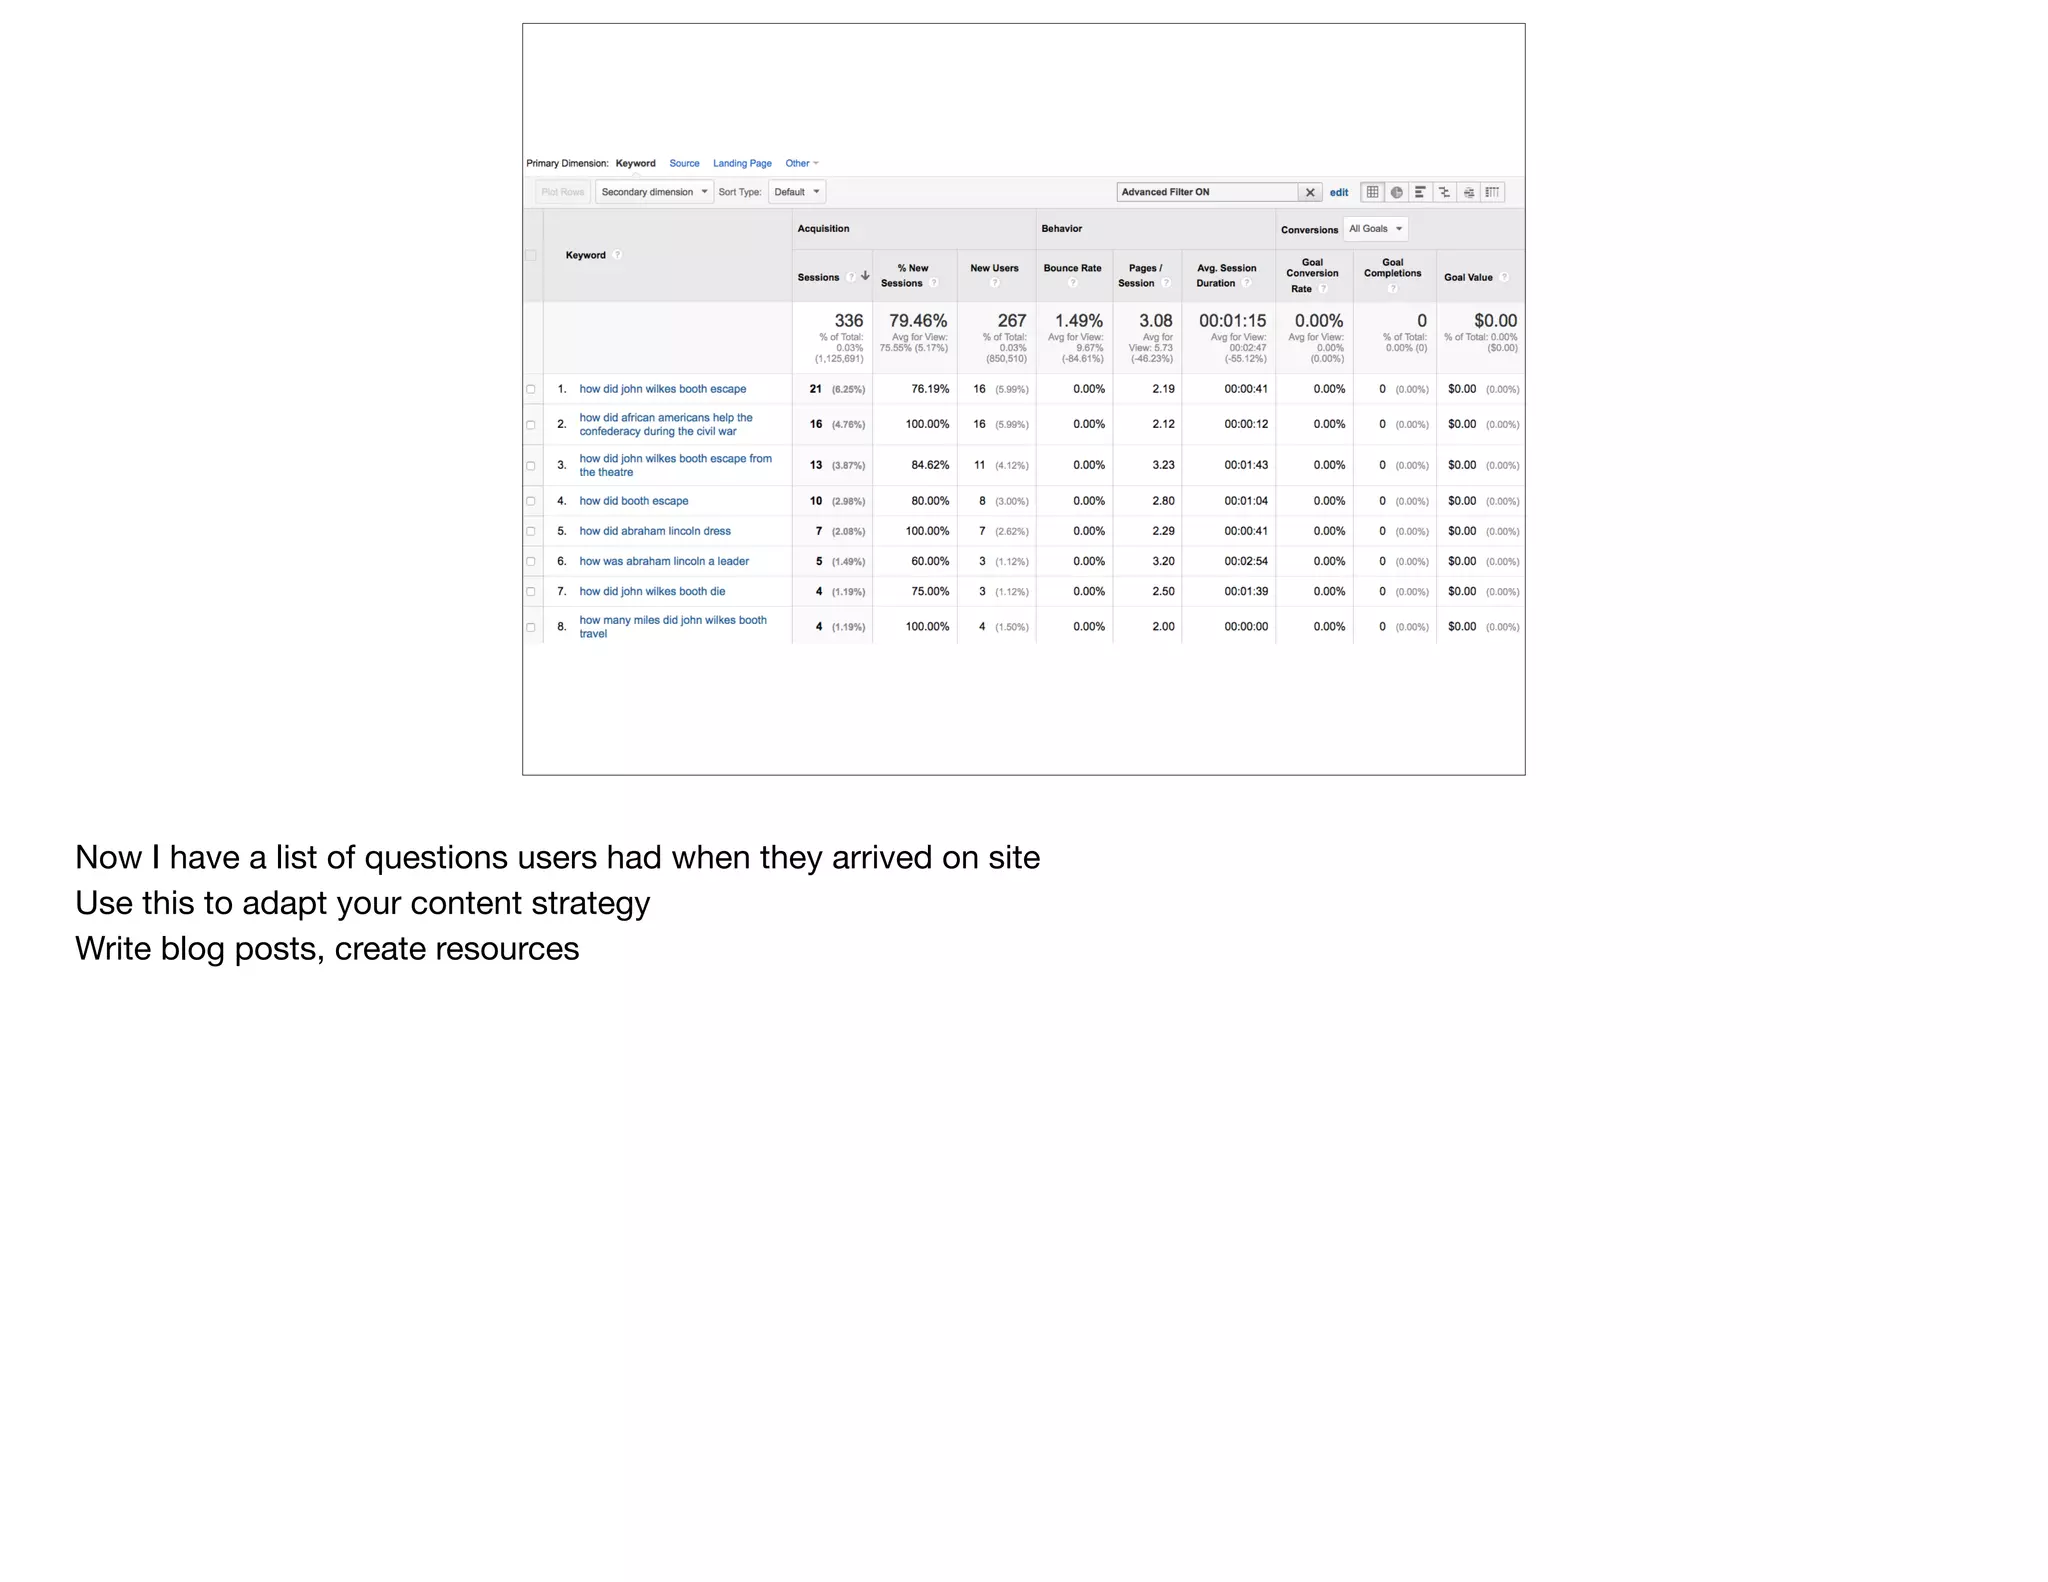
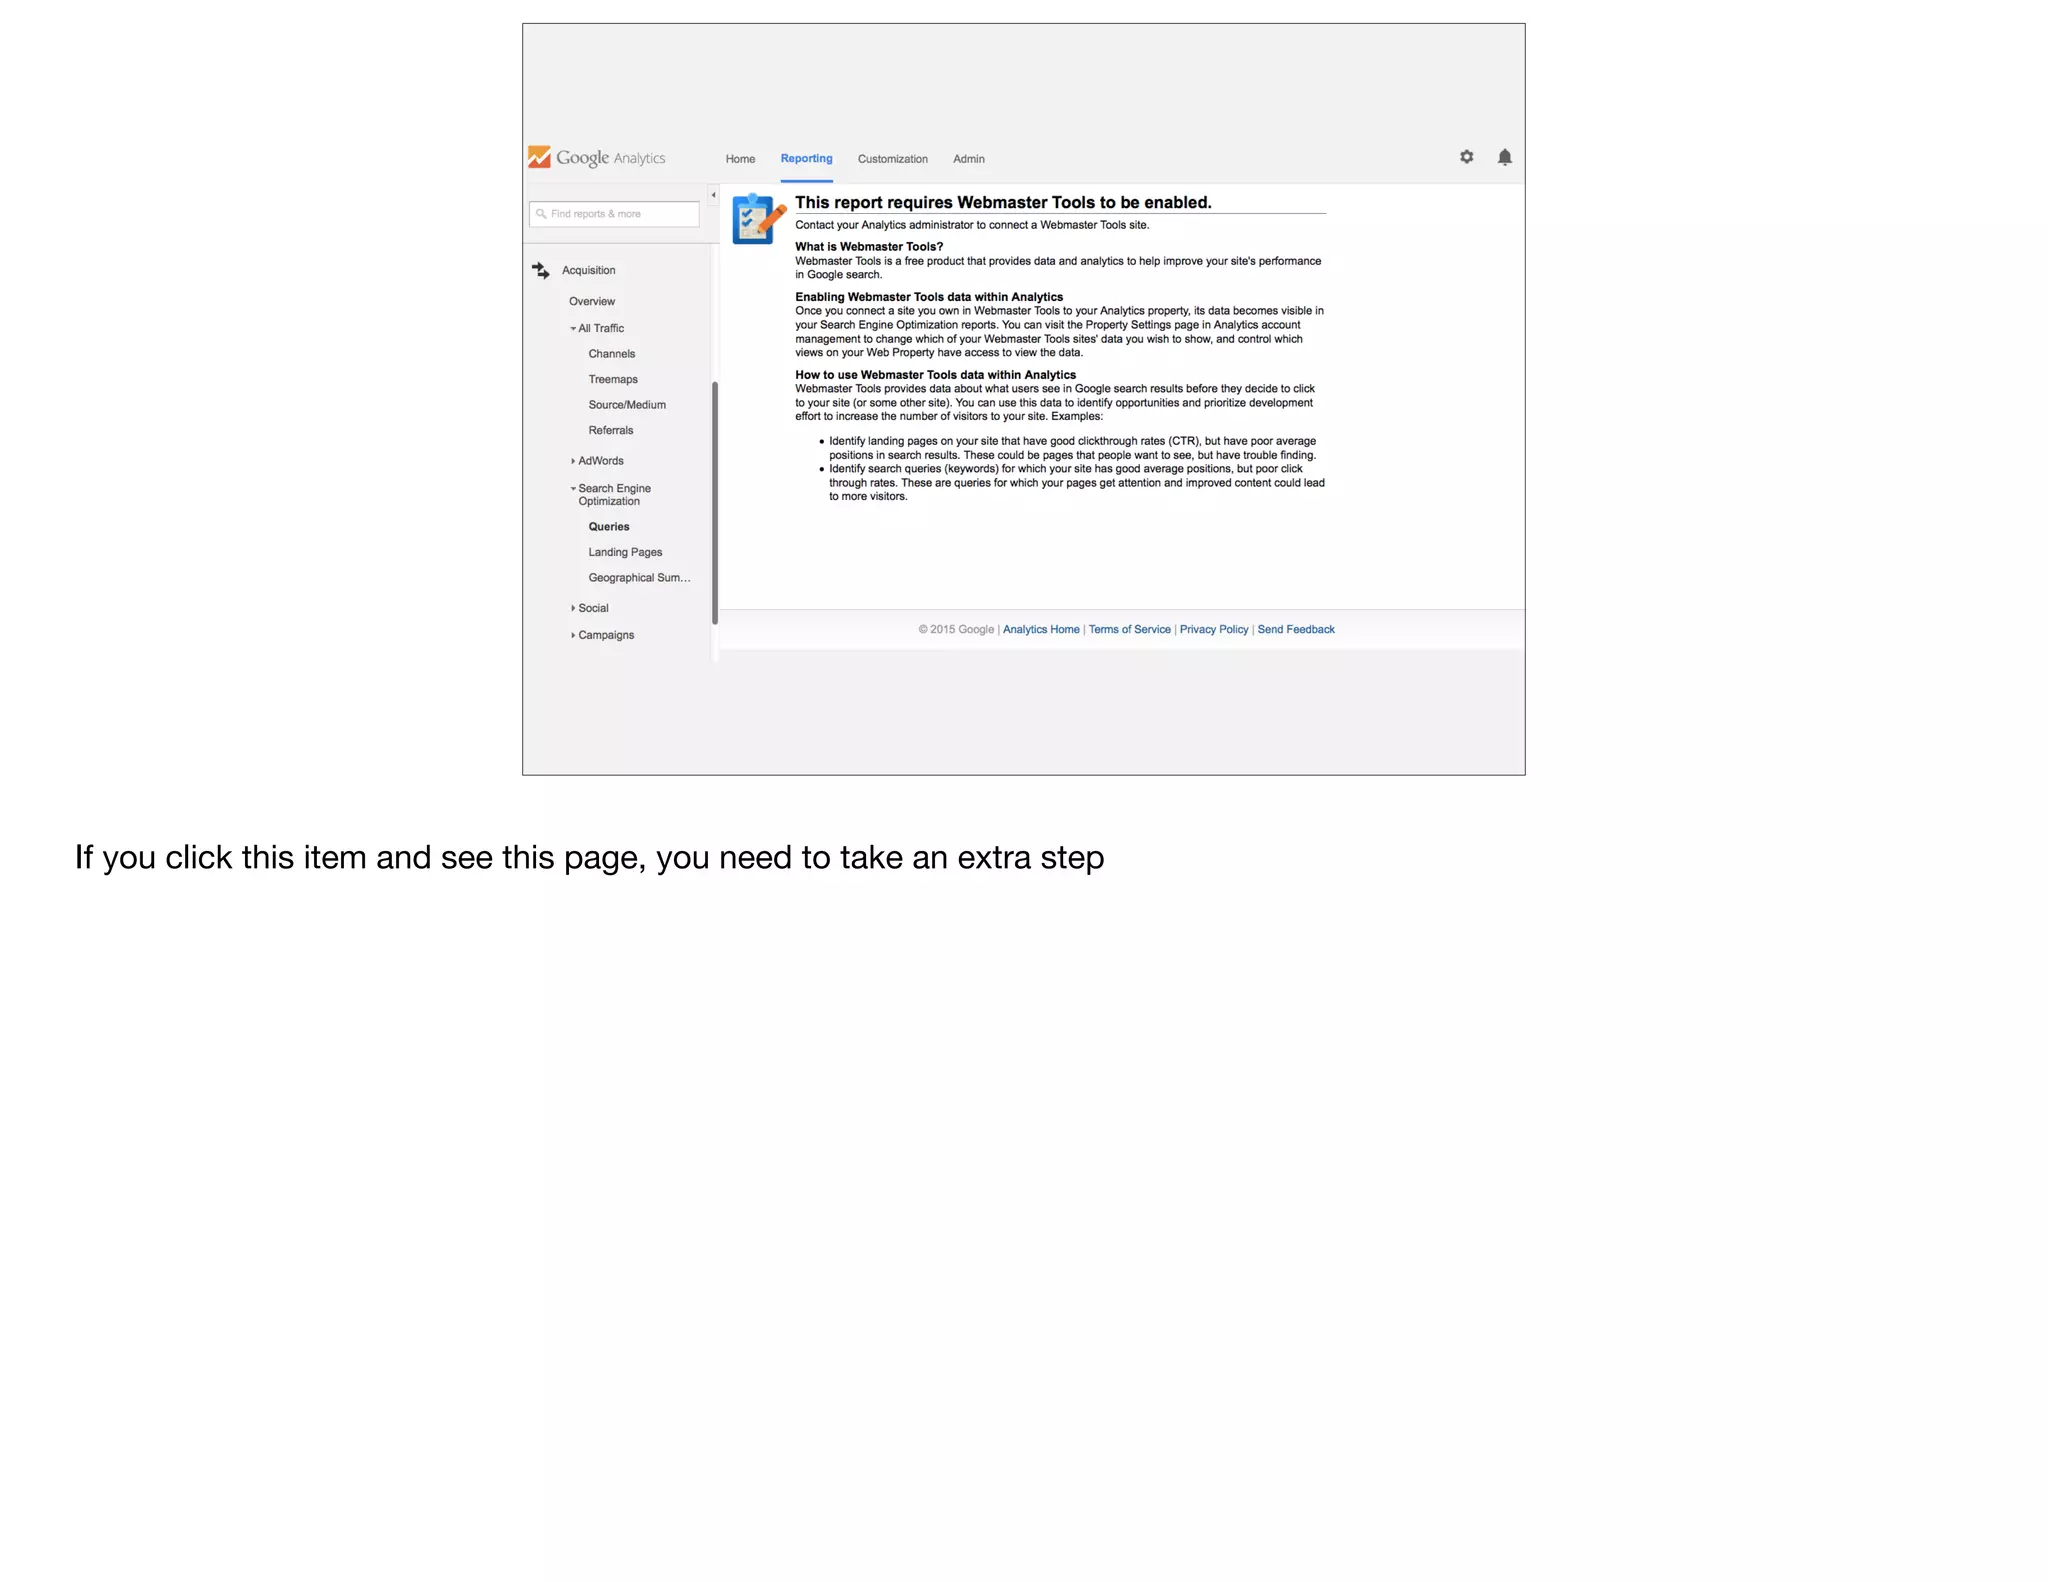
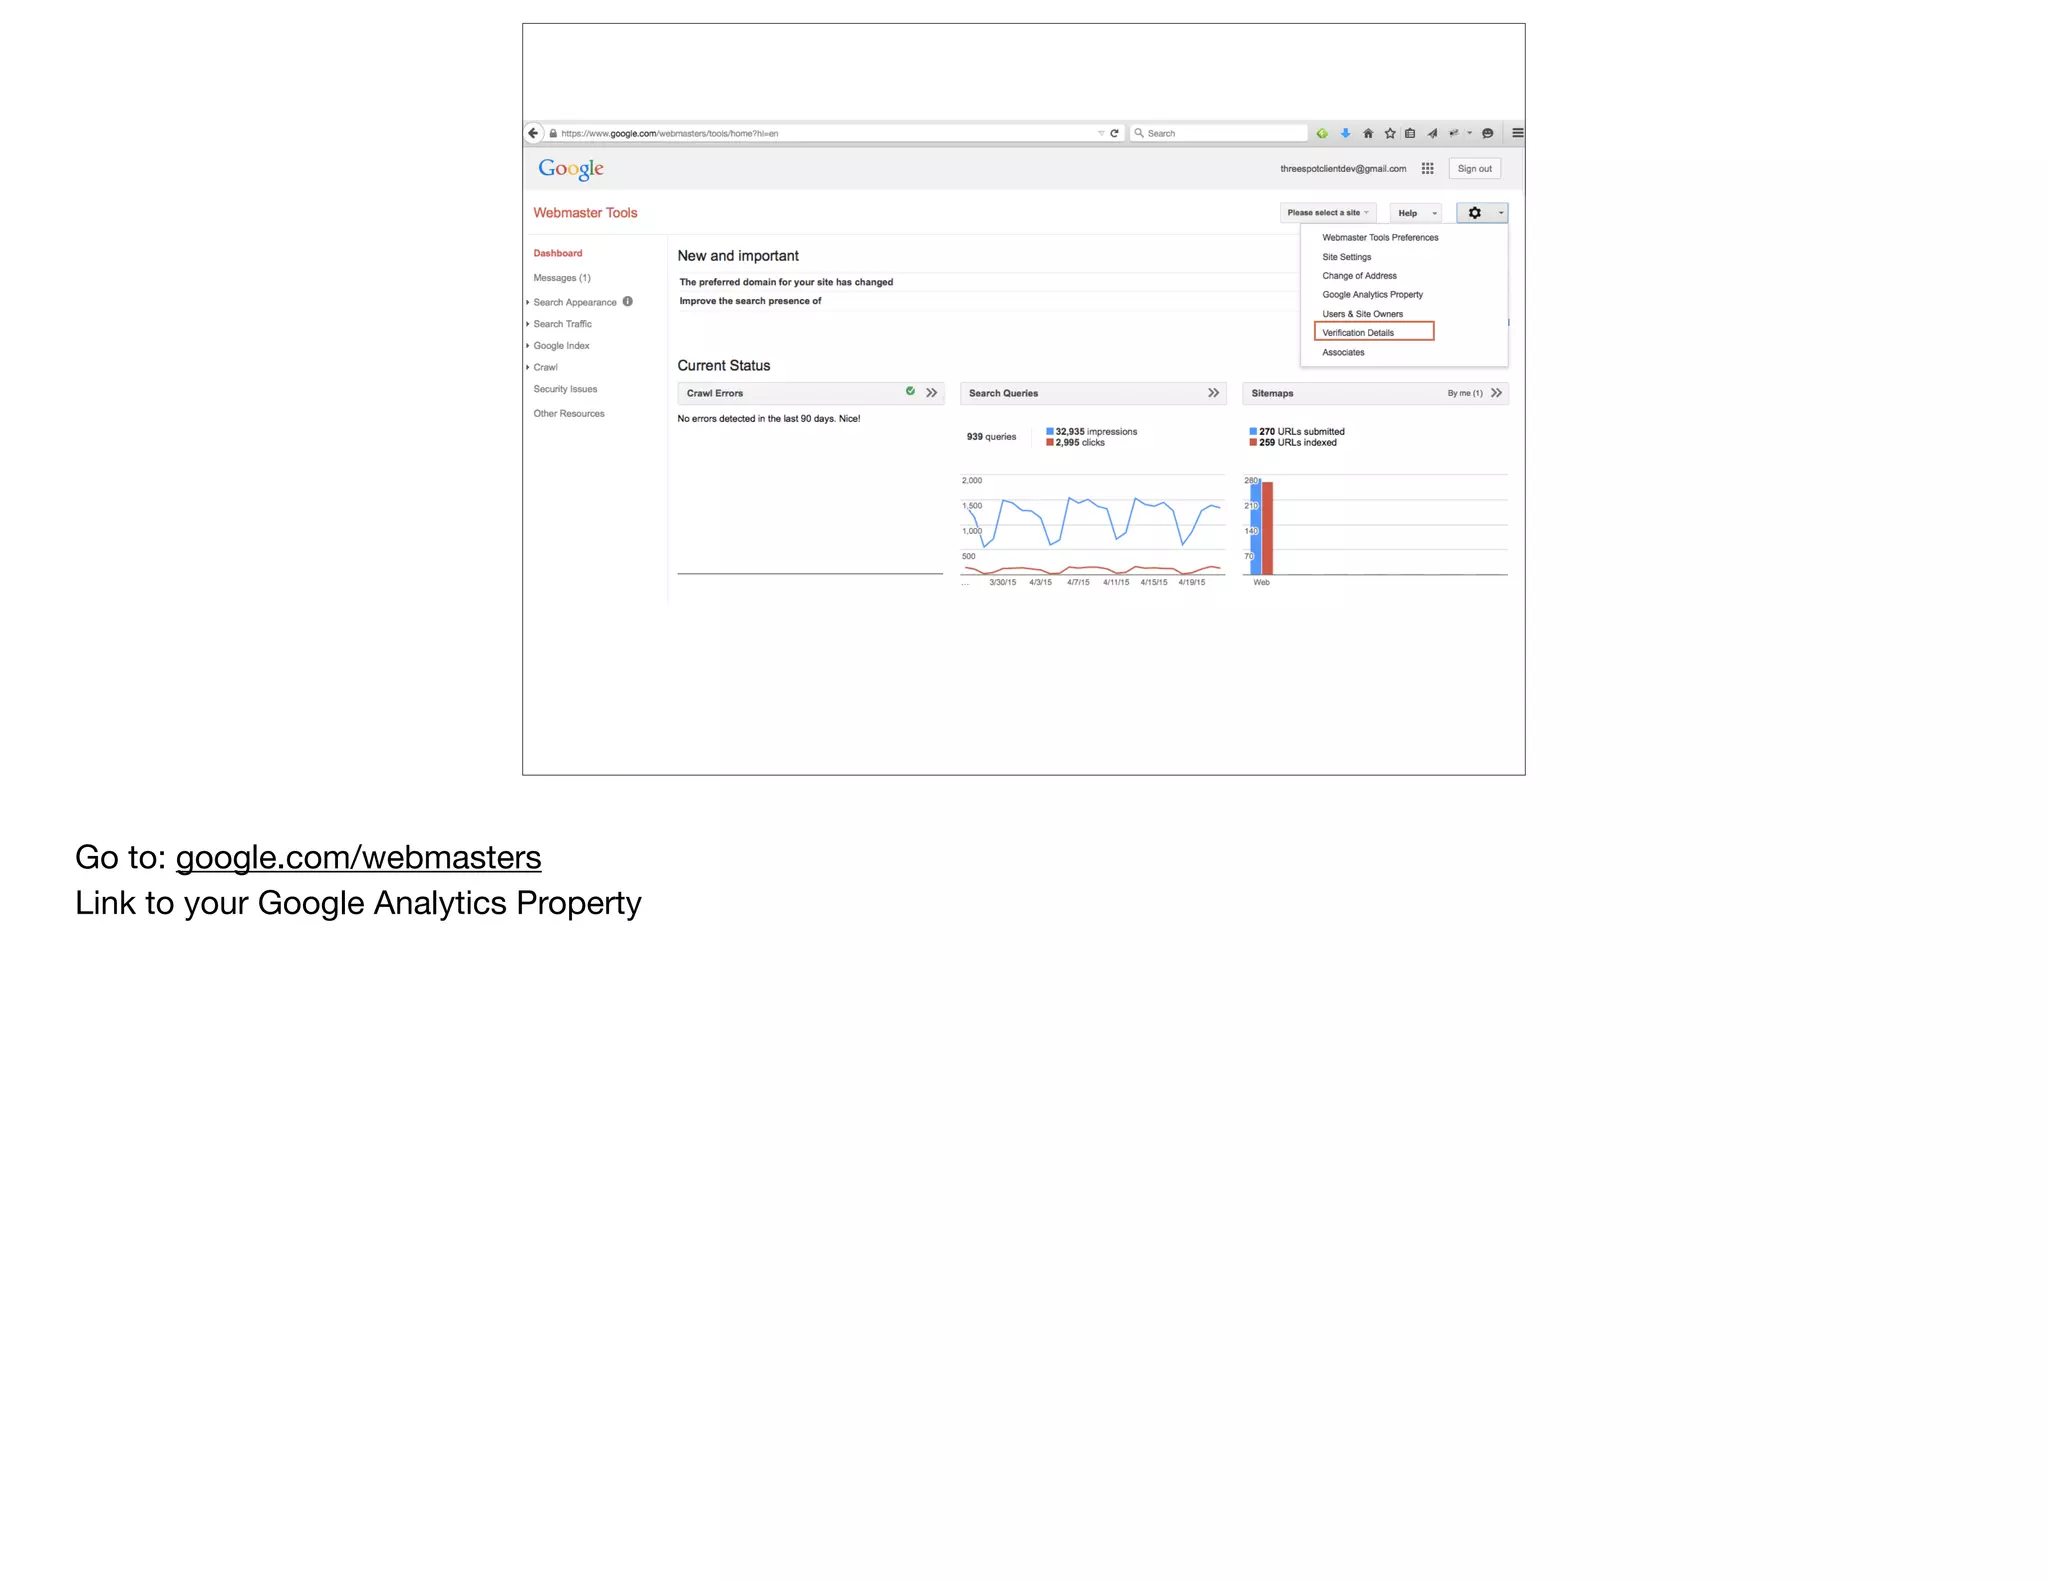
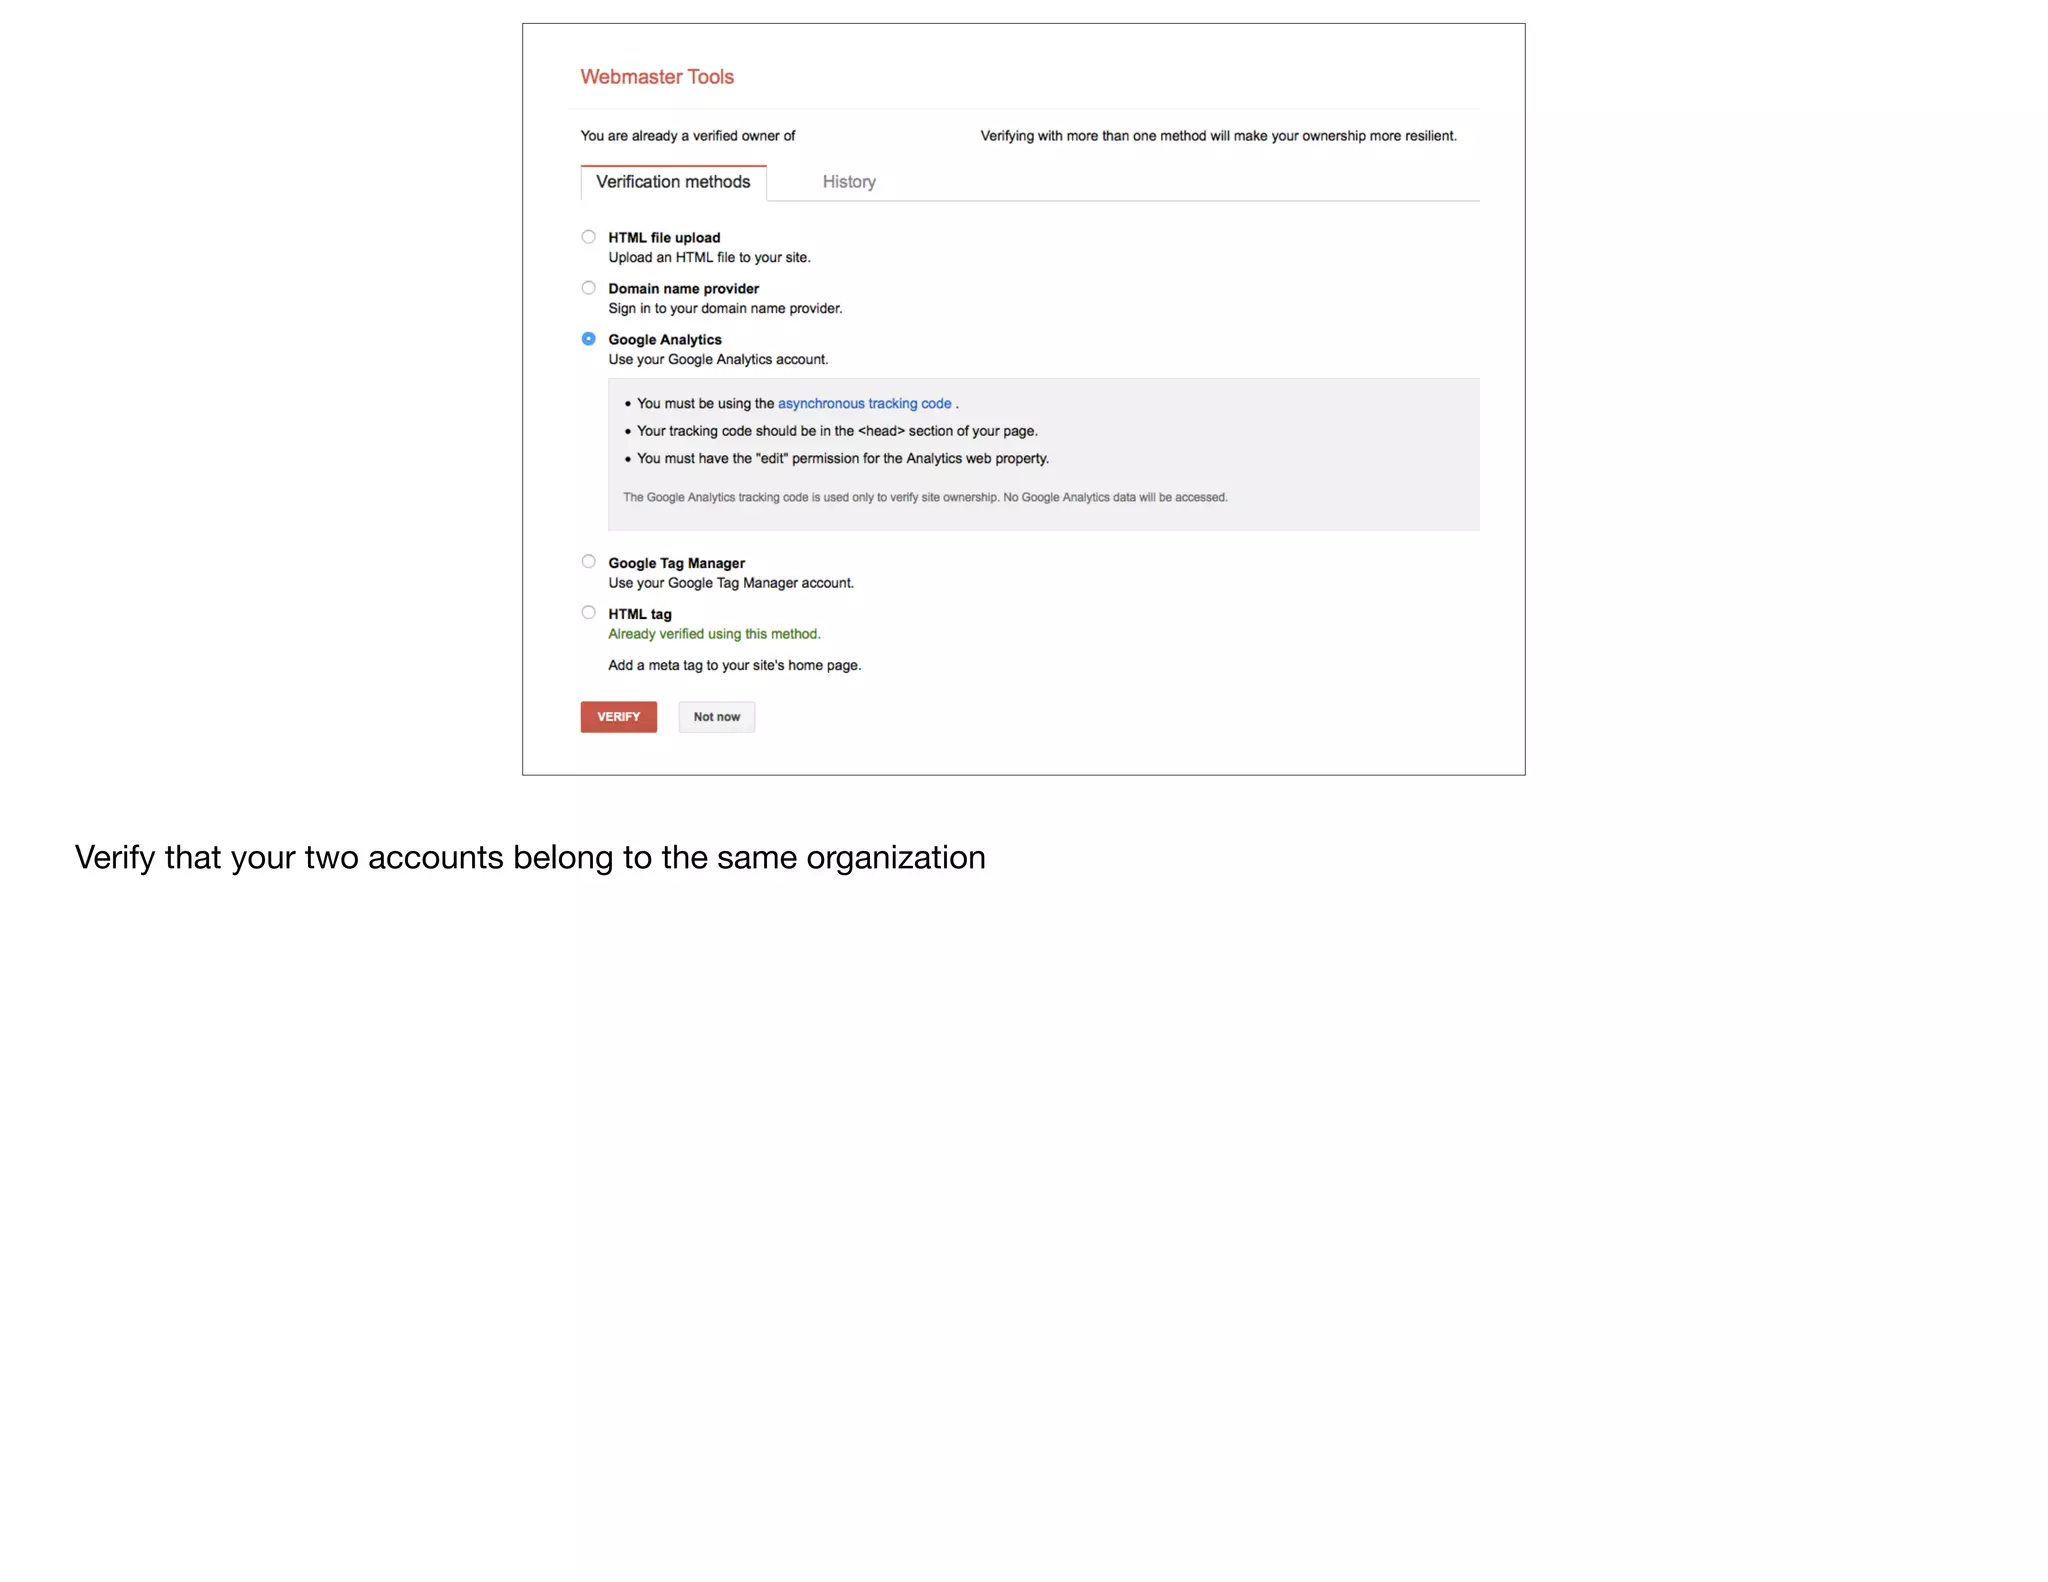
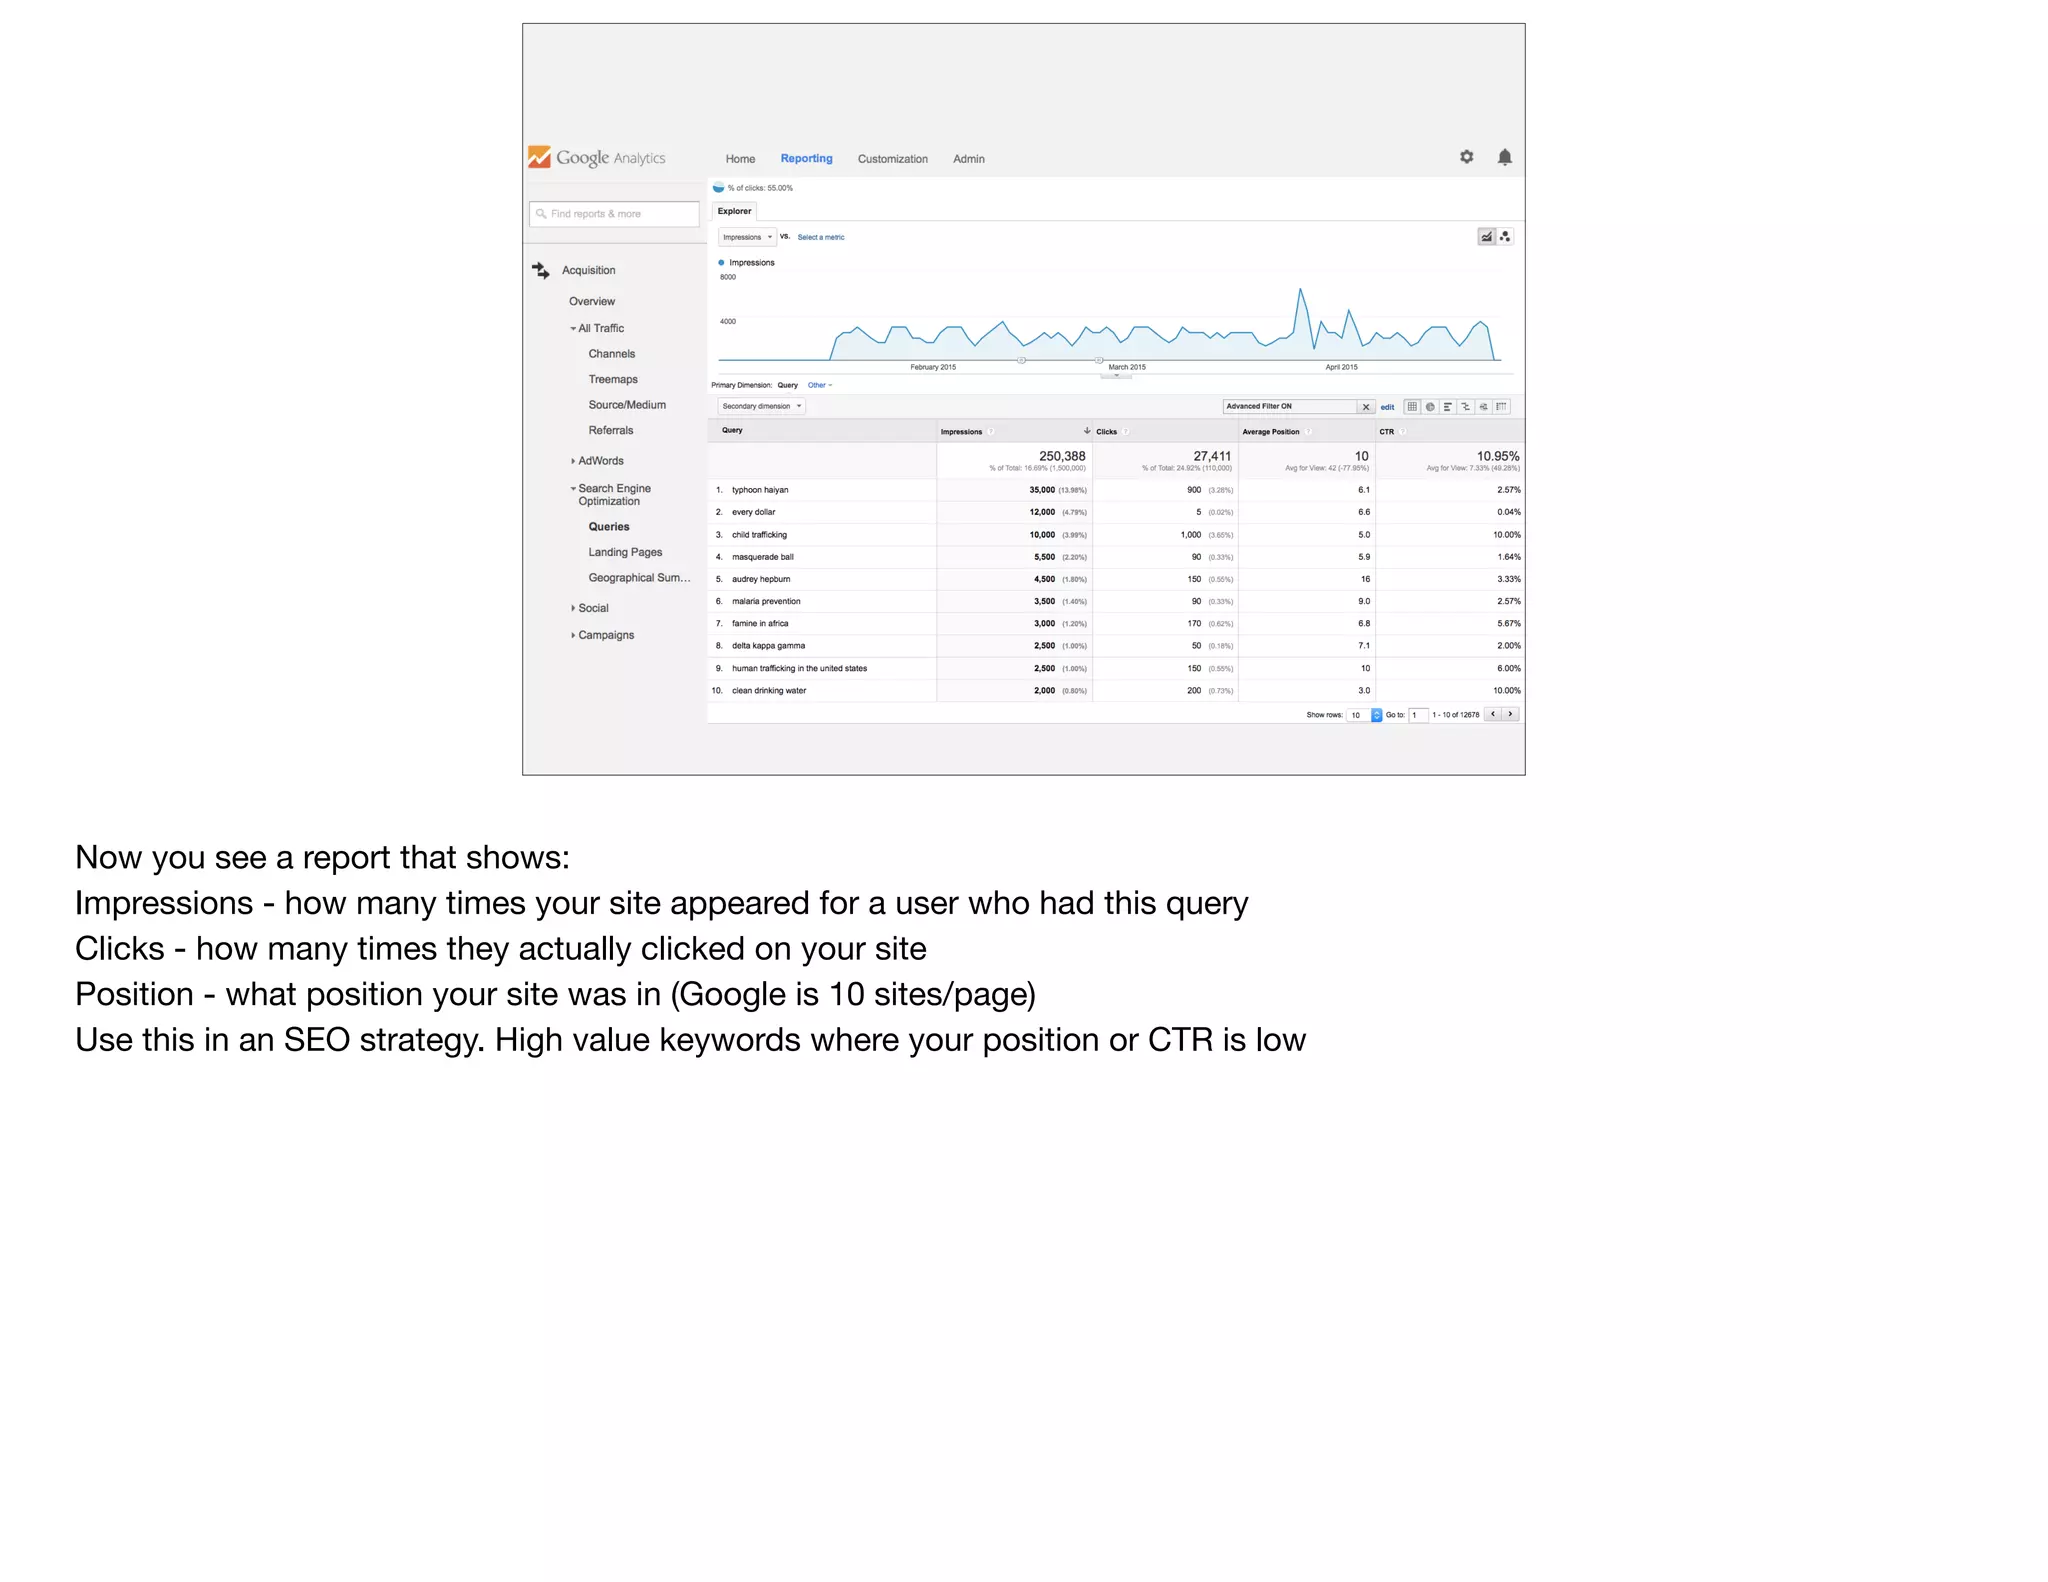
That was all about keyword queries visitors use in an external search engine to FIND your site
But once they get to your site, they often still can’t find what they’re looking for
Again, let’s focus on a single page](https://image.slidesharecdn.com/dogooddatahiddensecretsofgoogleanalytics-150430155241-conversion-gate01/75/Hidden-Secrets-of-Google-Analytics-Do-Good-Data-2015-34-2048.jpg)
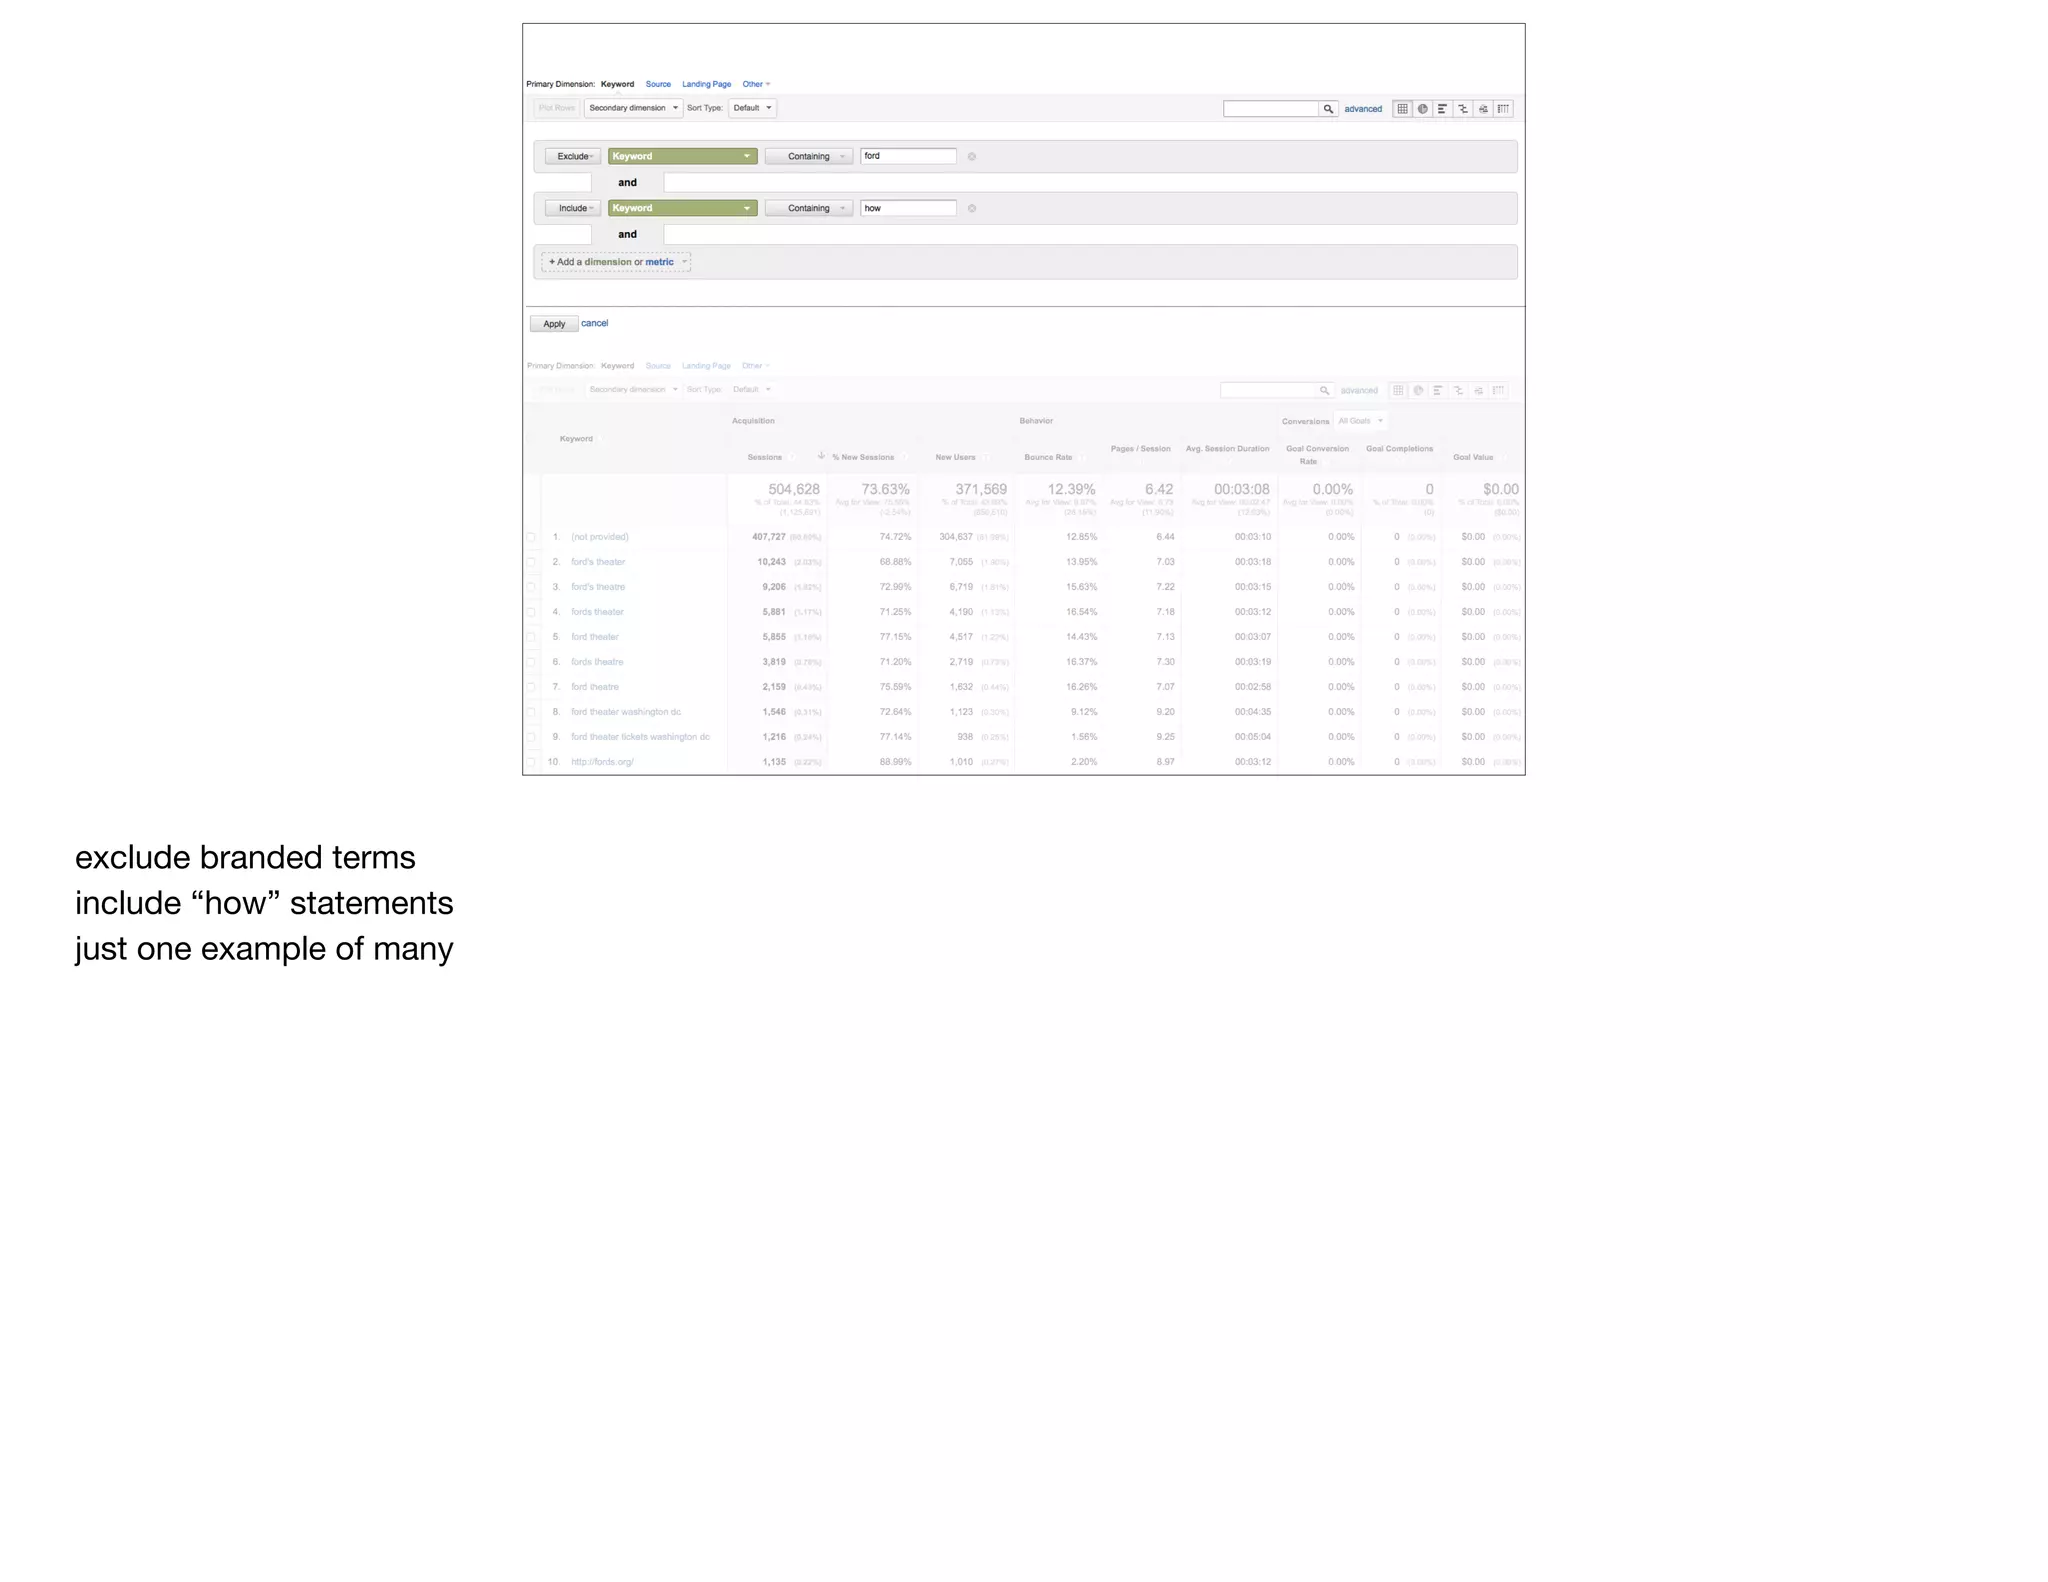
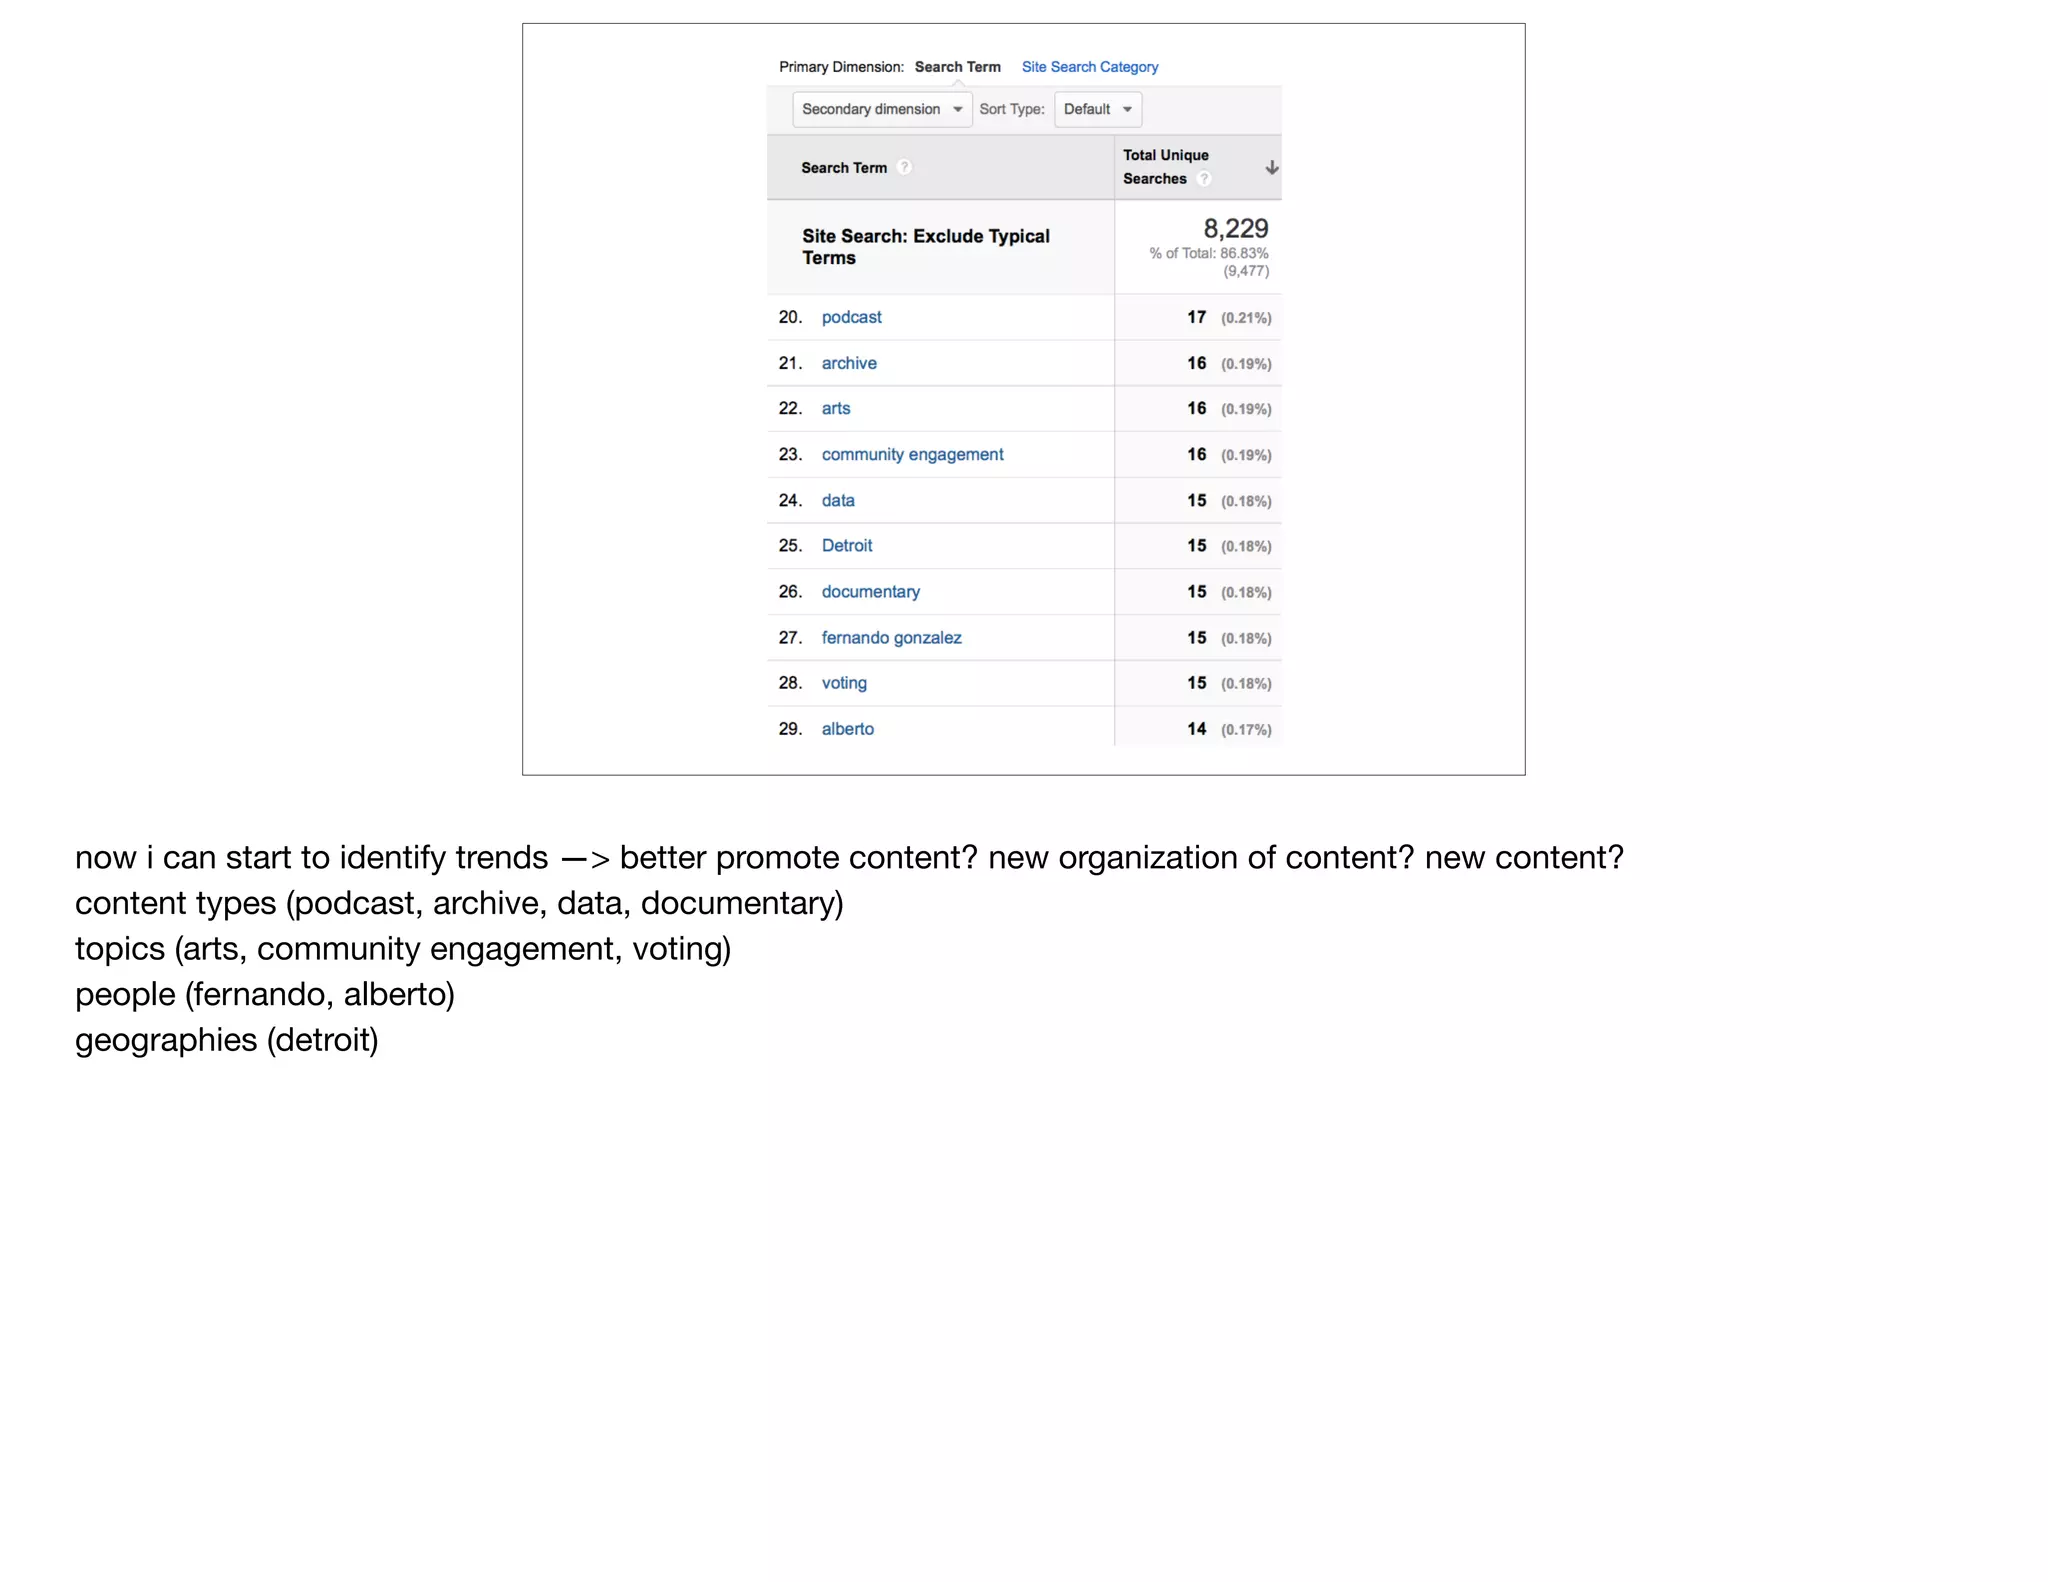
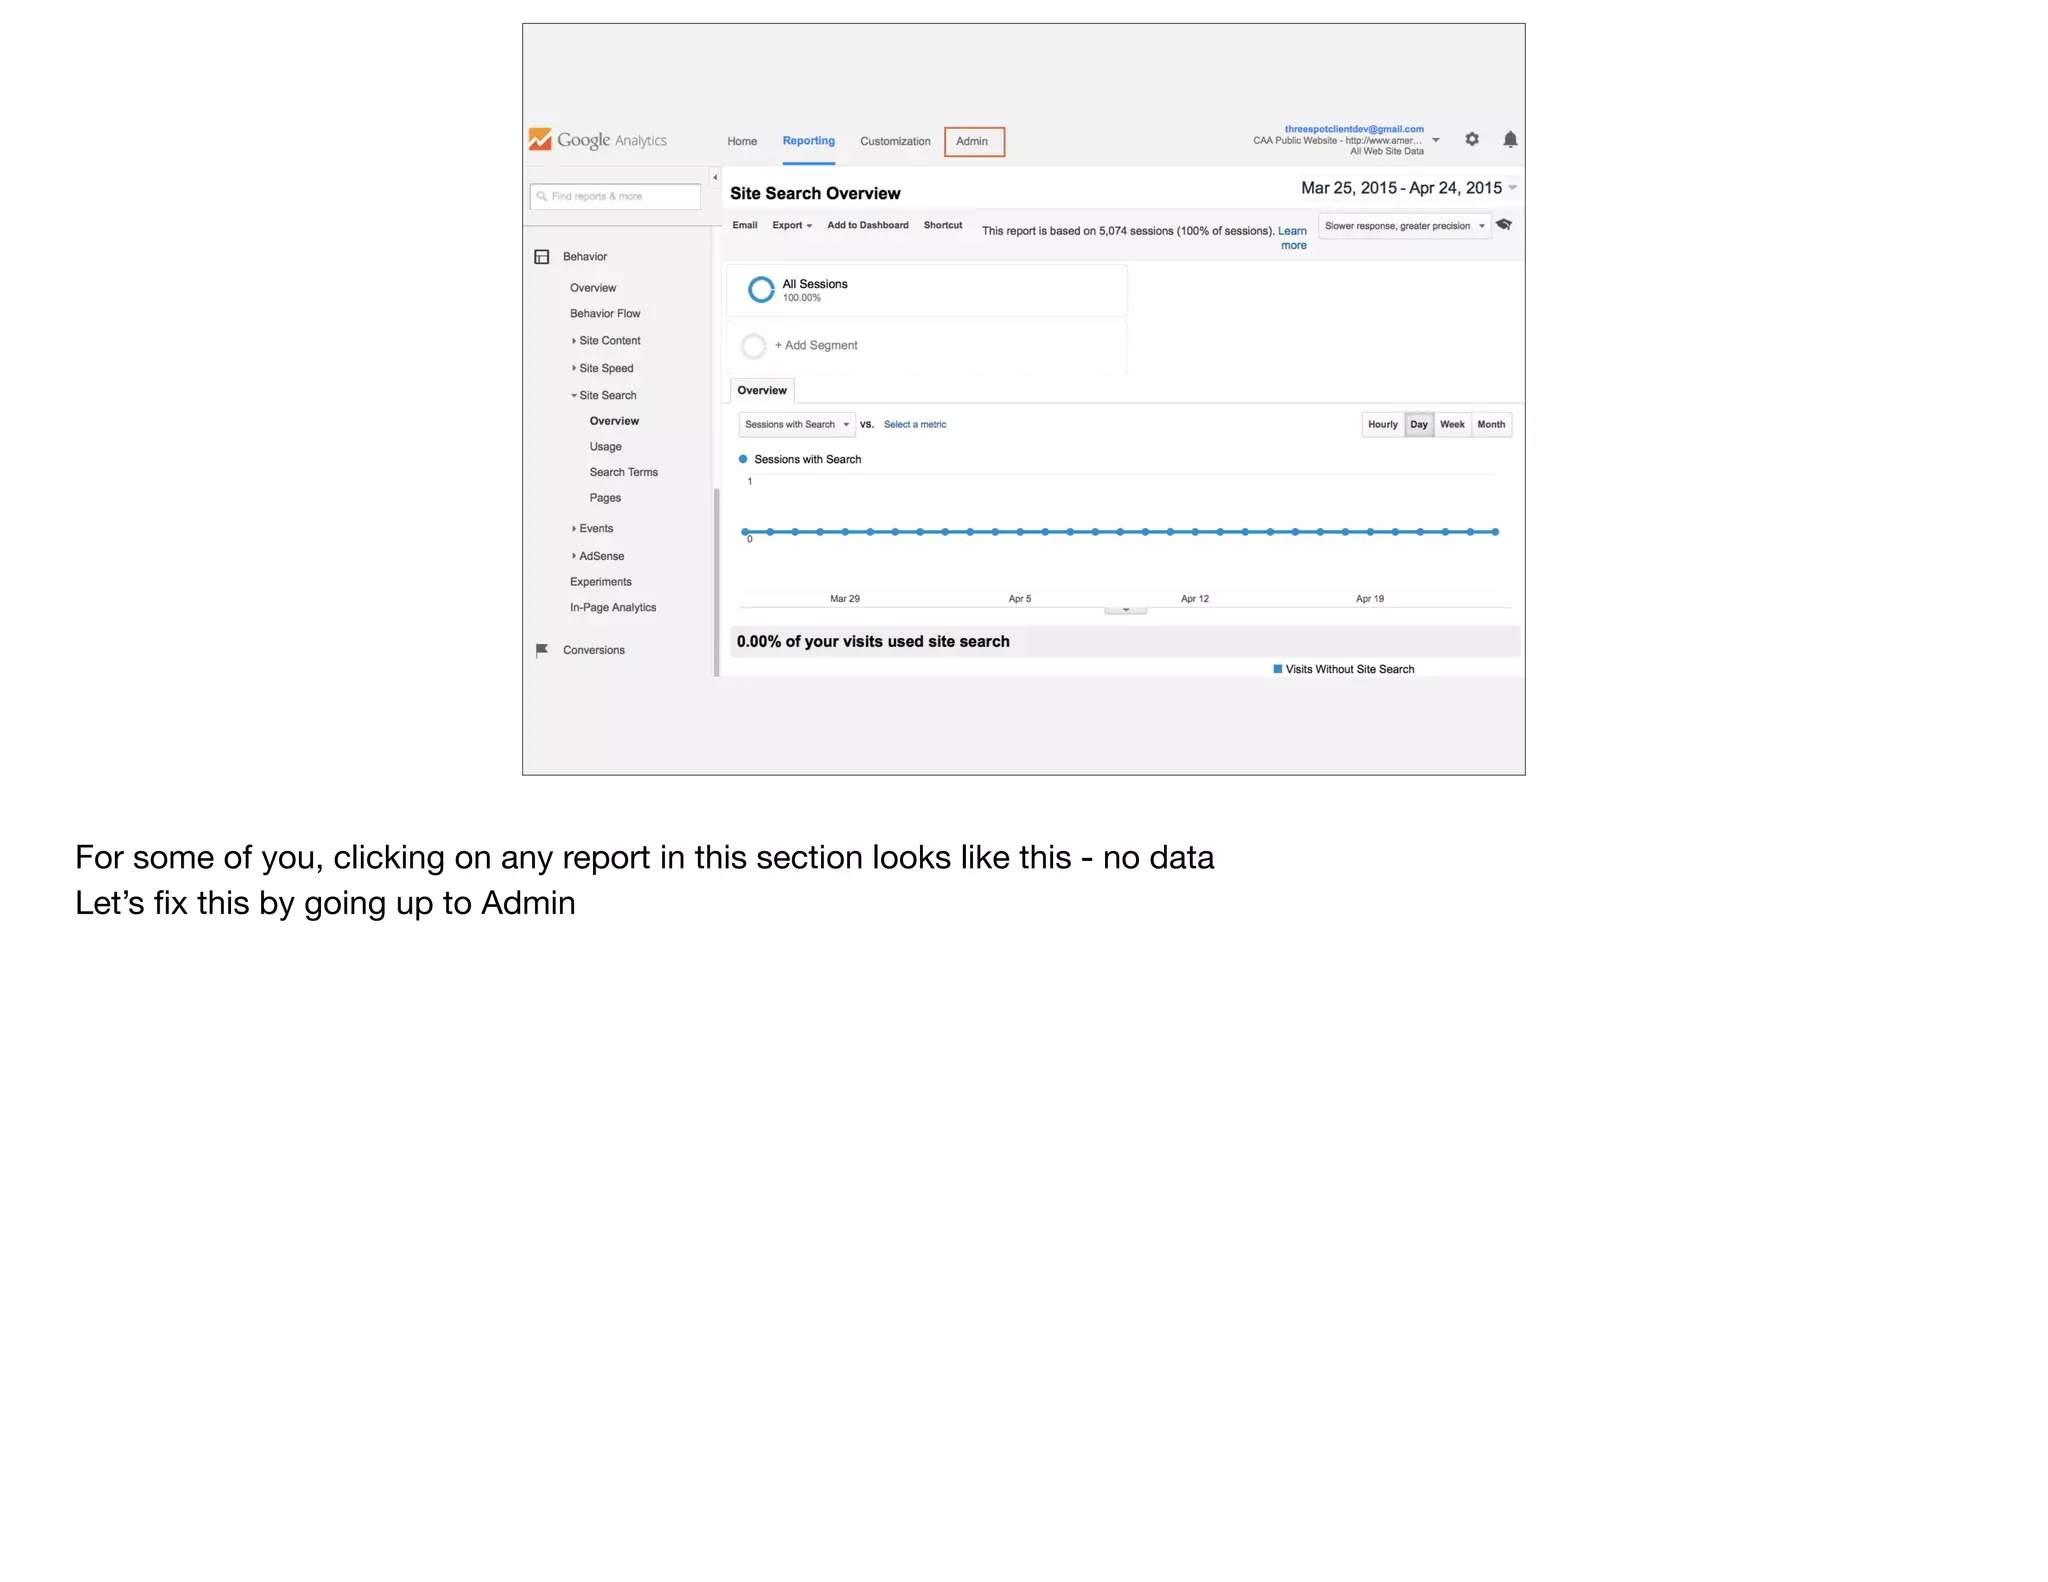
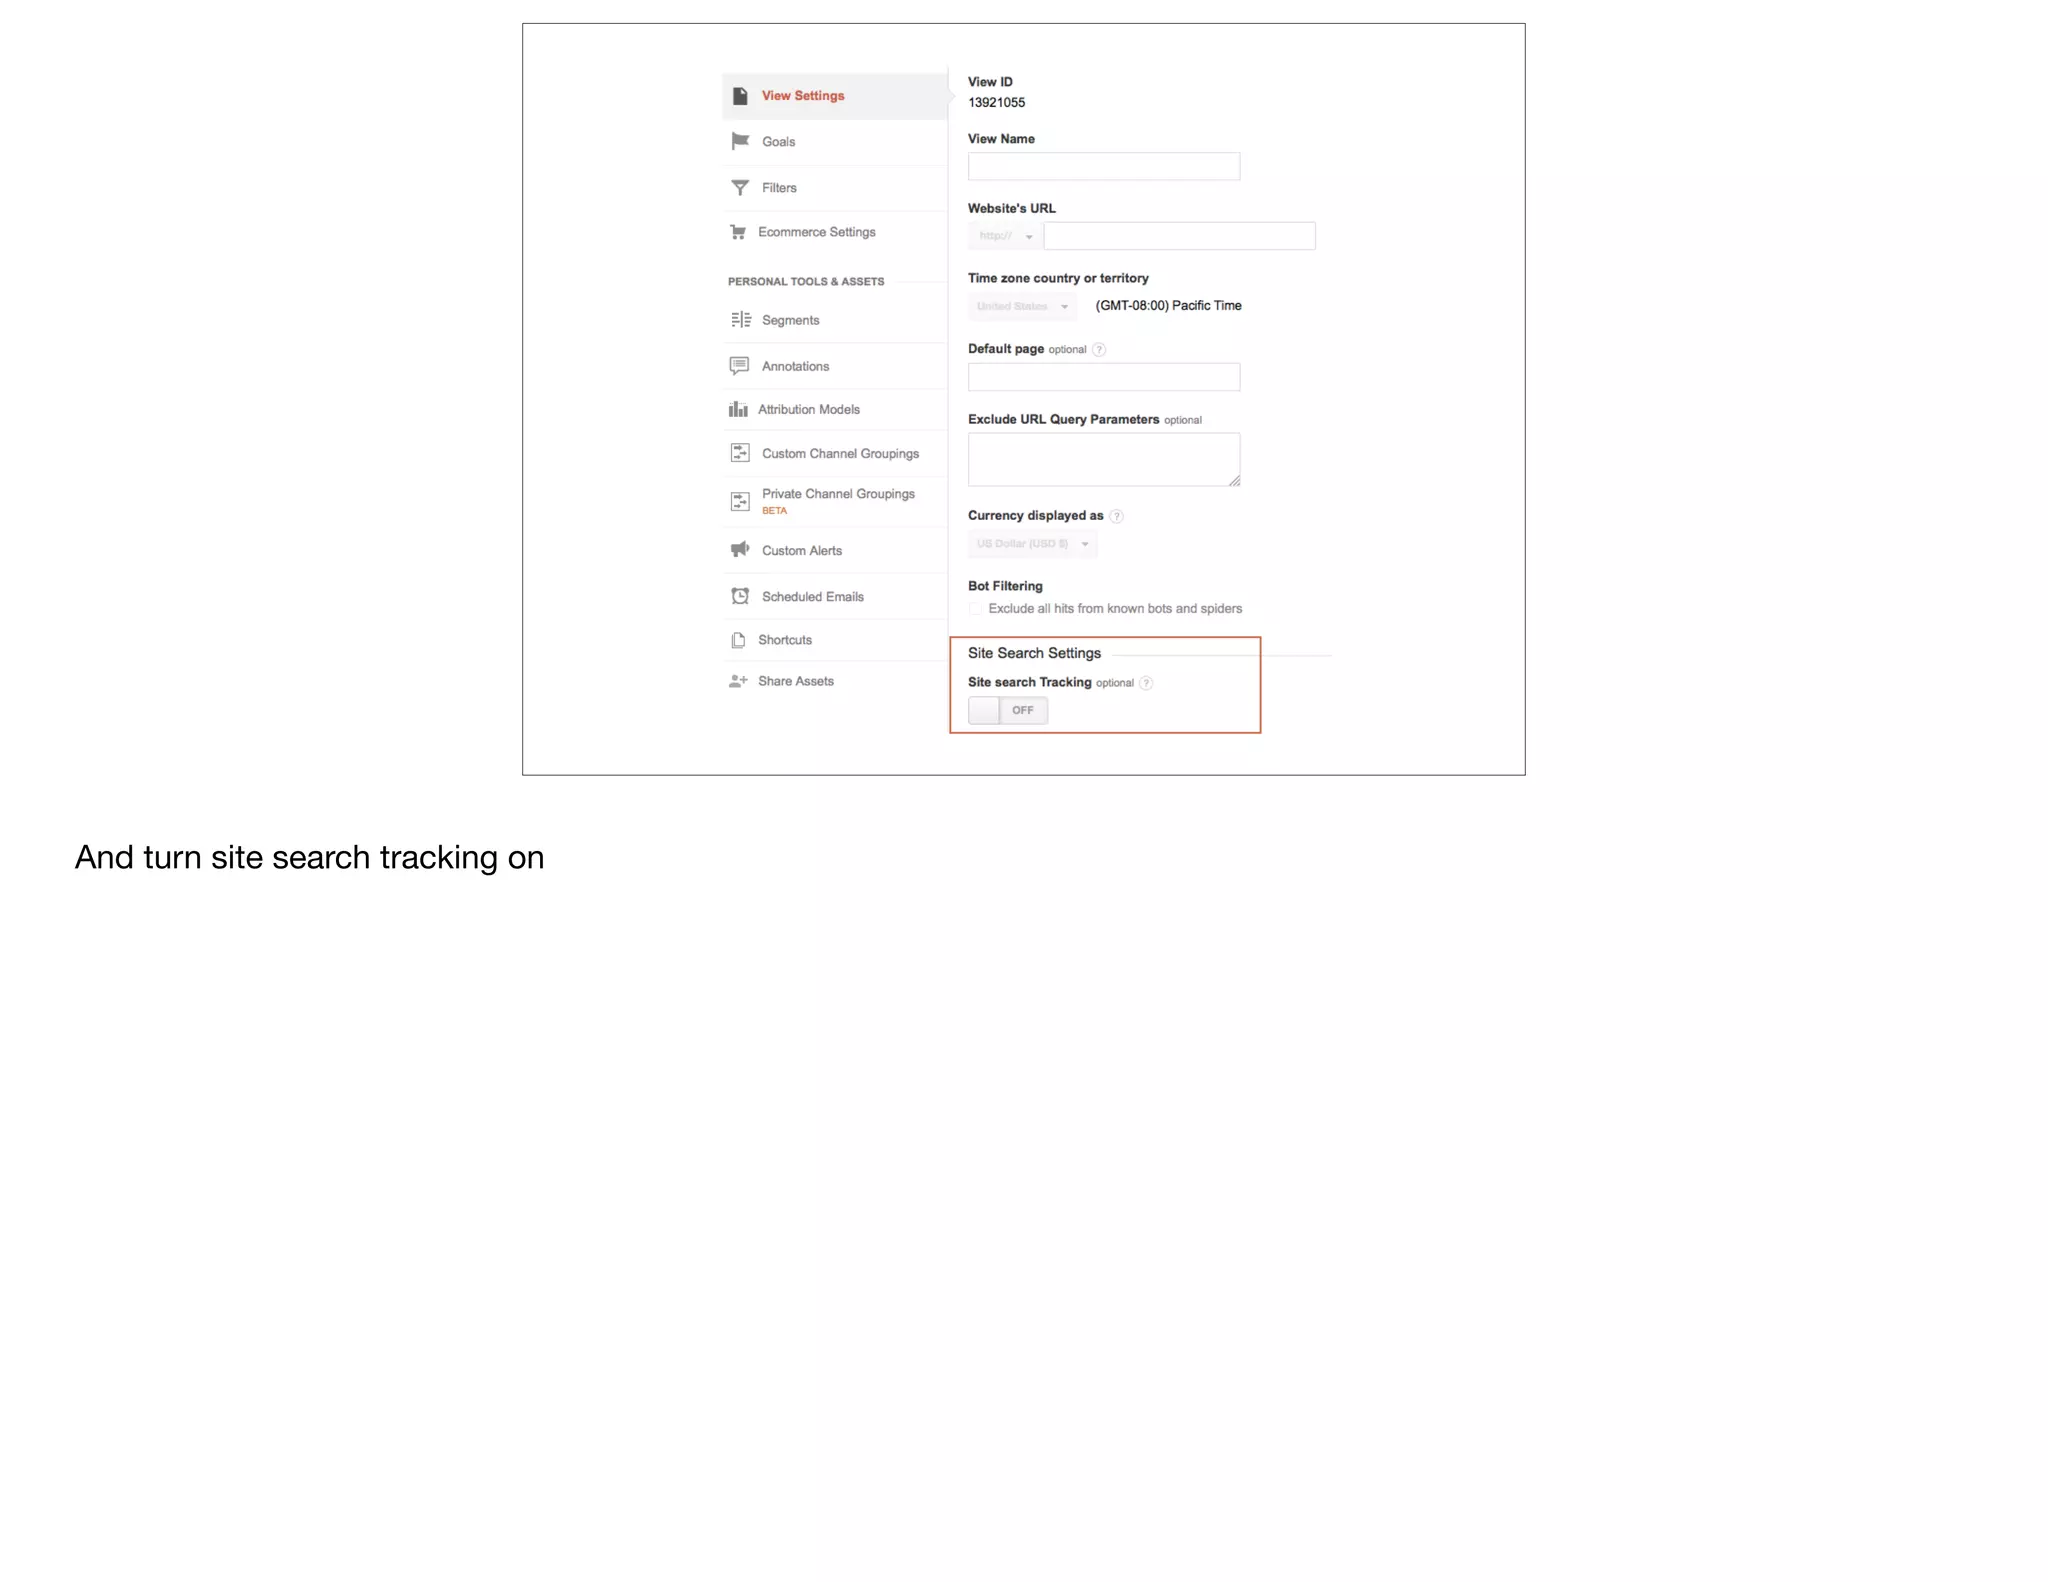
![Long list
Often, top of list is a [null] result because your search field is confusing
And jobs-related
For foundations, “logo” is common bc your grantees are looking for it
Let’s screen out those words we don’t need, so we can focus on what is important/different each month](https://image.slidesharecdn.com/dogooddatahiddensecretsofgoogleanalytics-150430155241-conversion-gate01/75/Hidden-Secrets-of-Google-Analytics-Do-Good-Data-2015-36-2048.jpg)
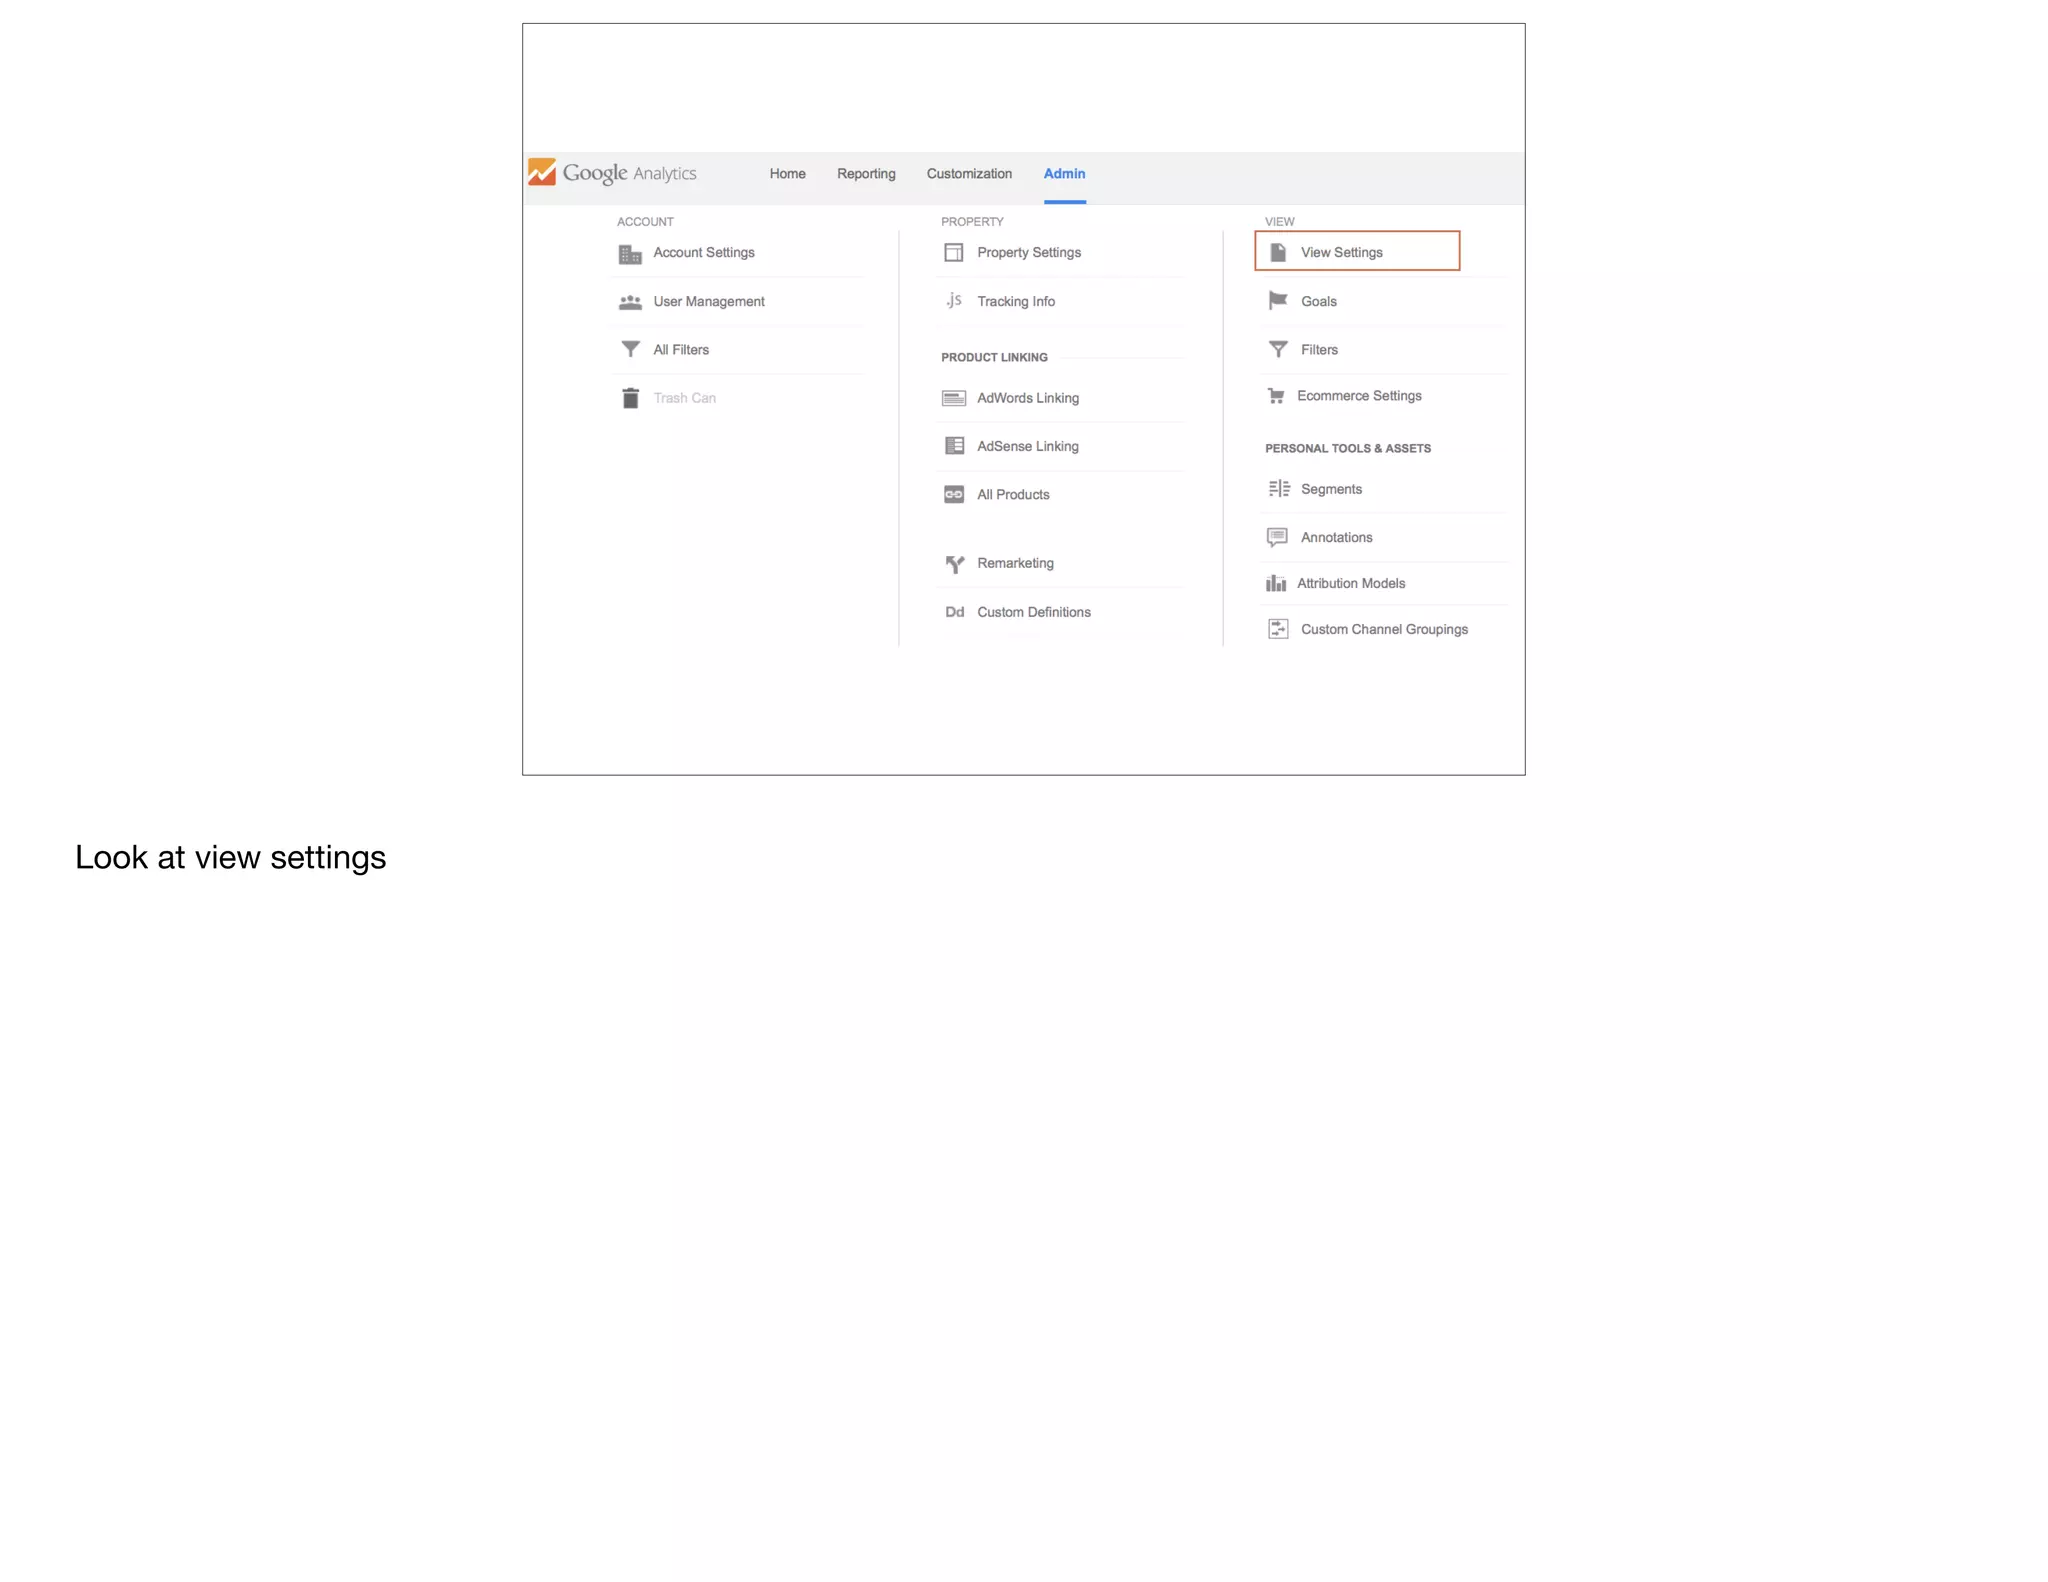
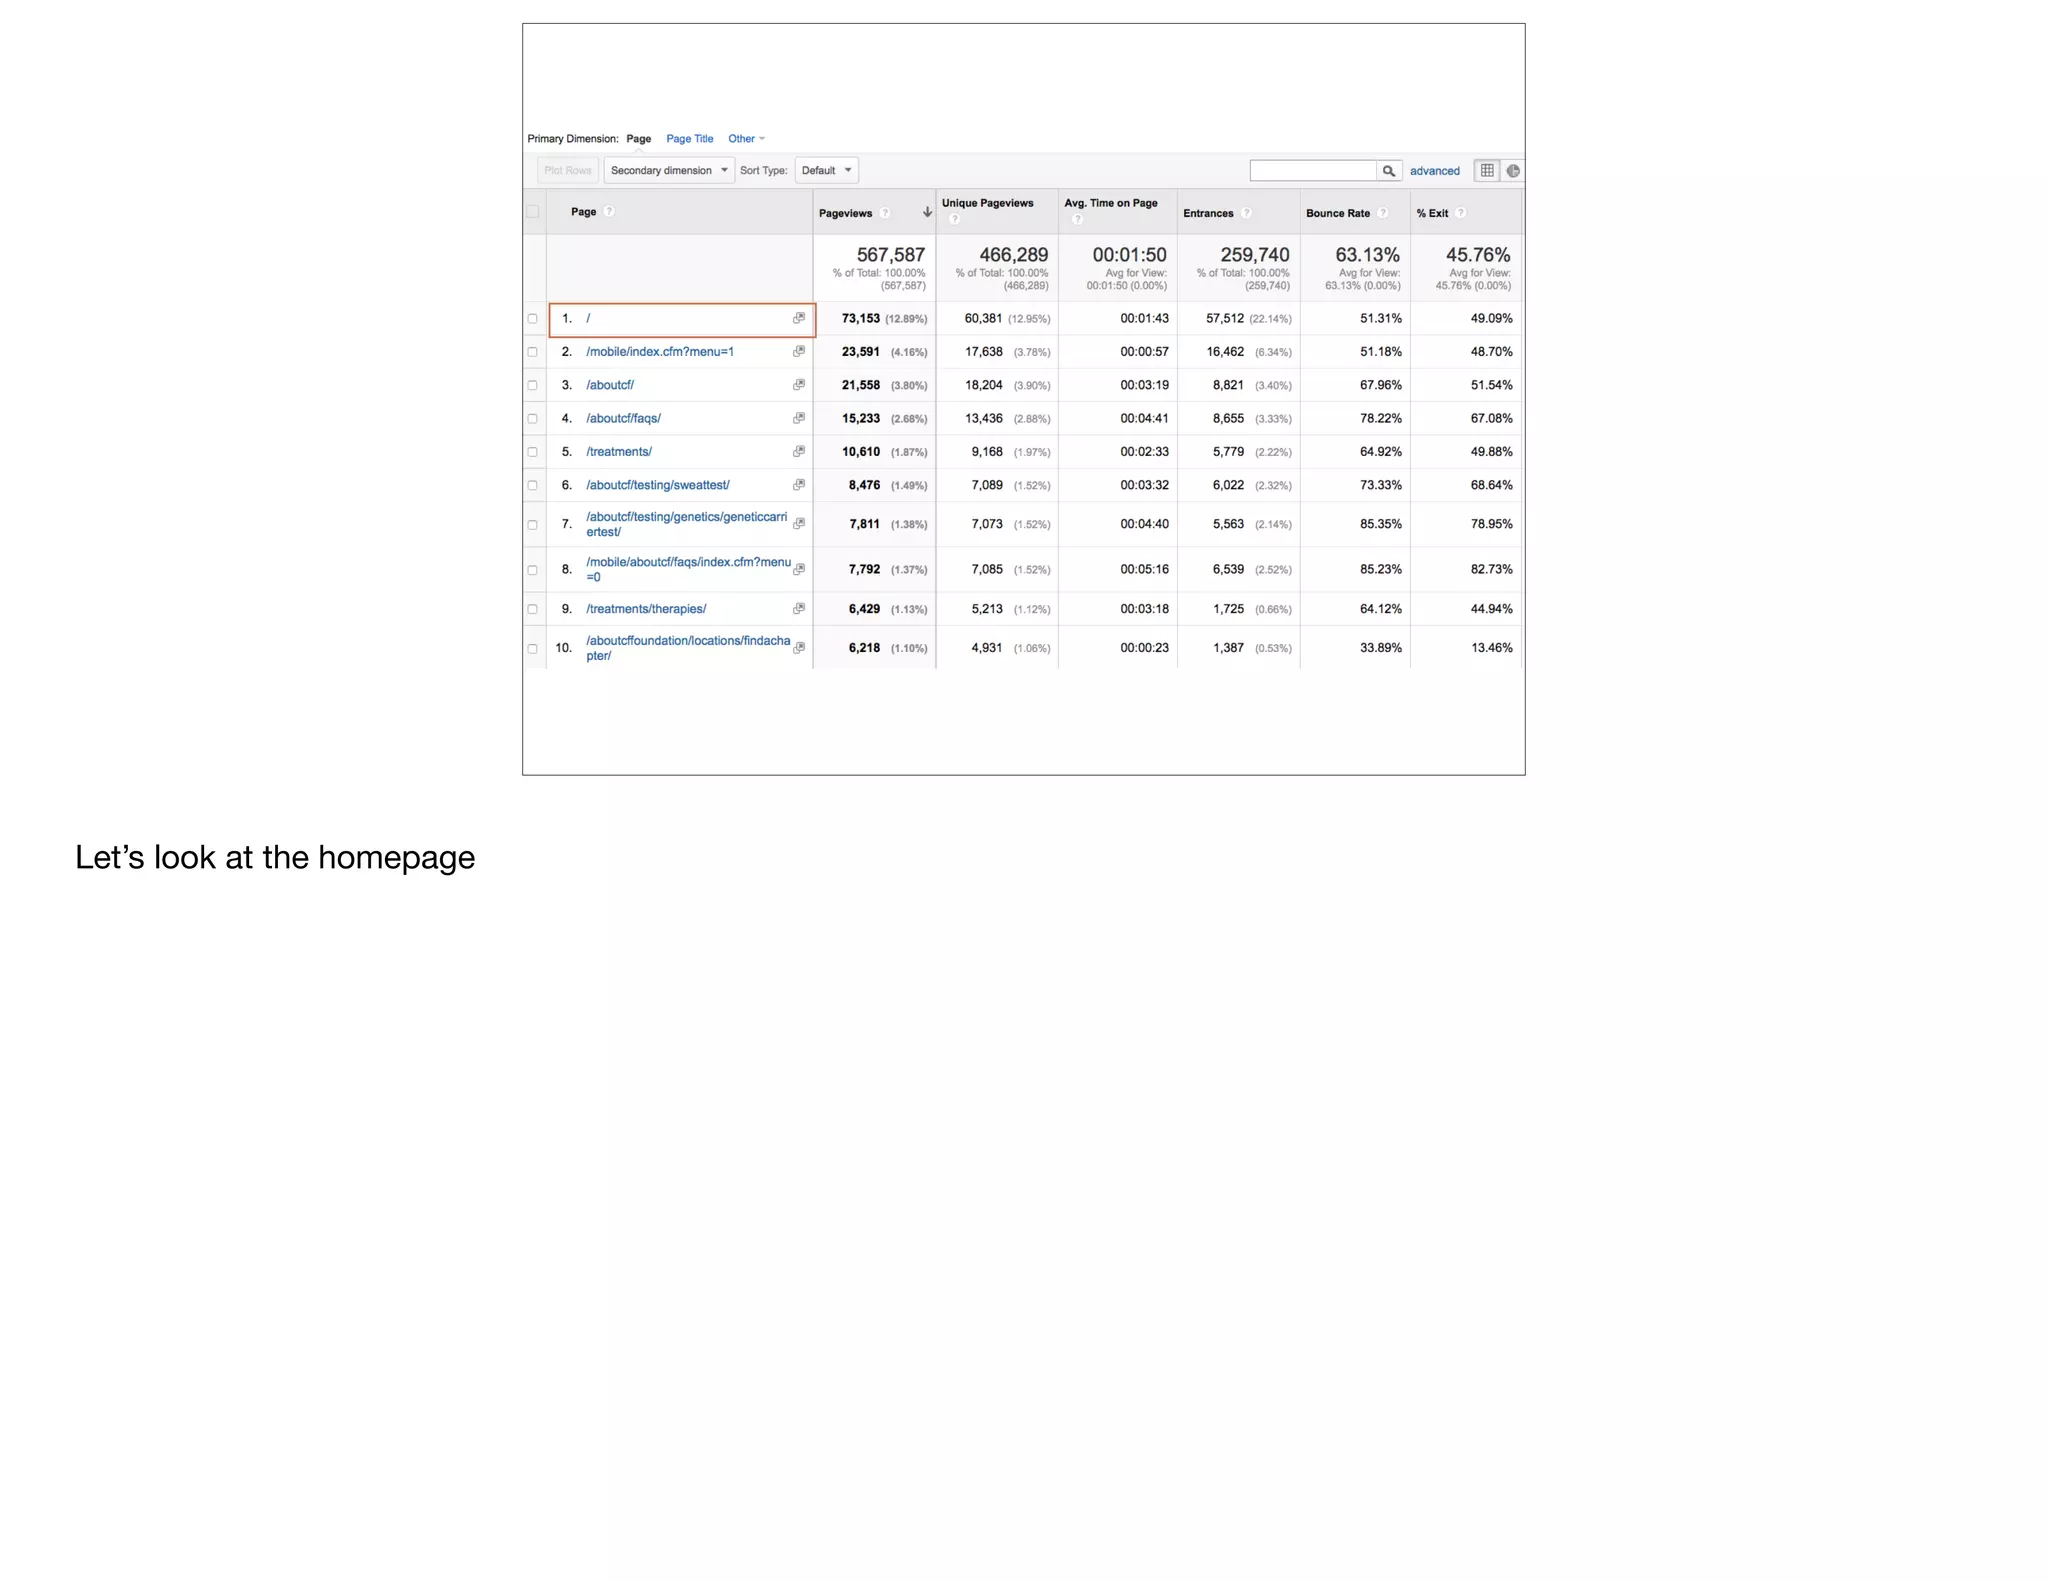
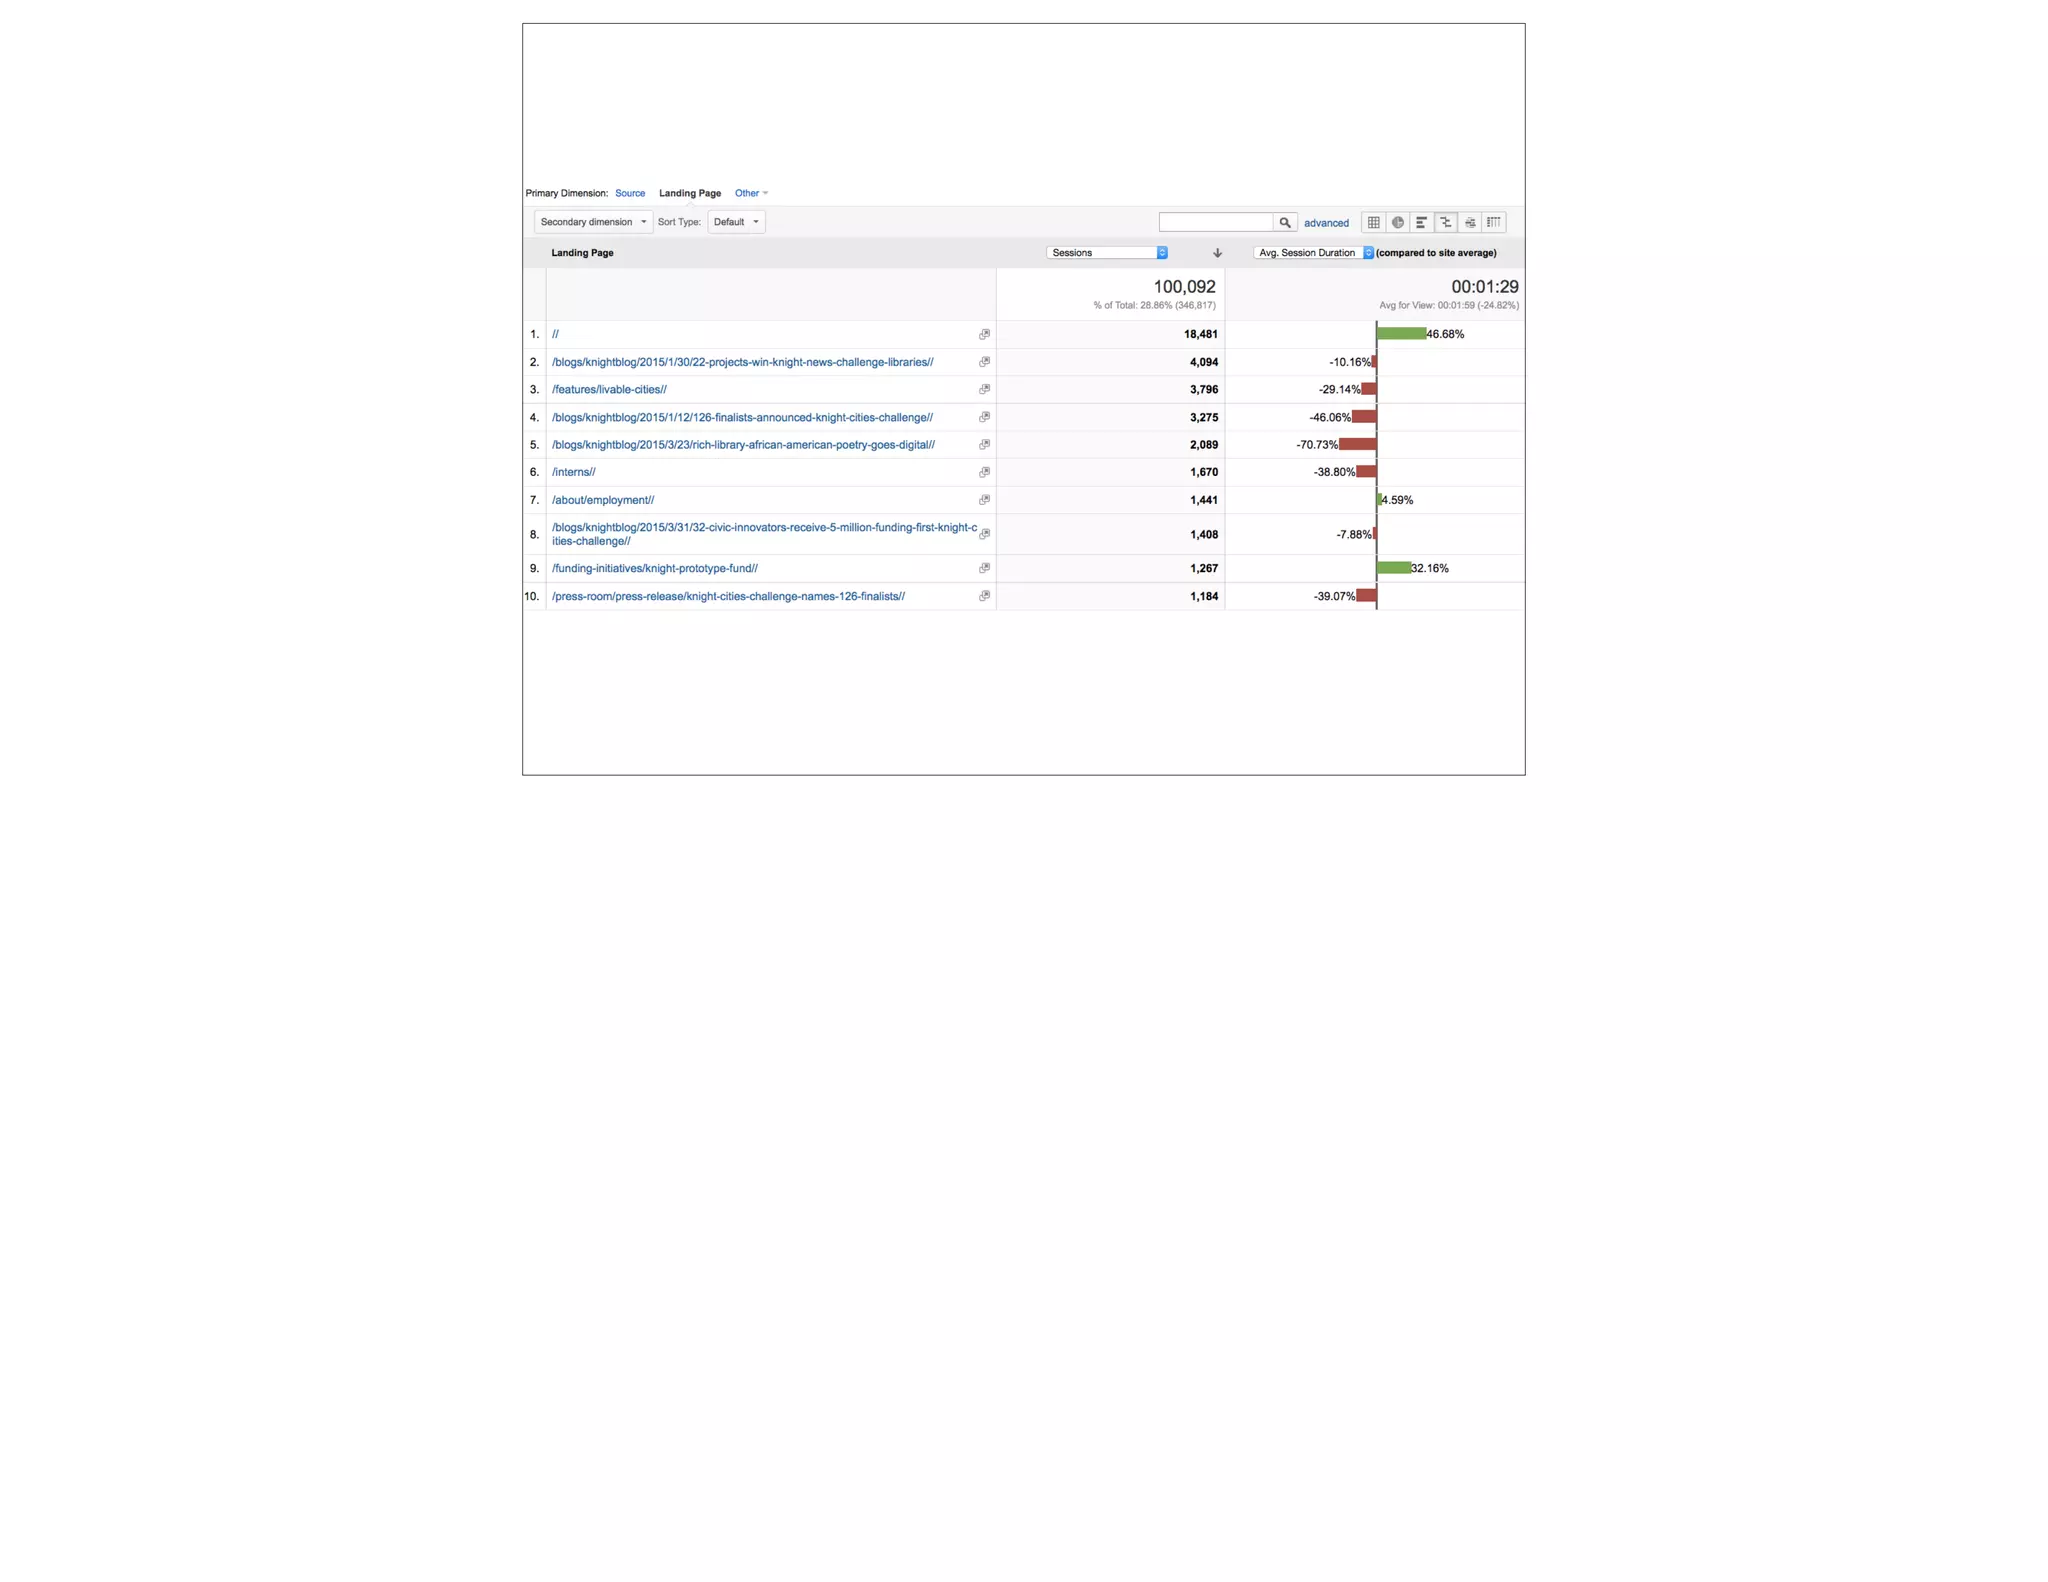
![@devonvsmith
what do users need
from [this] page?
Secret: Most orgs, the majority of your users will not see your homepage during their visit
(BTW: use an advanced segment to prove that)
But your homepage is typically your most viewed page overall
So stakeholders care a lot about their place on the homepage
but what do your users actually need?
Let’s look at a Navigation Path](https://image.slidesharecdn.com/dogooddatahiddensecretsofgoogleanalytics-150430155241-conversion-gate01/75/Hidden-Secrets-of-Google-Analytics-Do-Good-Data-2015-45-2048.jpg)

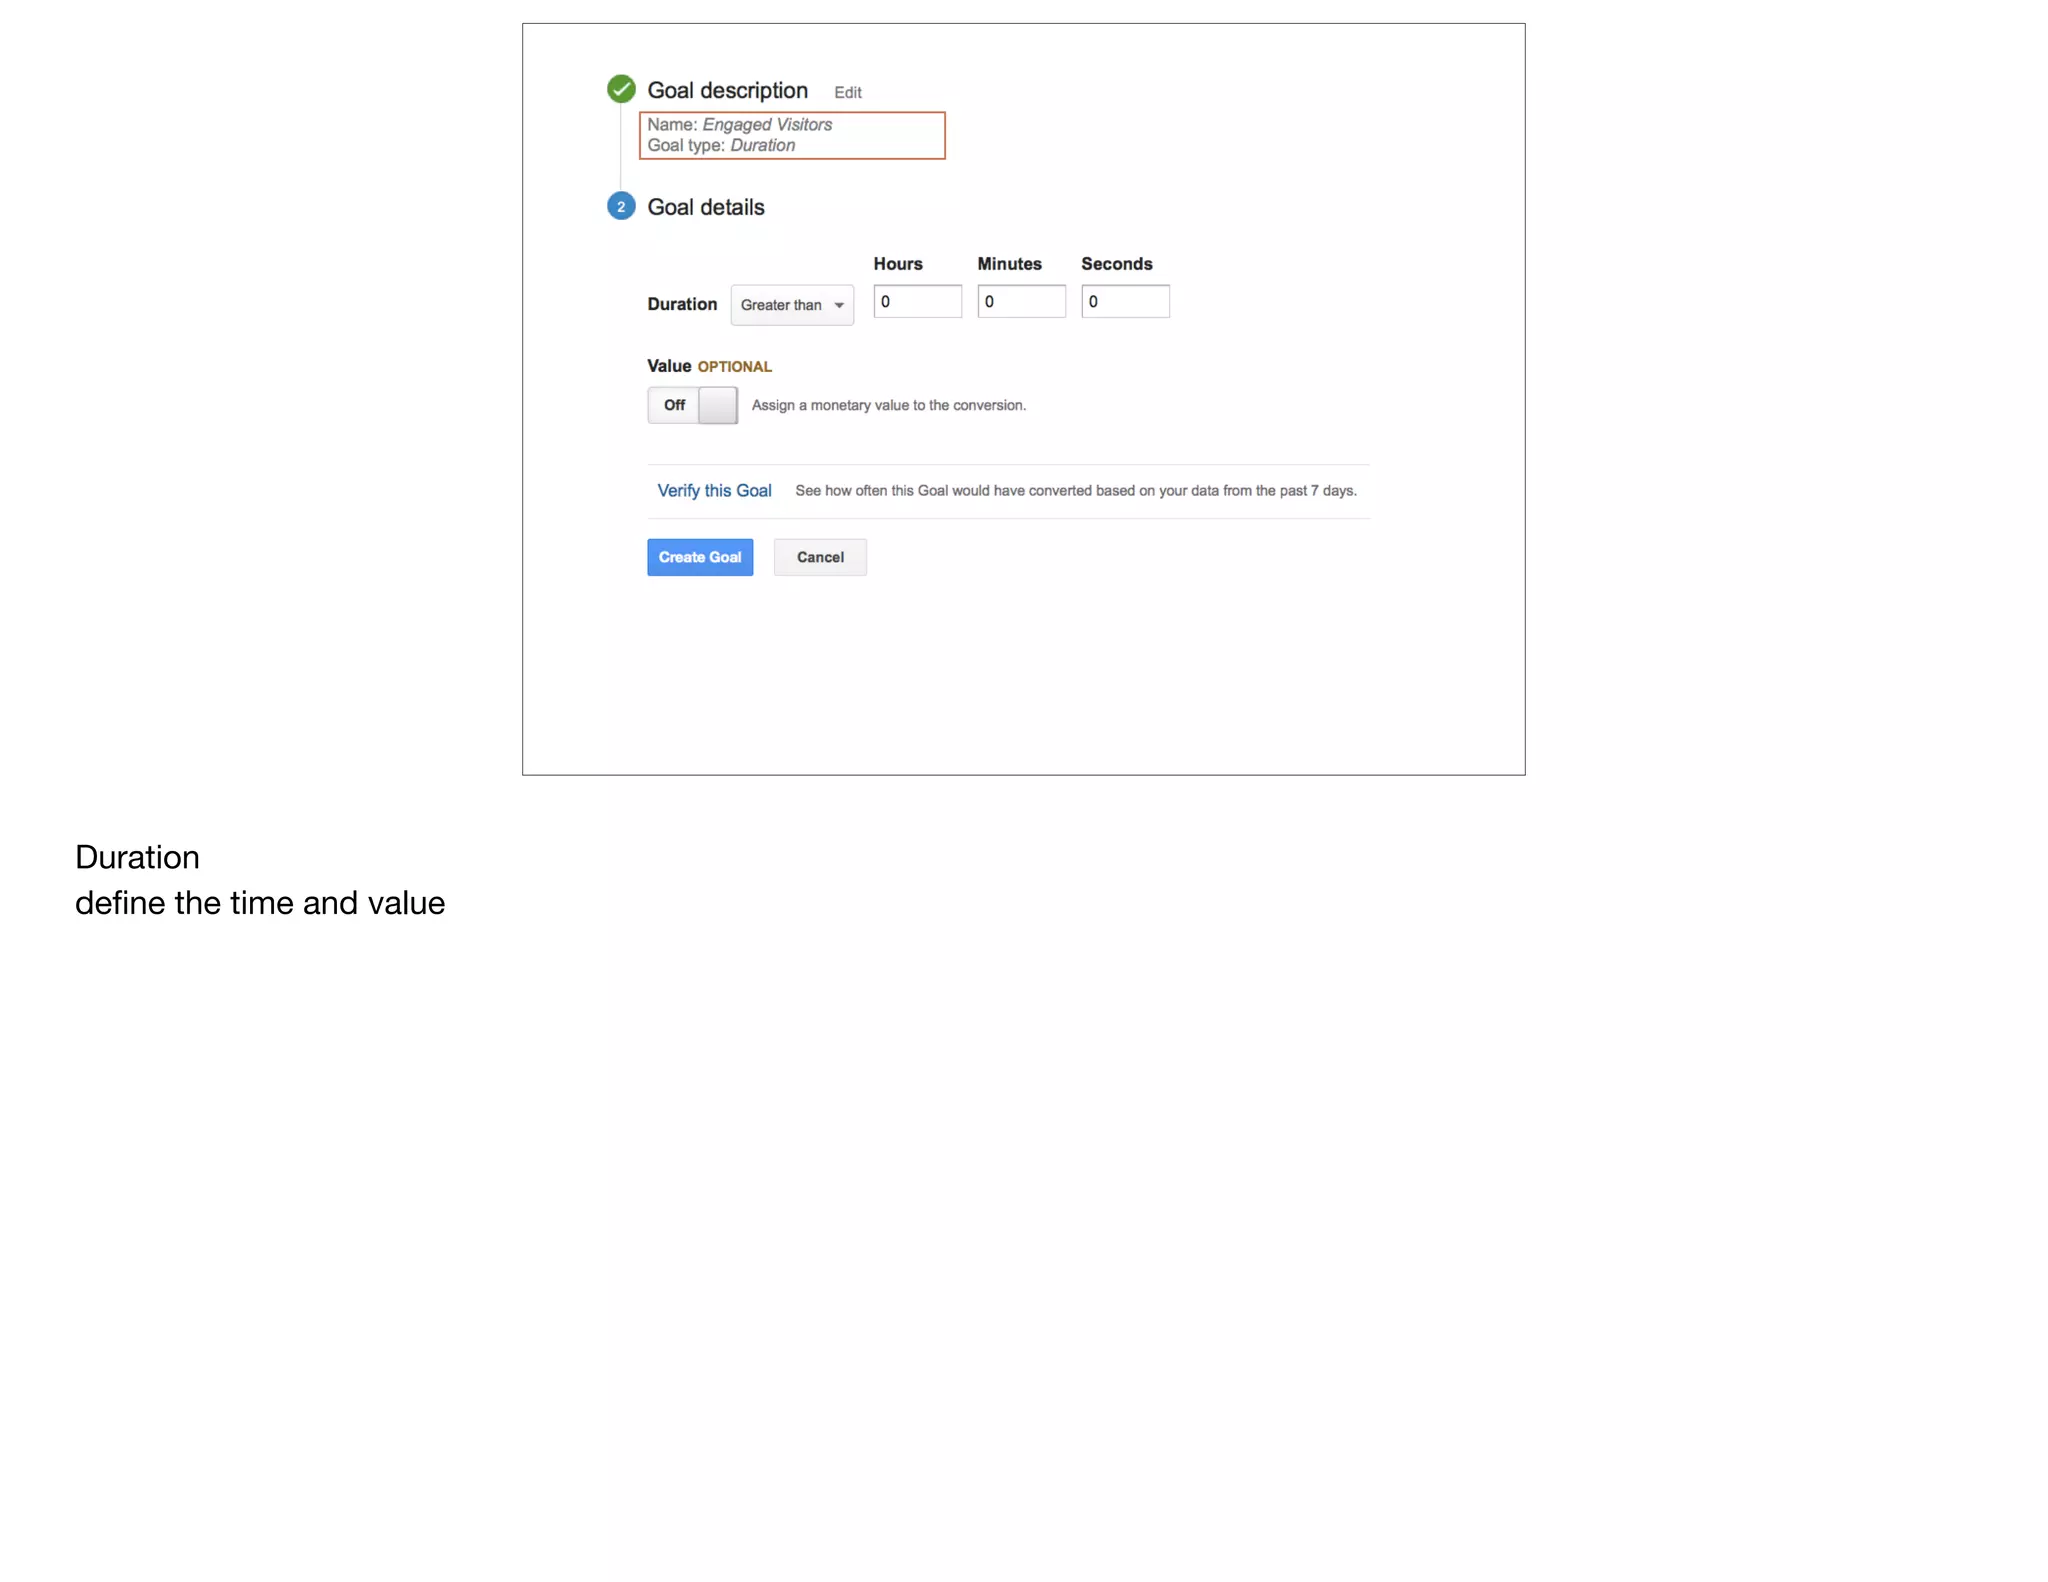
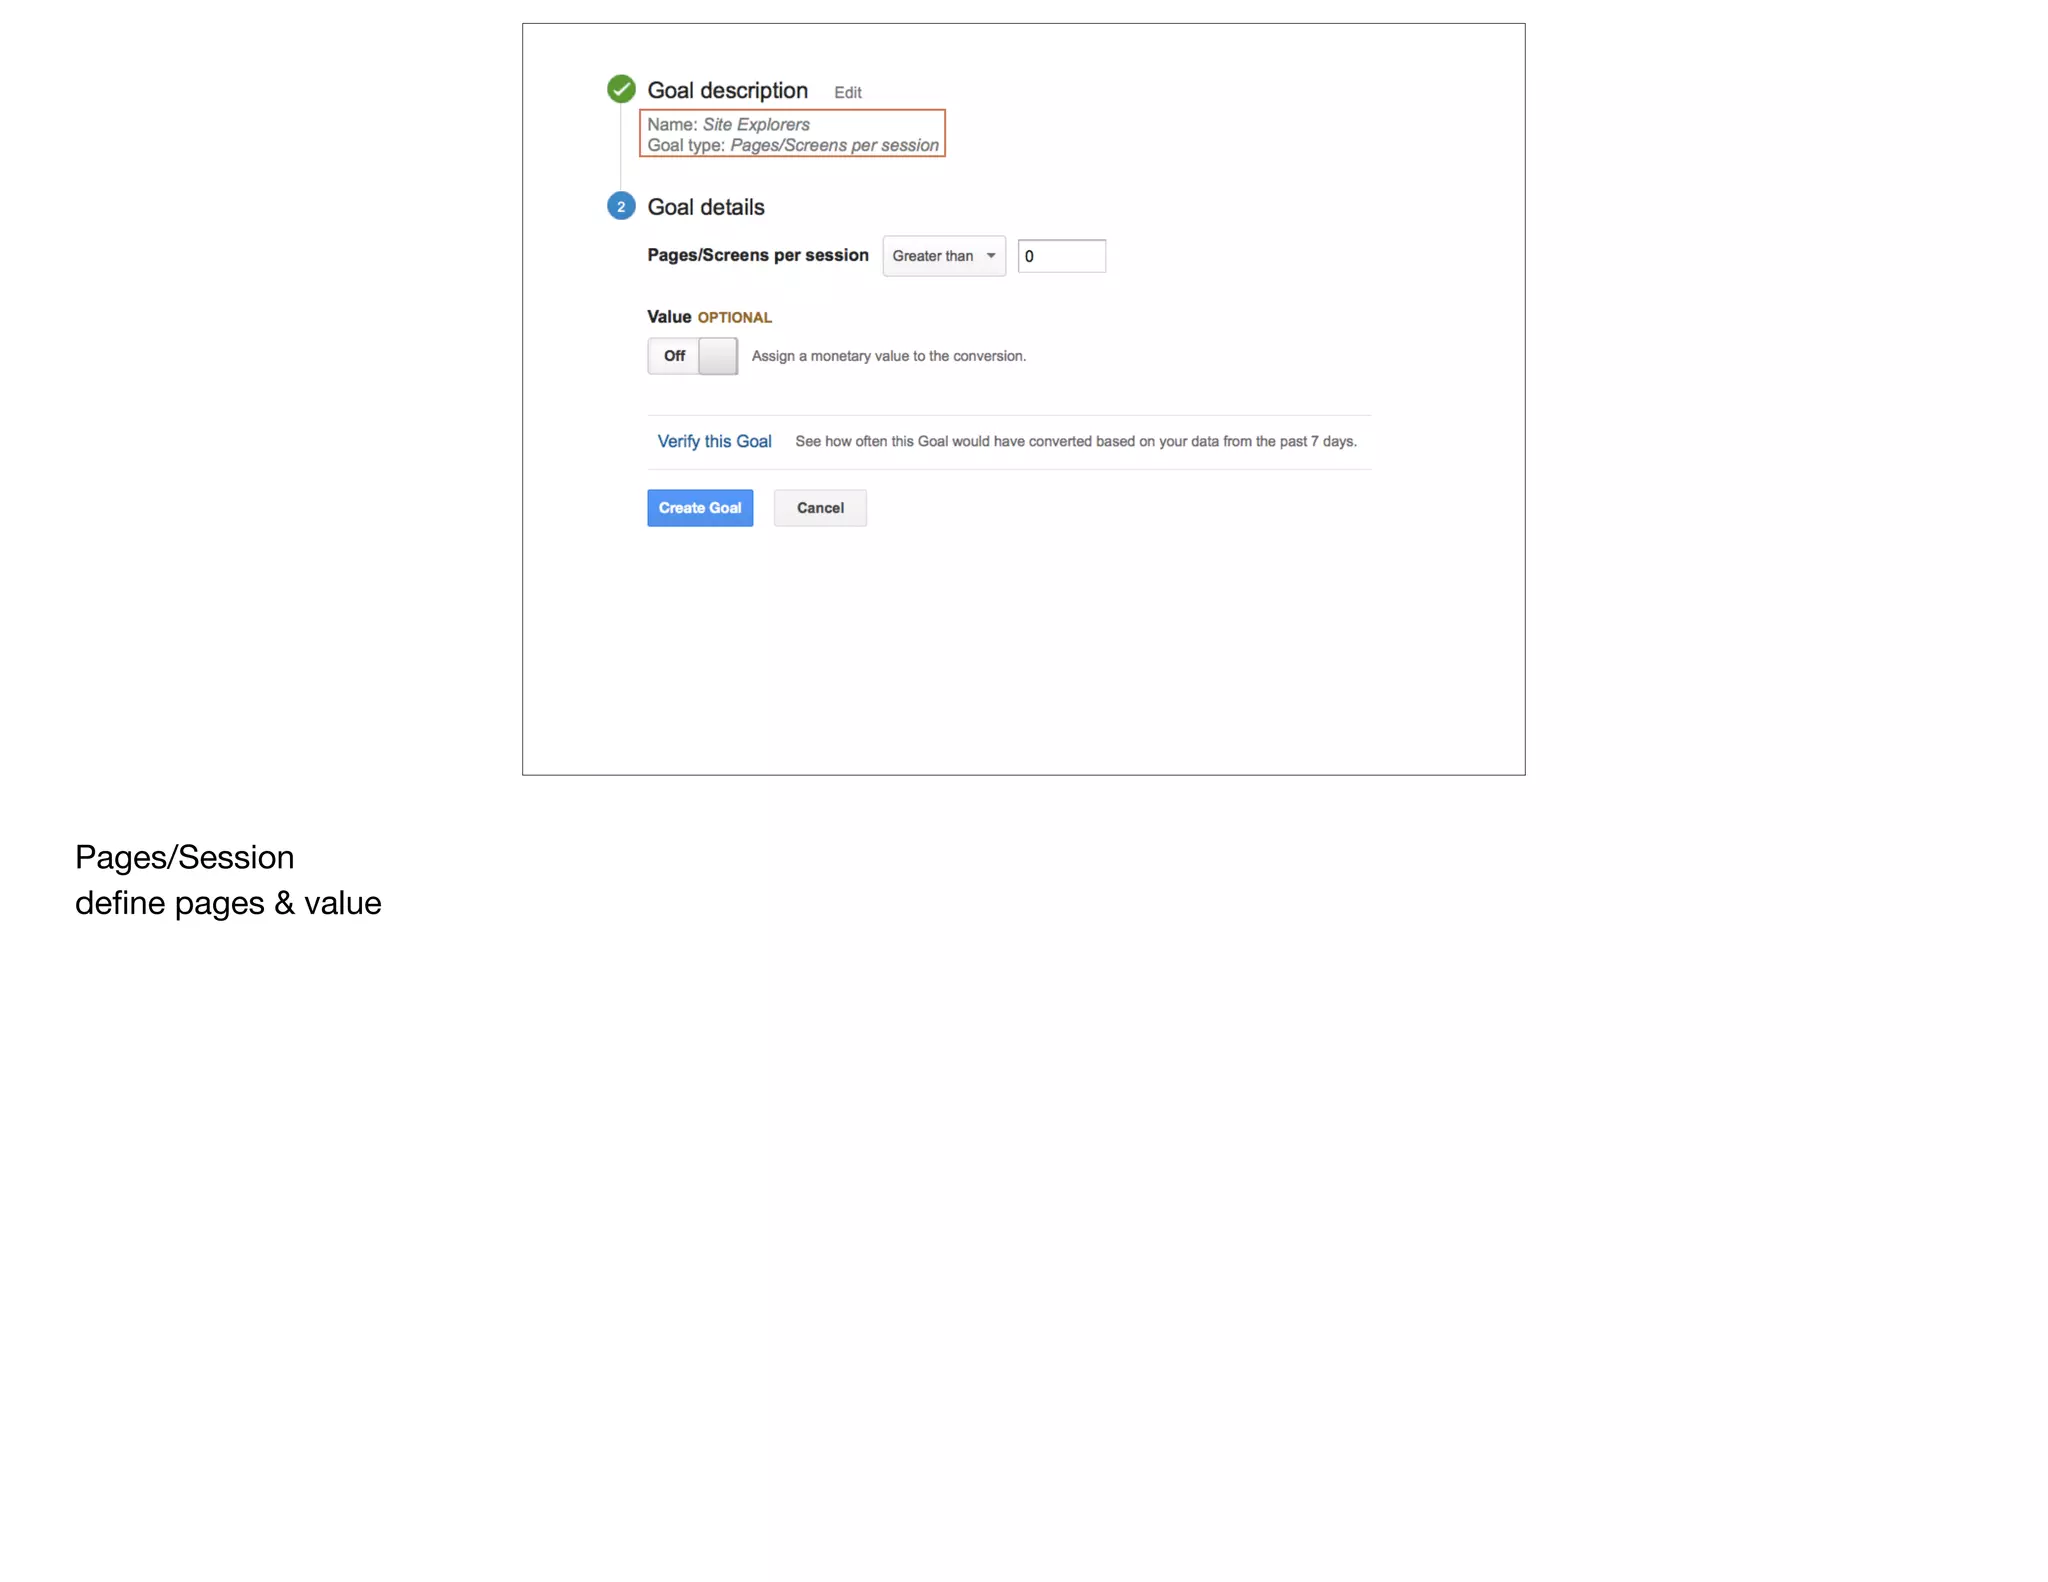
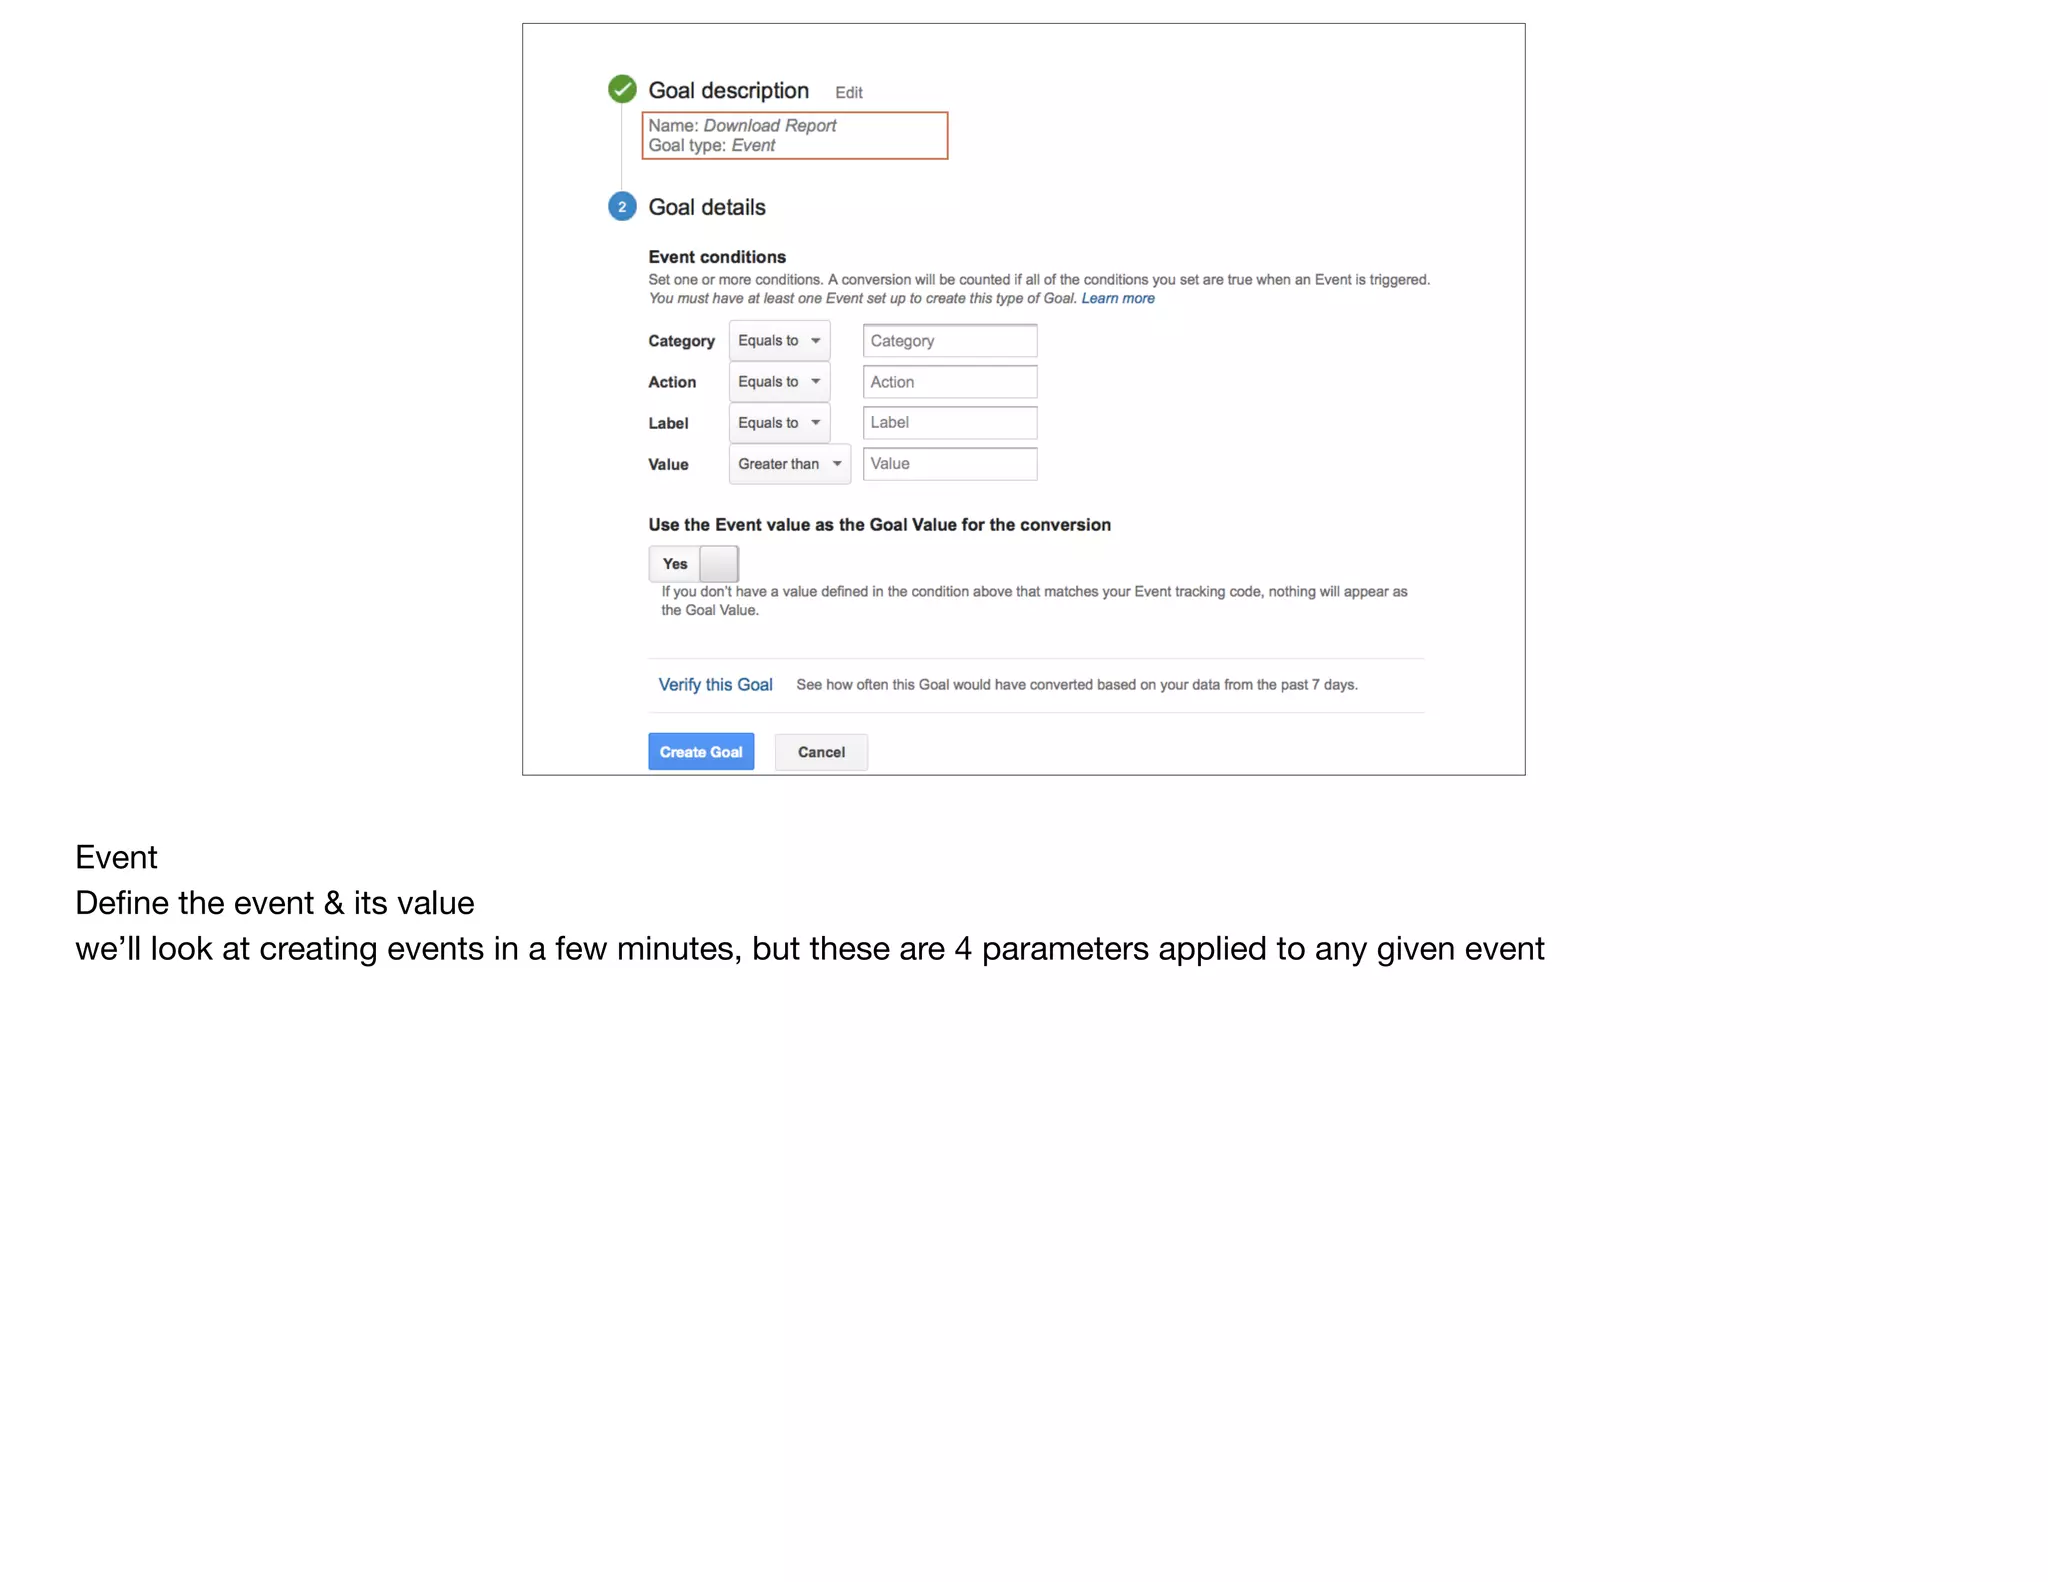
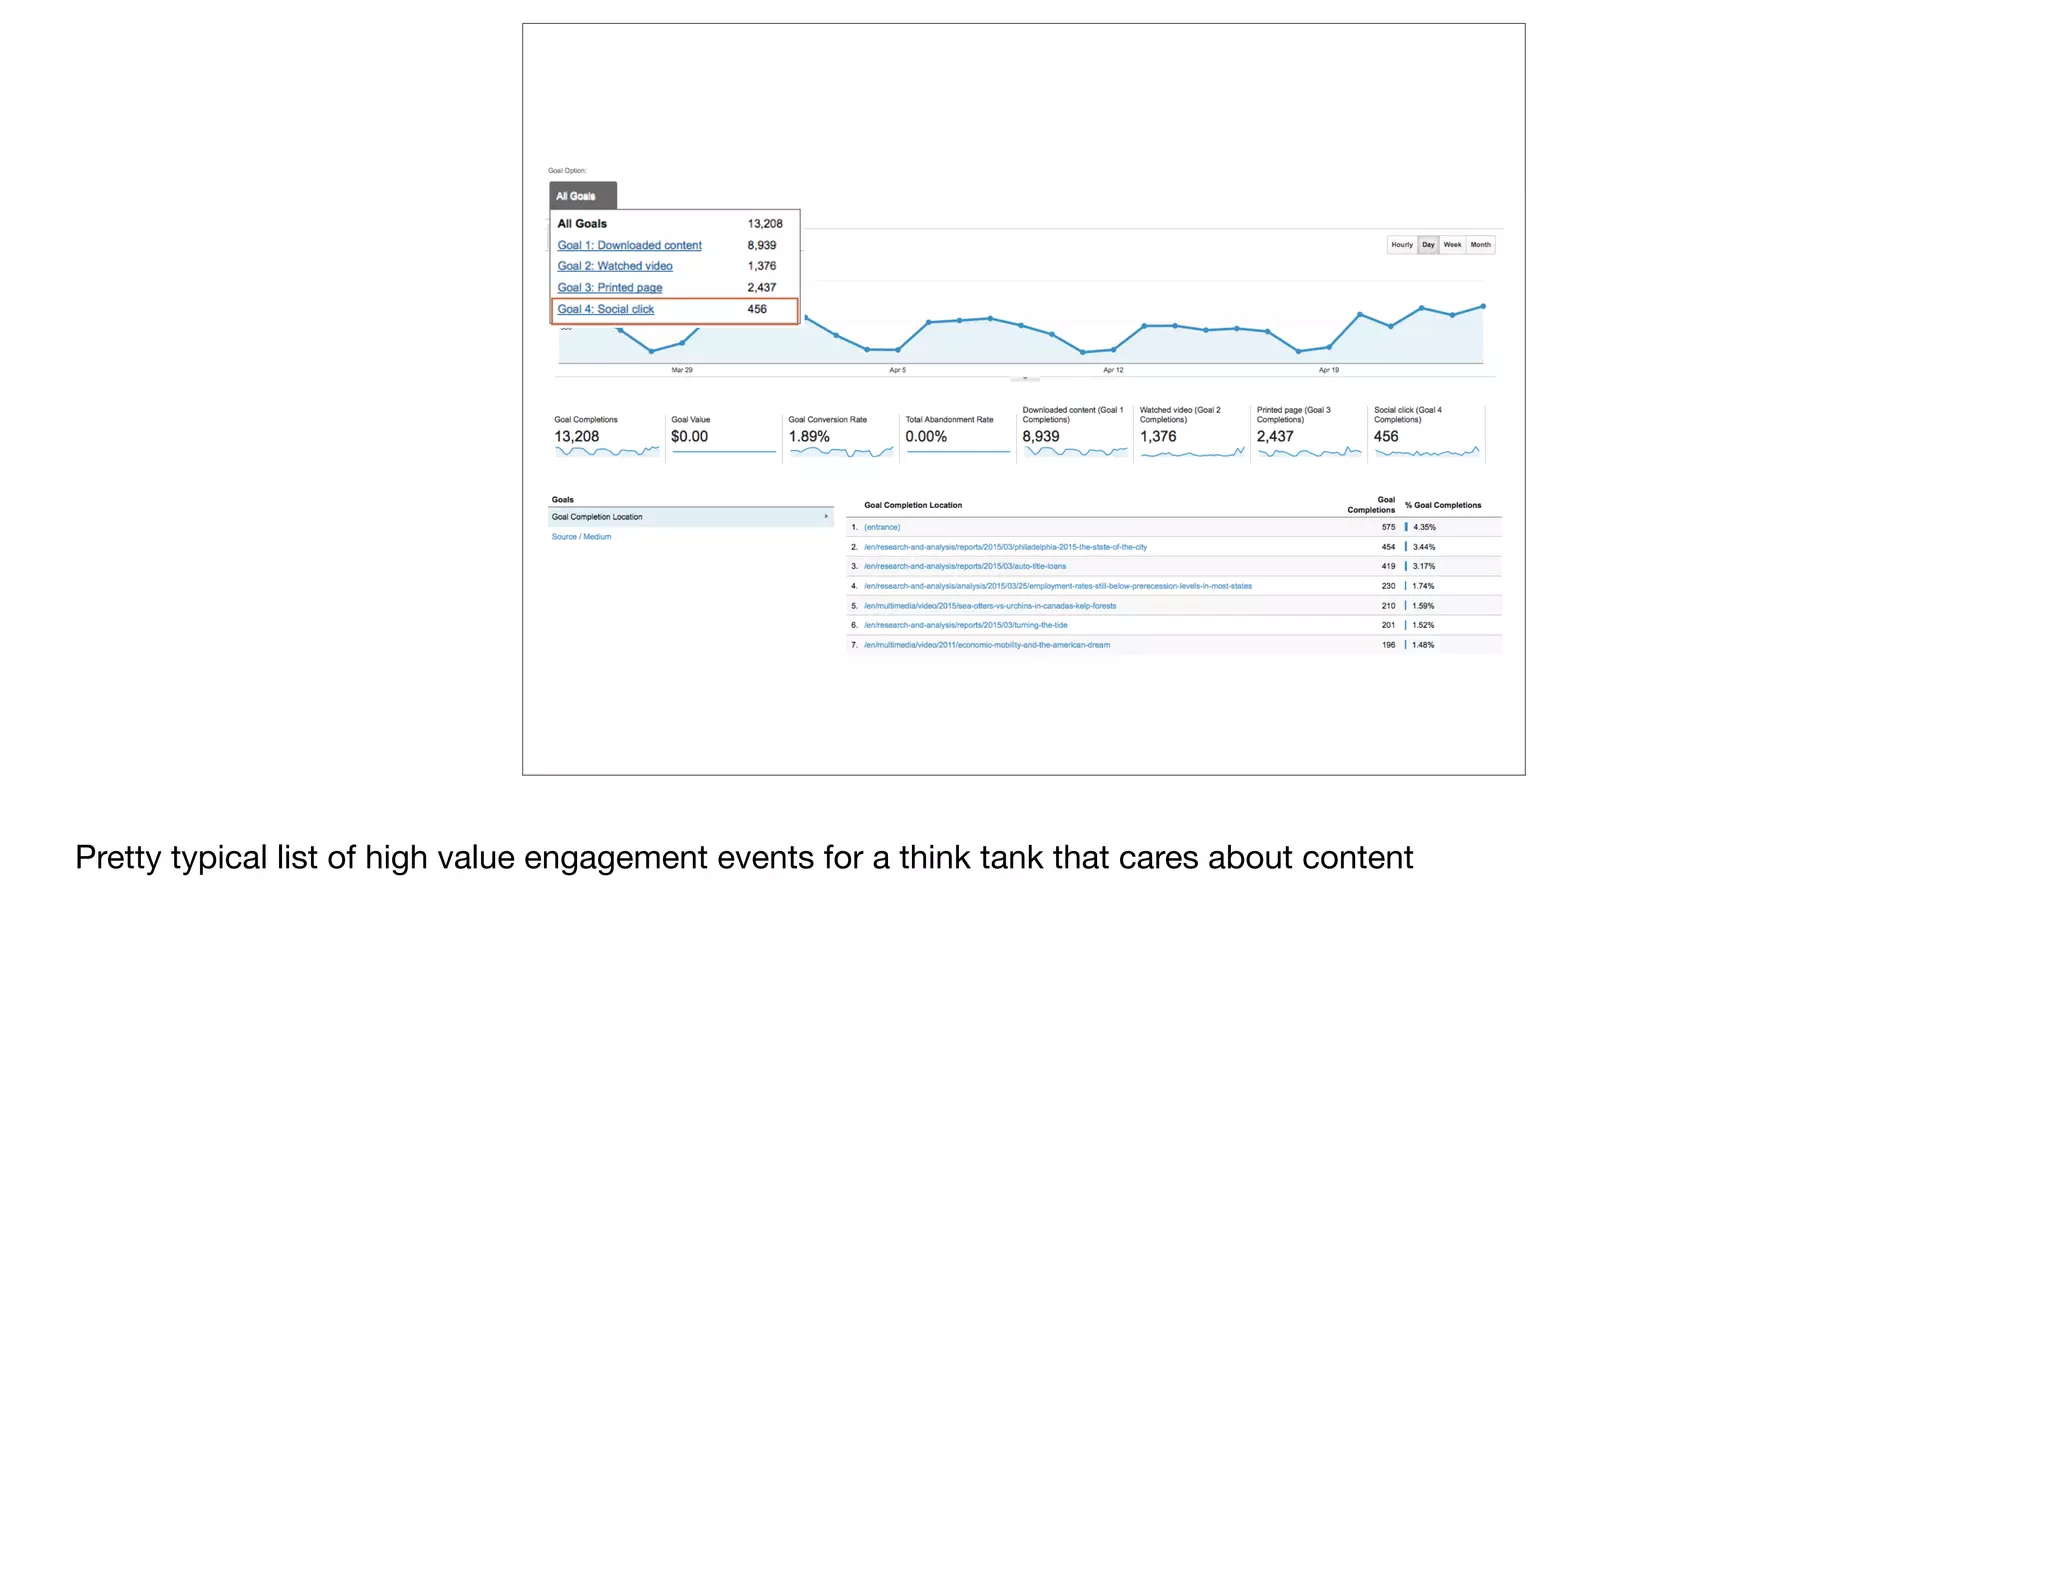
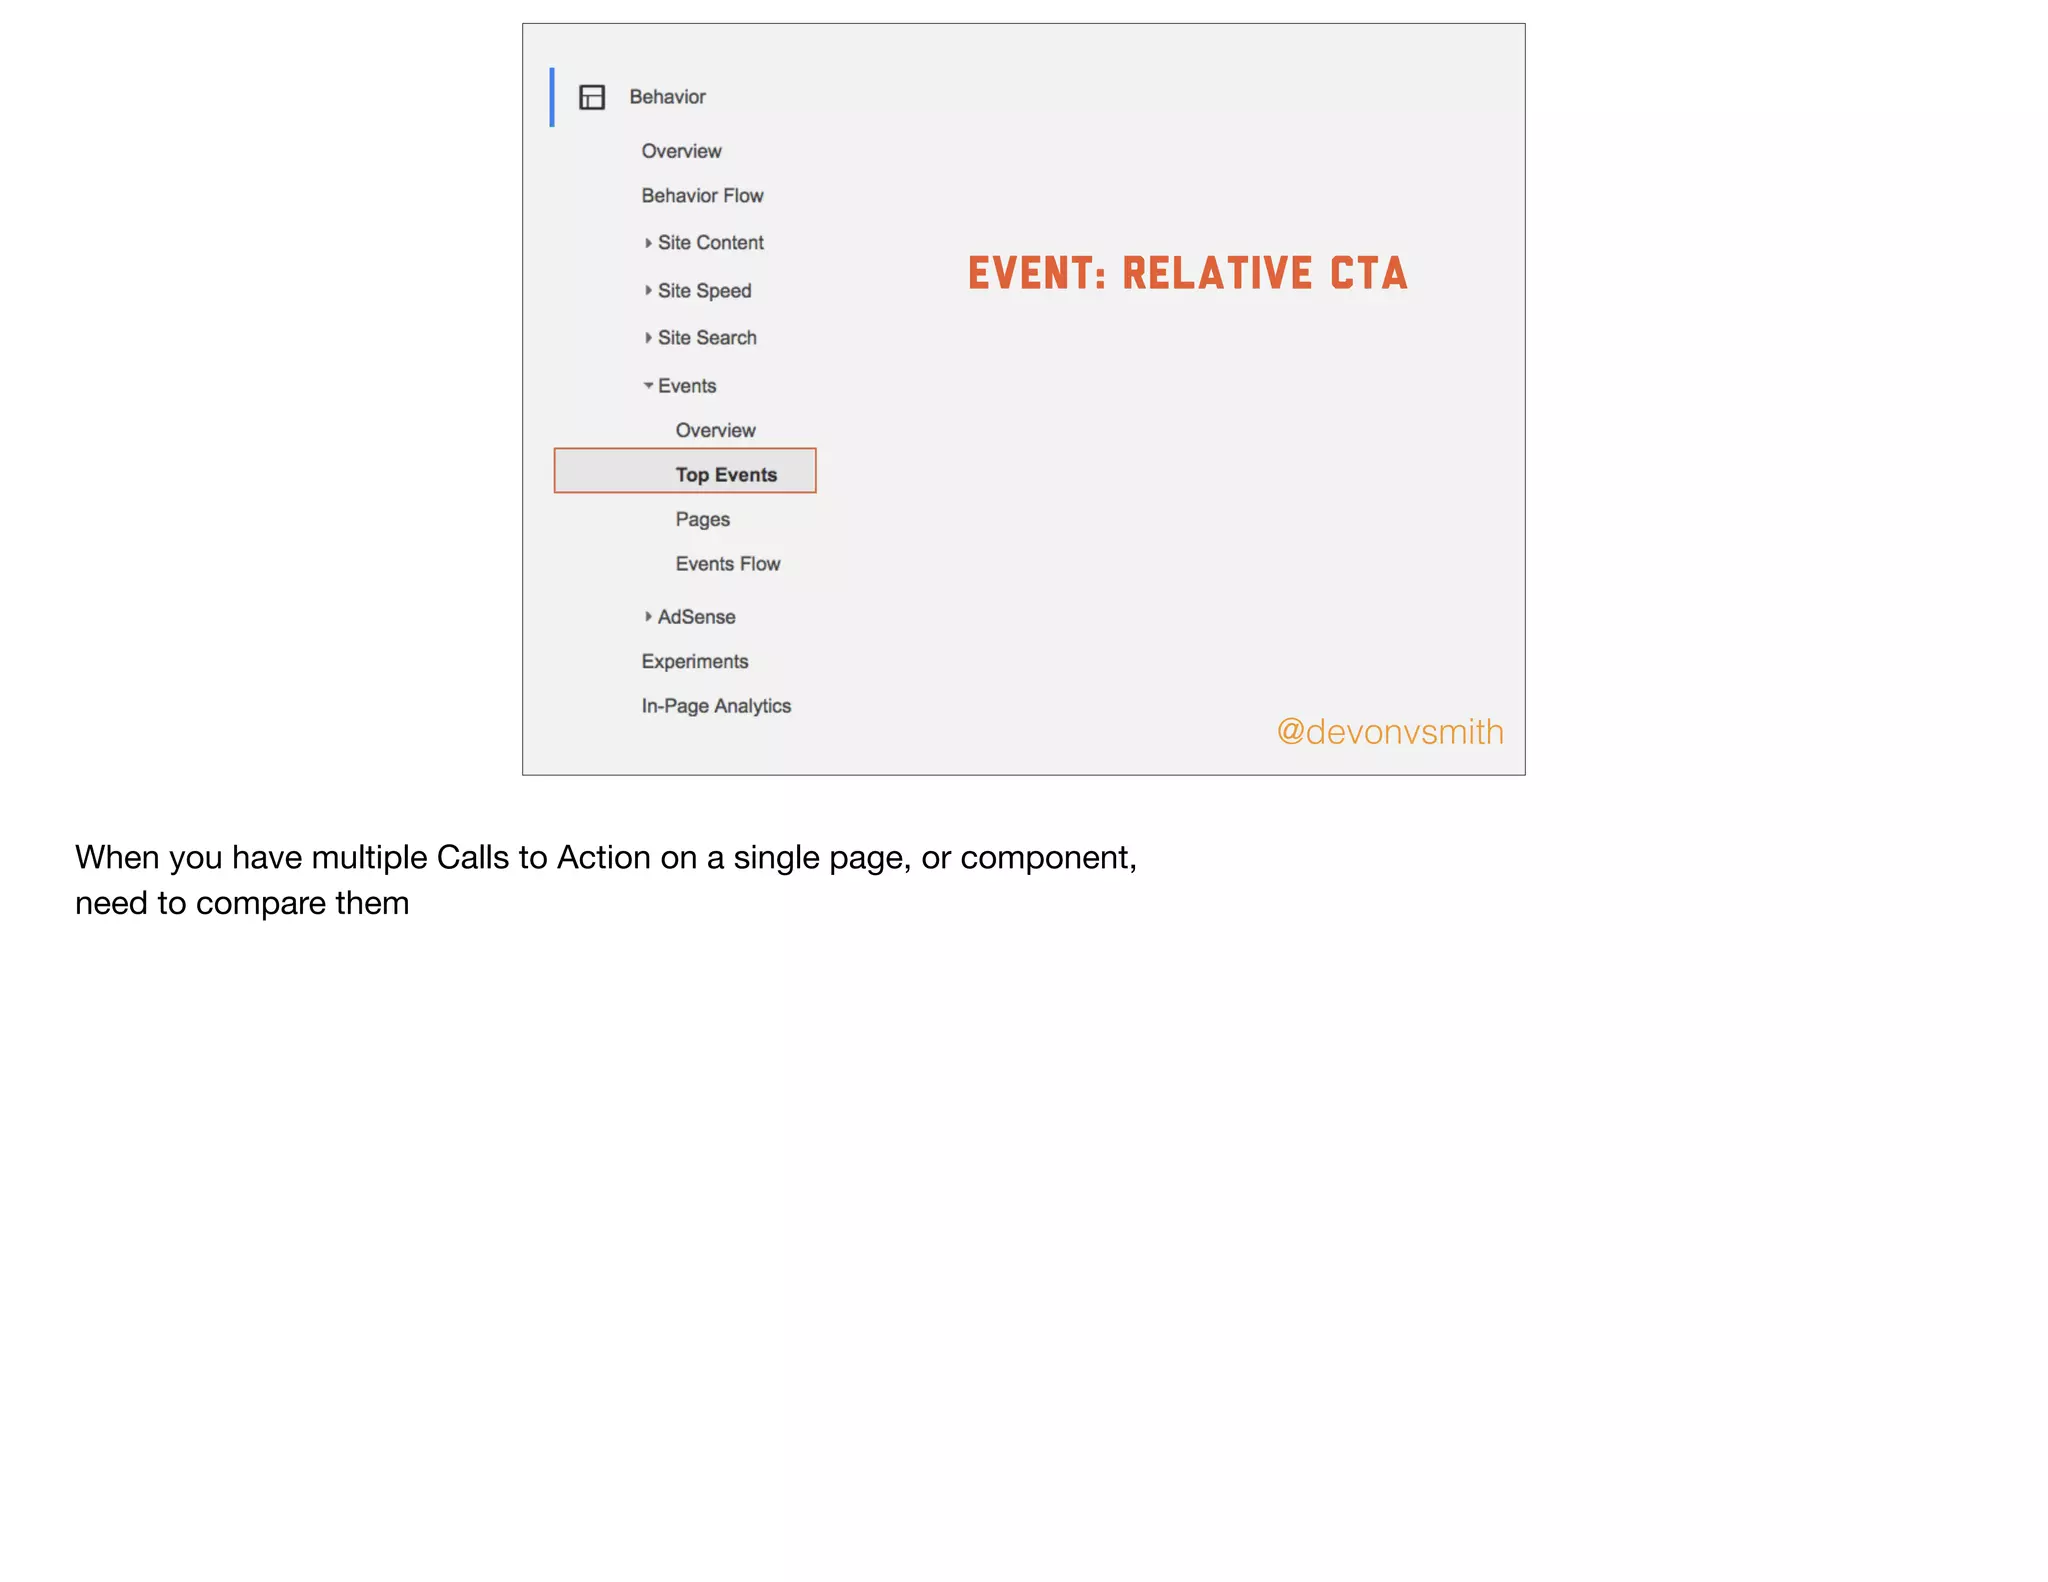
![@devonvsmith
how much is
[that] action worth?
Goals - high hopes, low follow through
For the nonprofits, foundations, & gov I work with, a lack of goals implemented in GA is not your problem
A lack of clear goals in general might be
When you’re not an e-commerce, it’s harder to put a value on a goal
How much it’s worth to download a PDF depends on who is downloading](https://image.slidesharecdn.com/dogooddatahiddensecretsofgoogleanalytics-150430155241-conversion-gate01/75/Hidden-Secrets-of-Google-Analytics-Do-Good-Data-2015-50-2048.jpg)
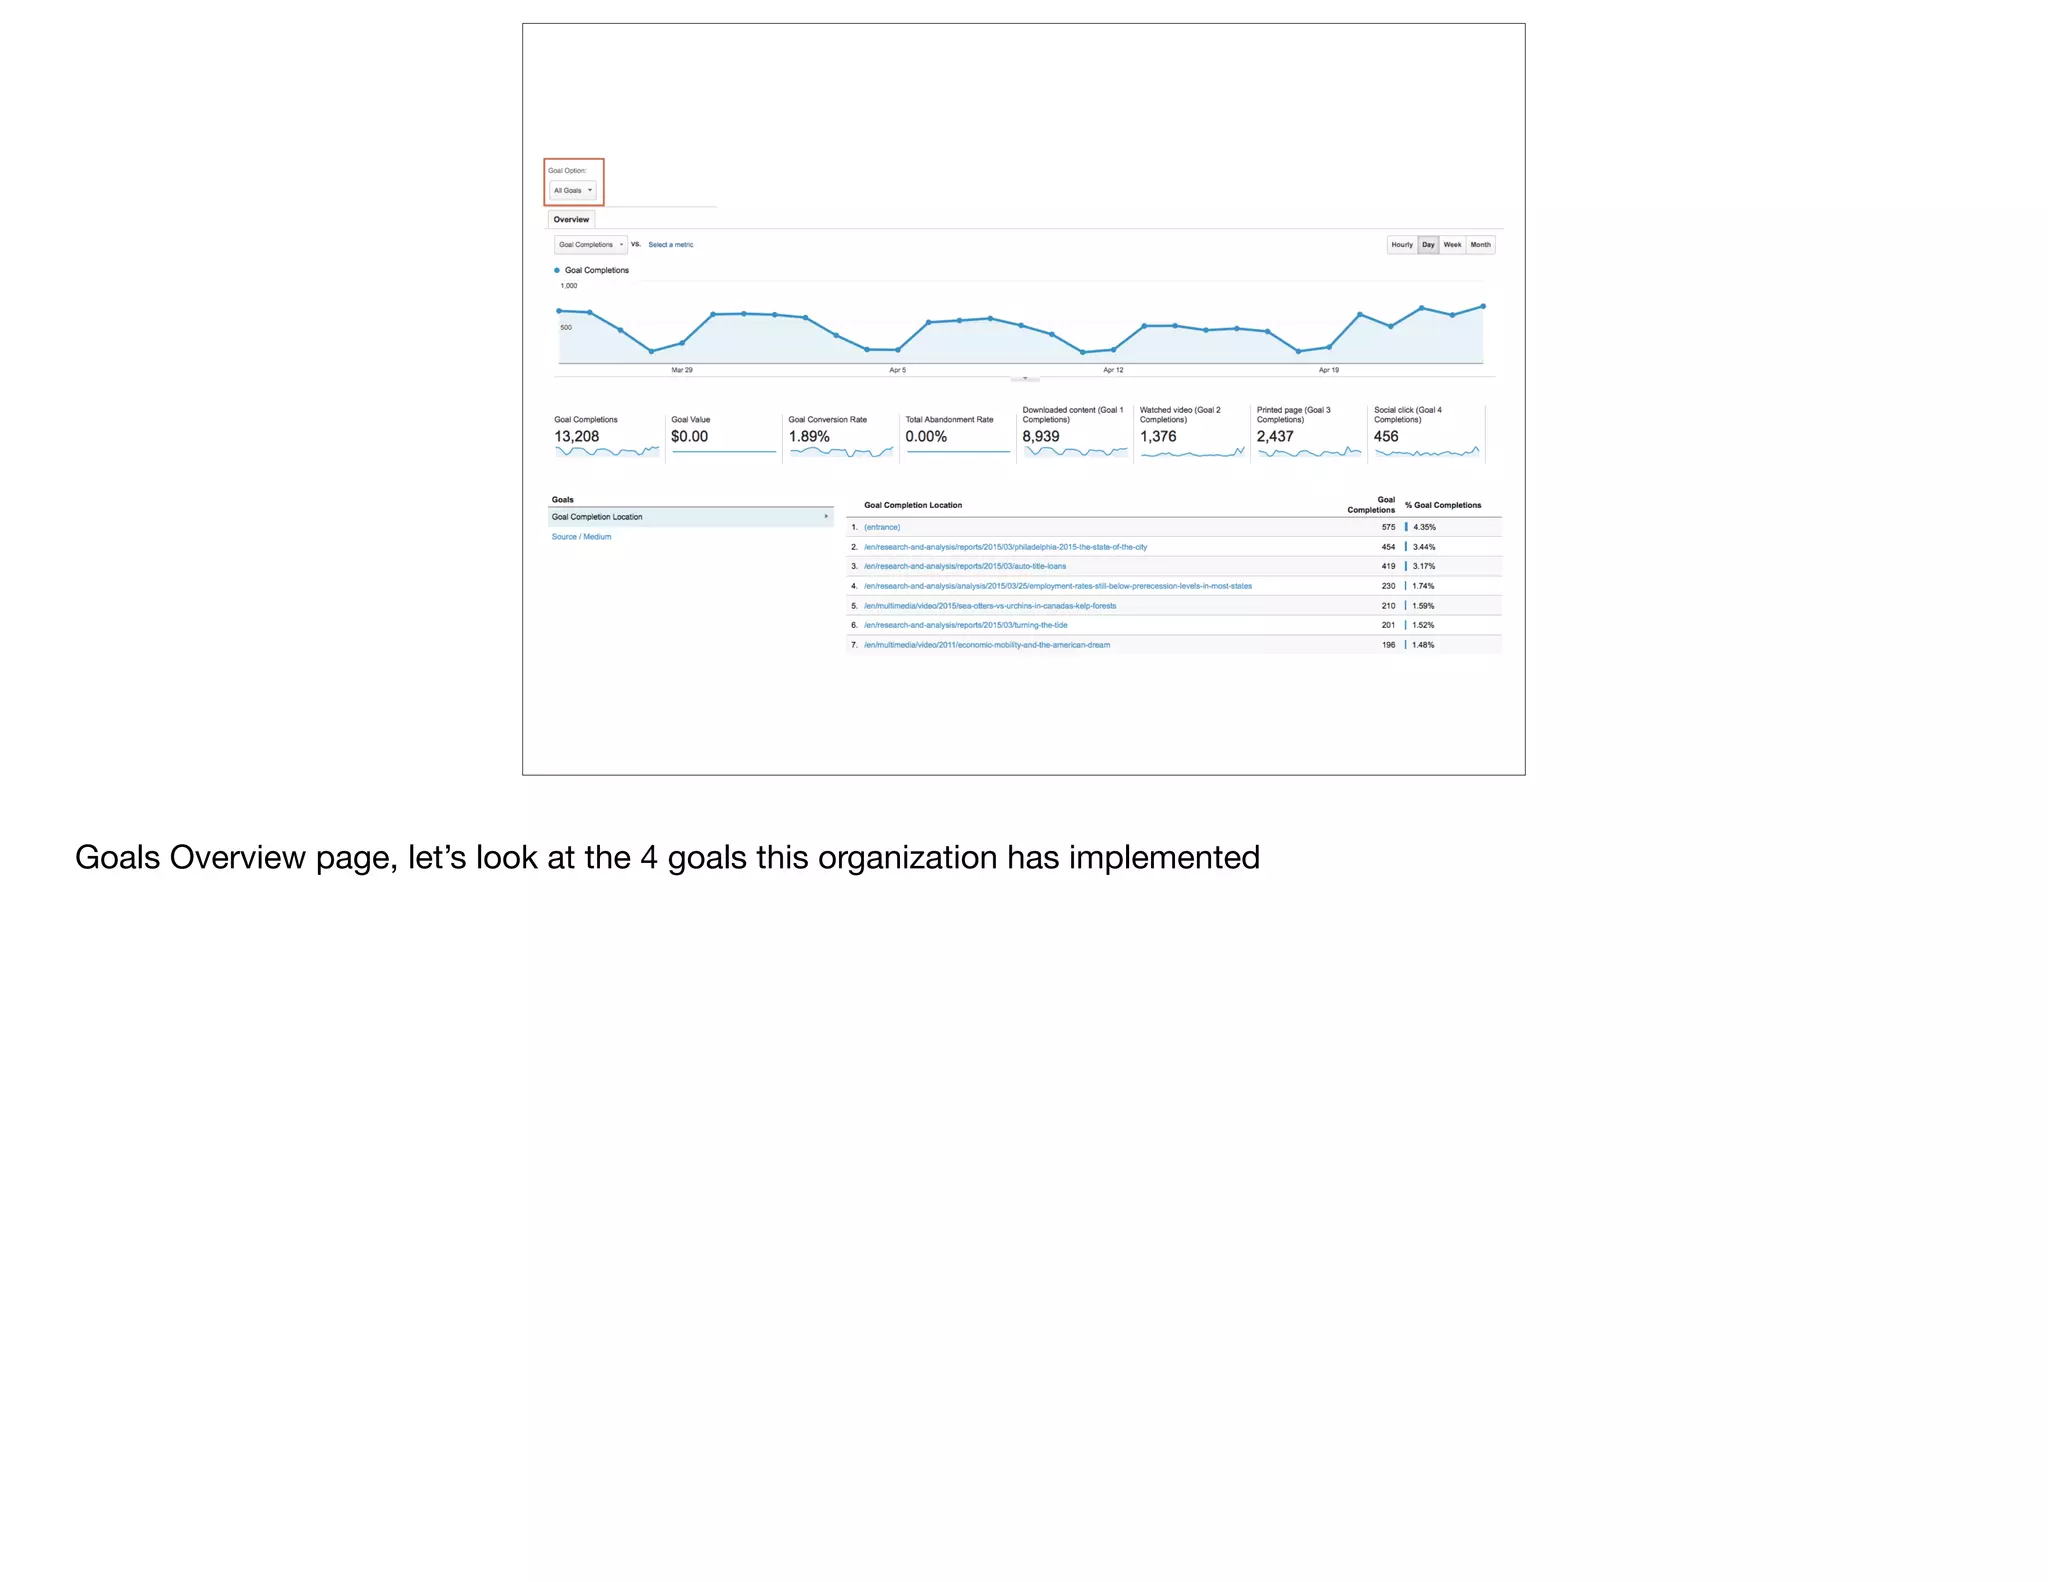
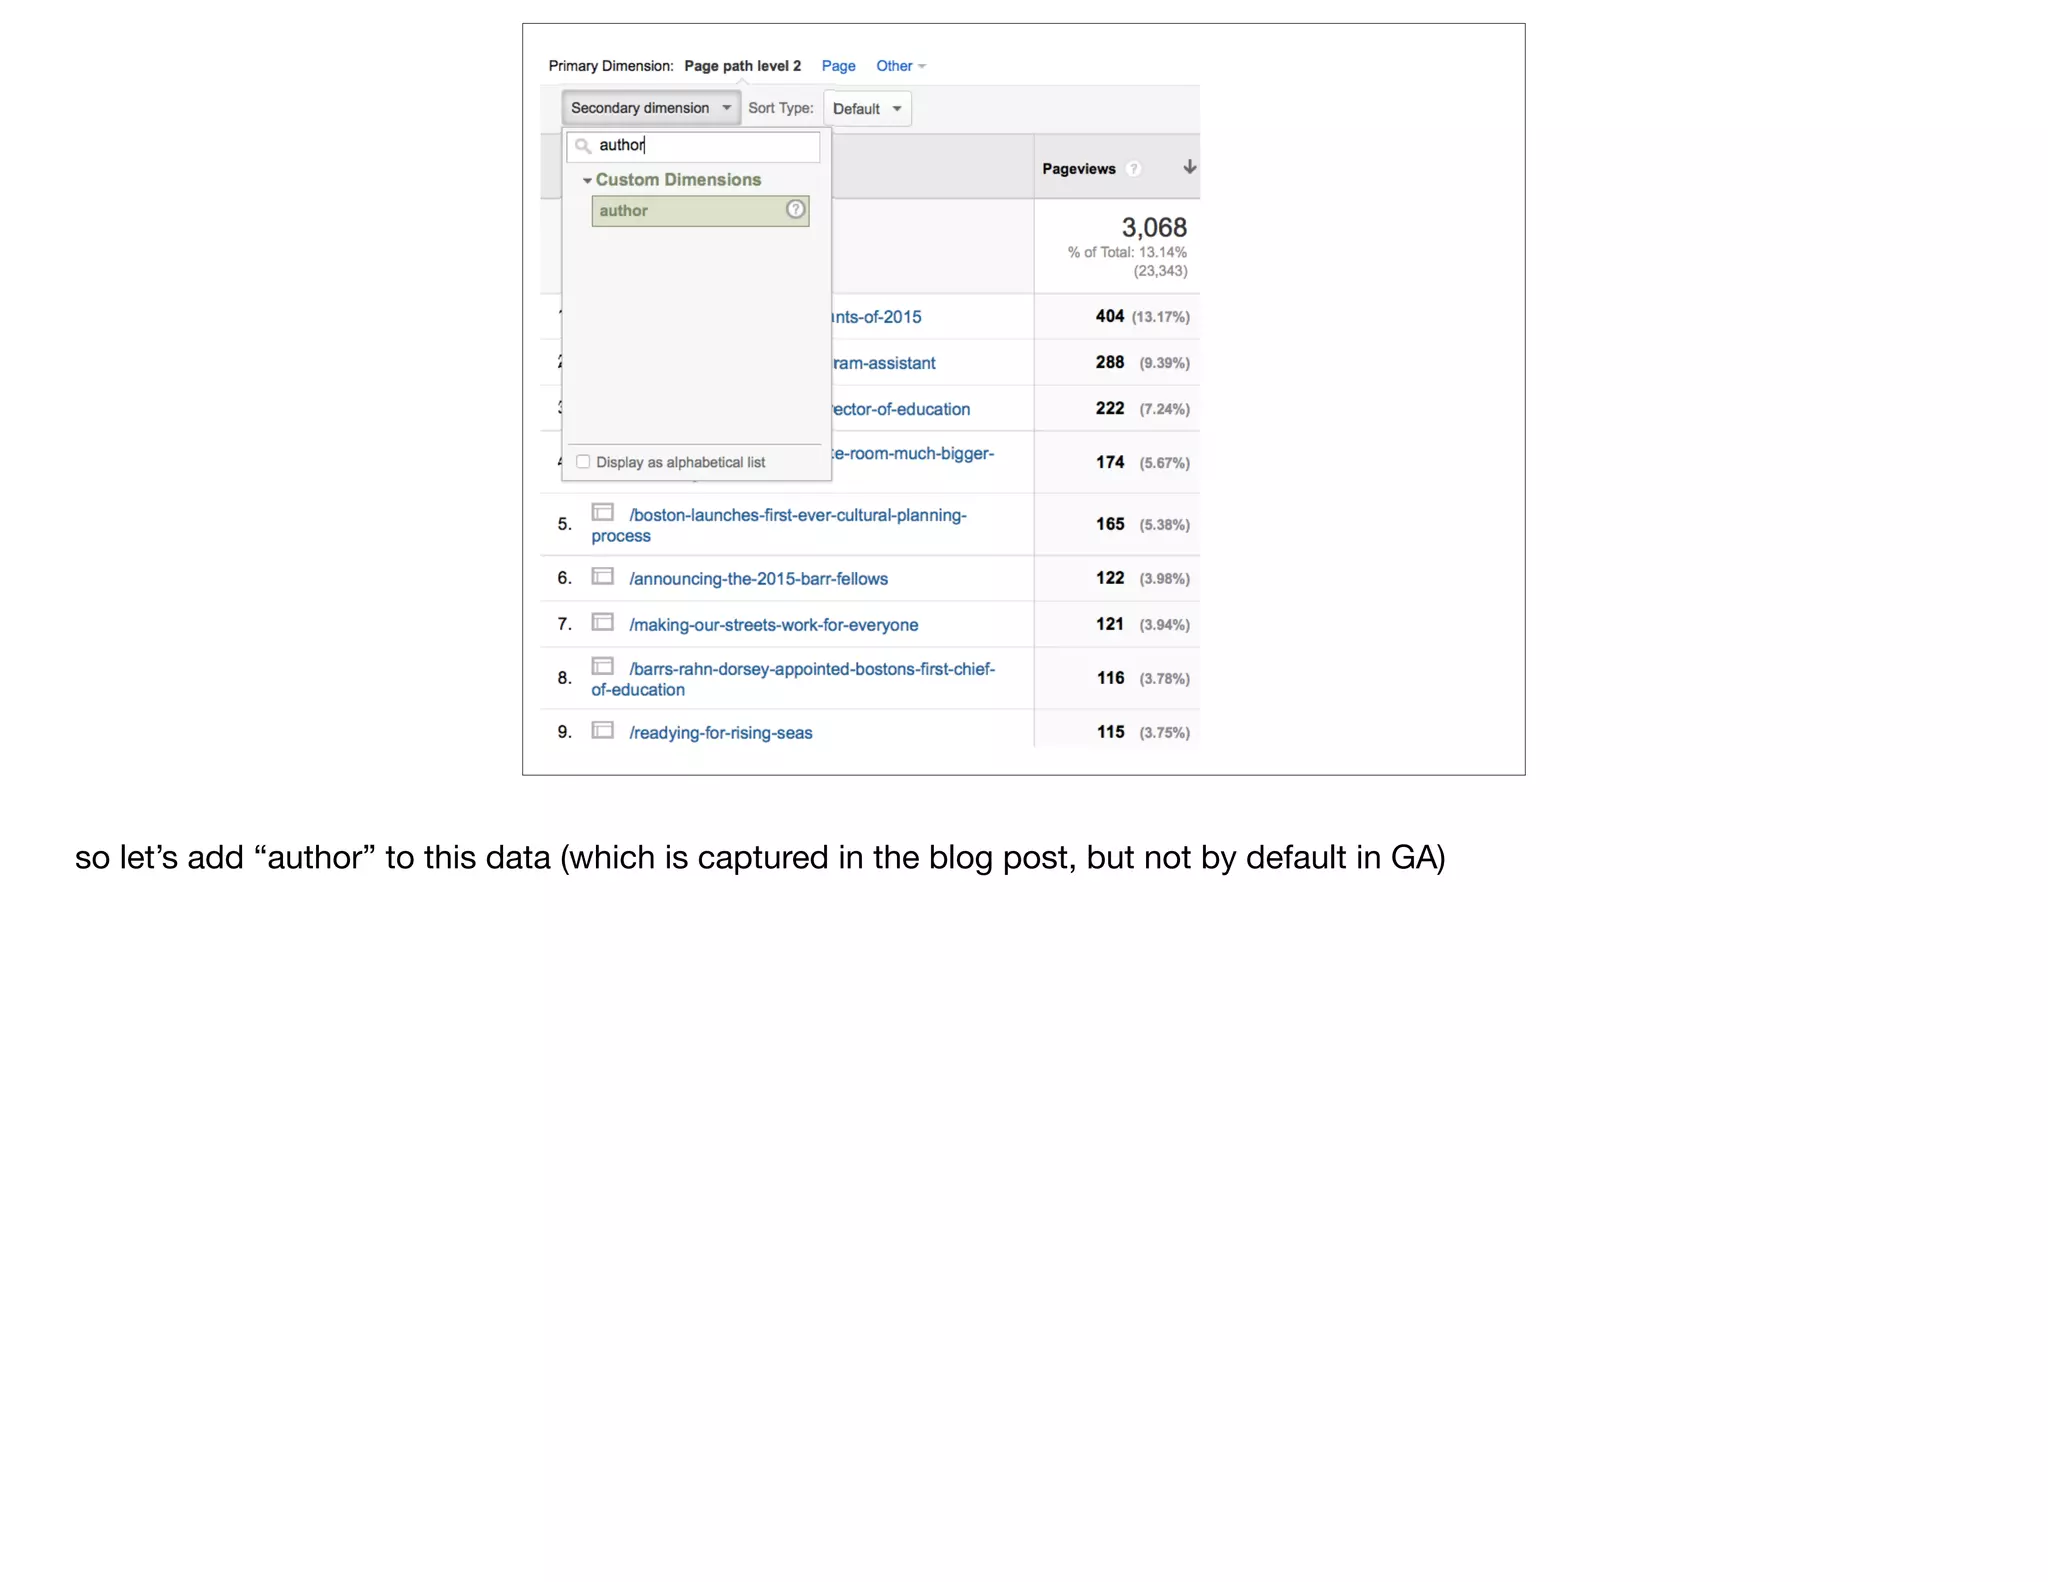
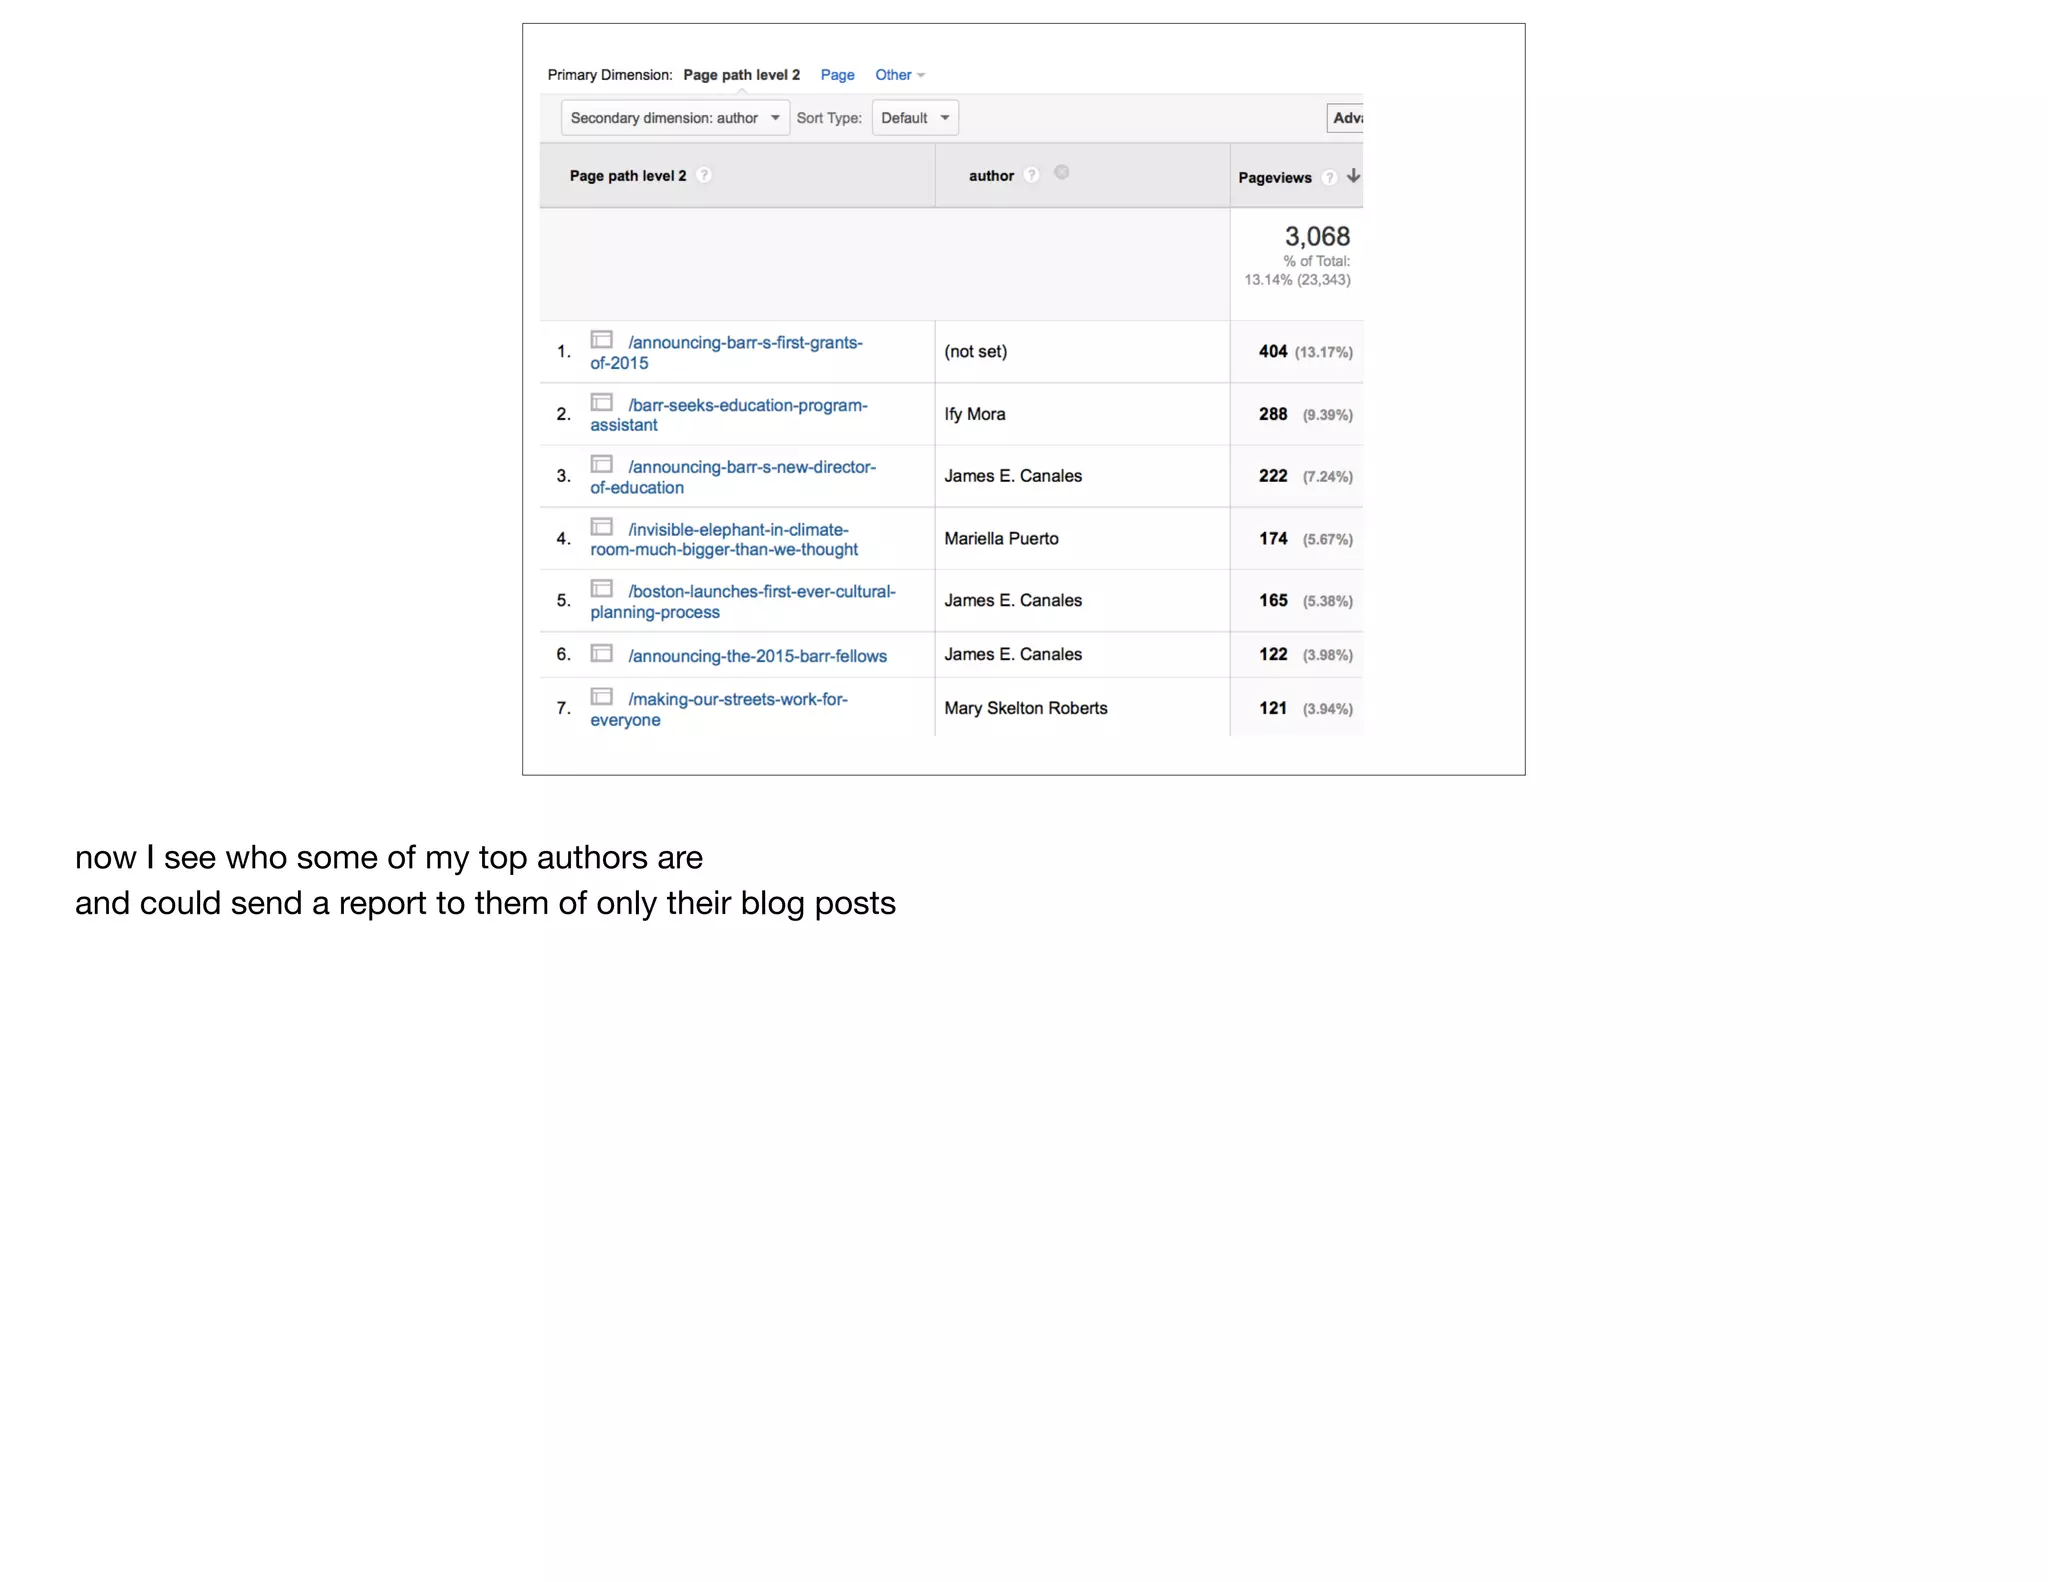
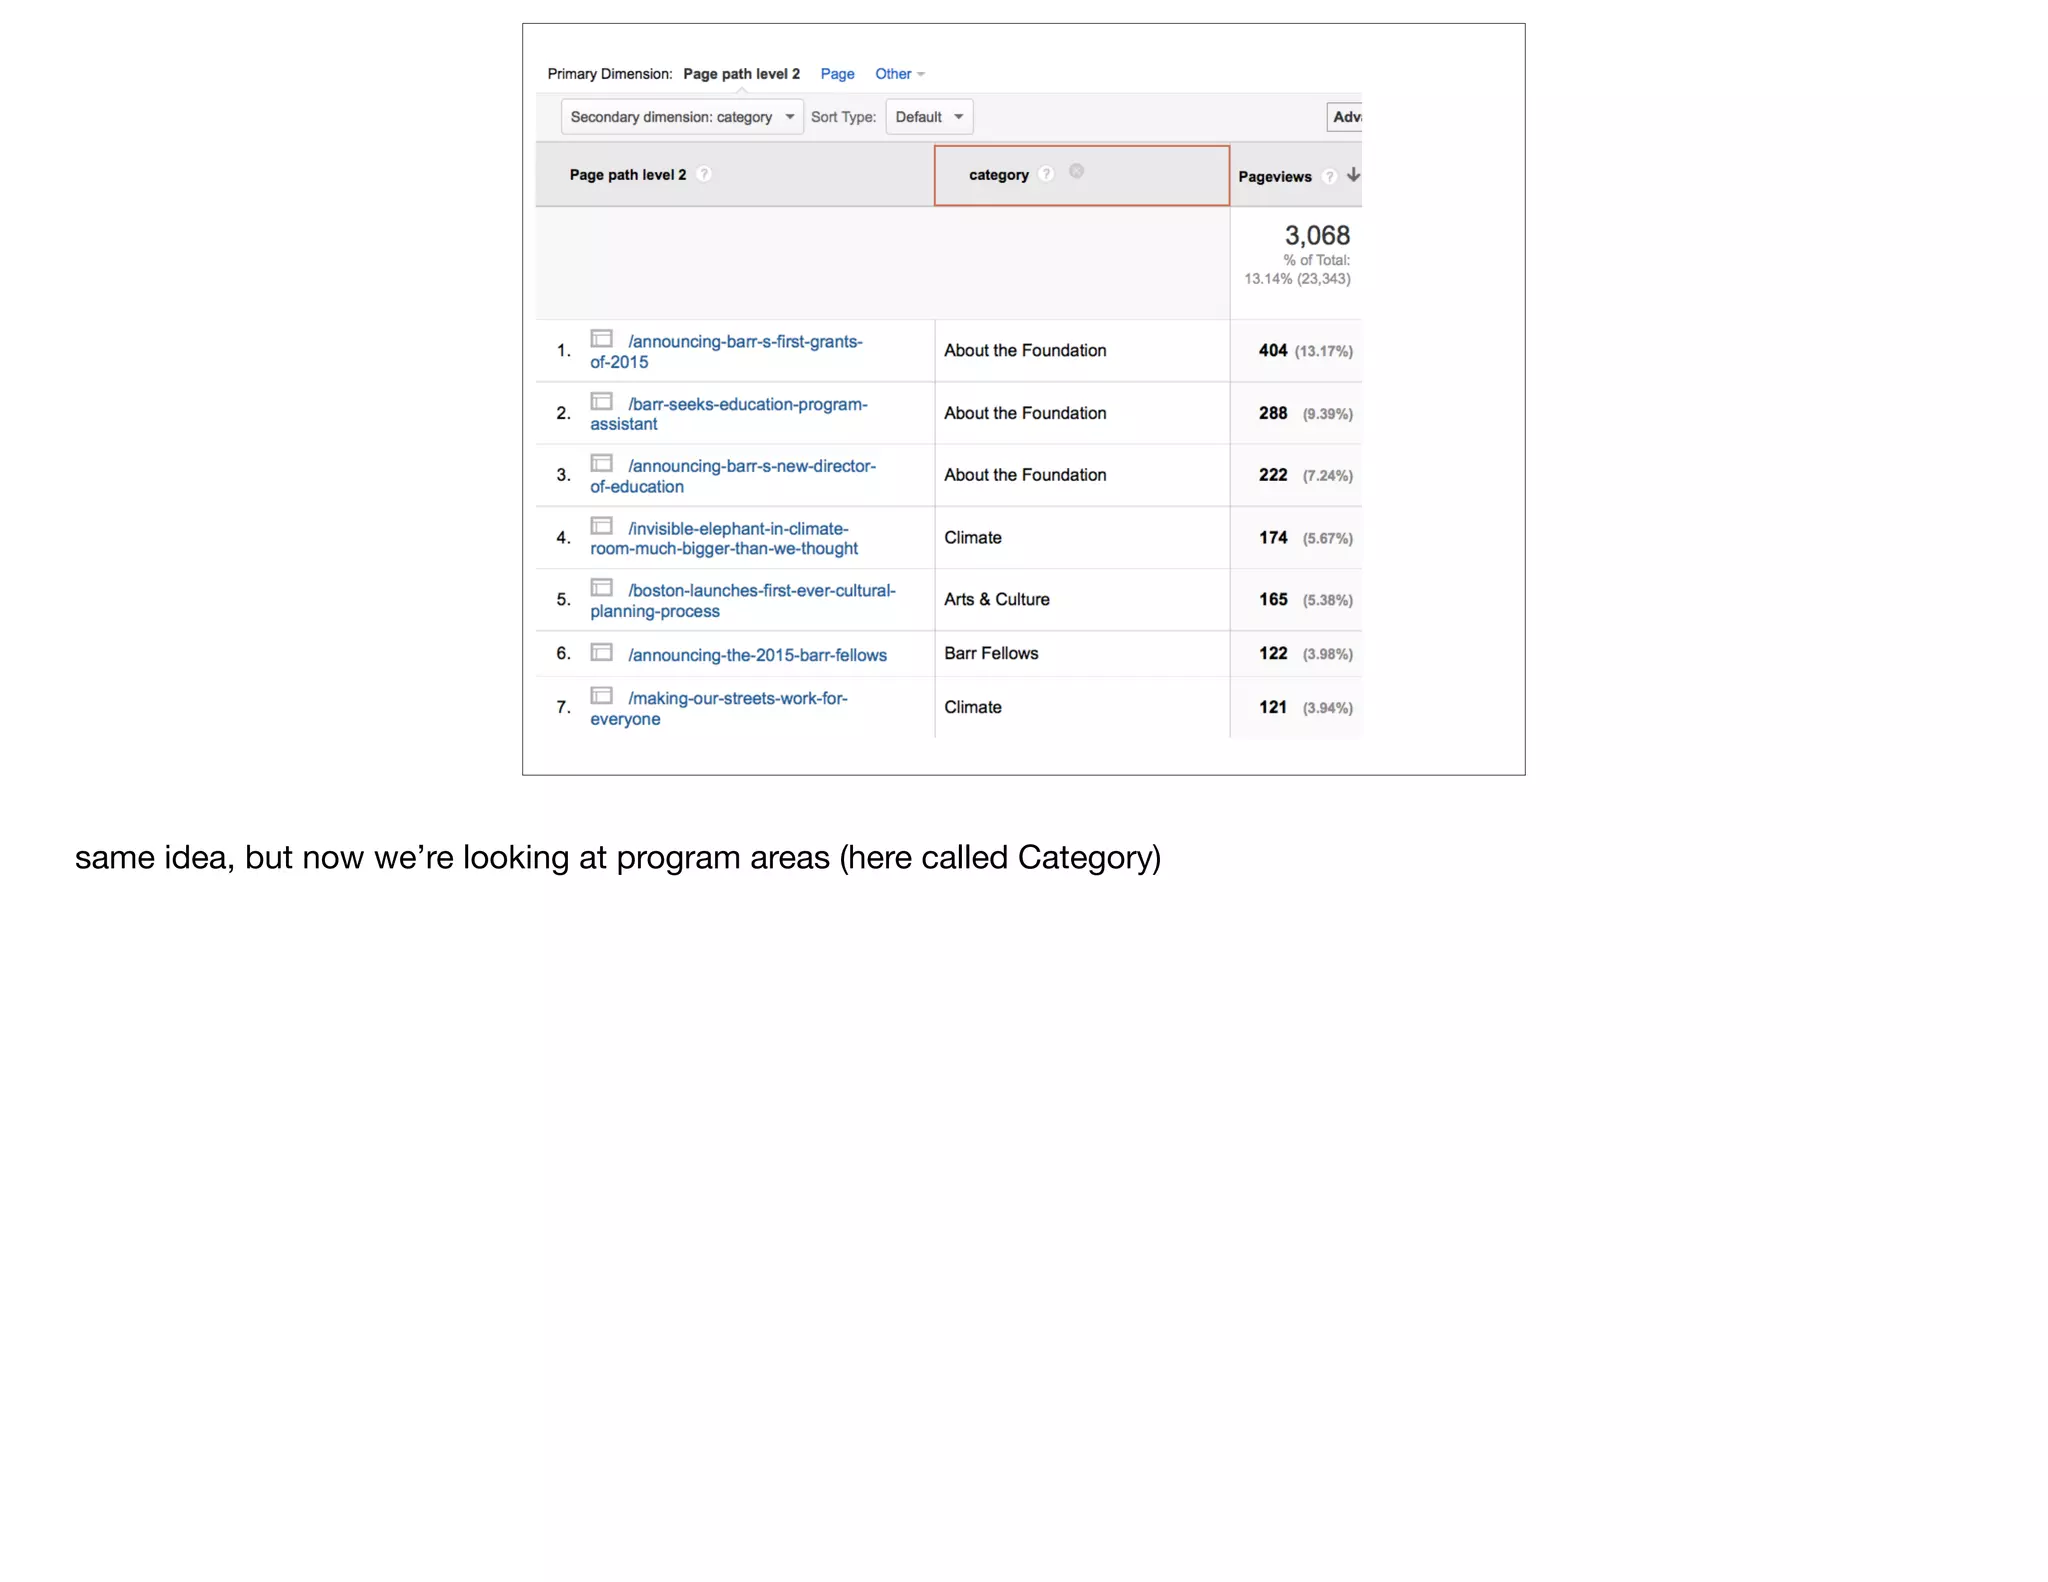
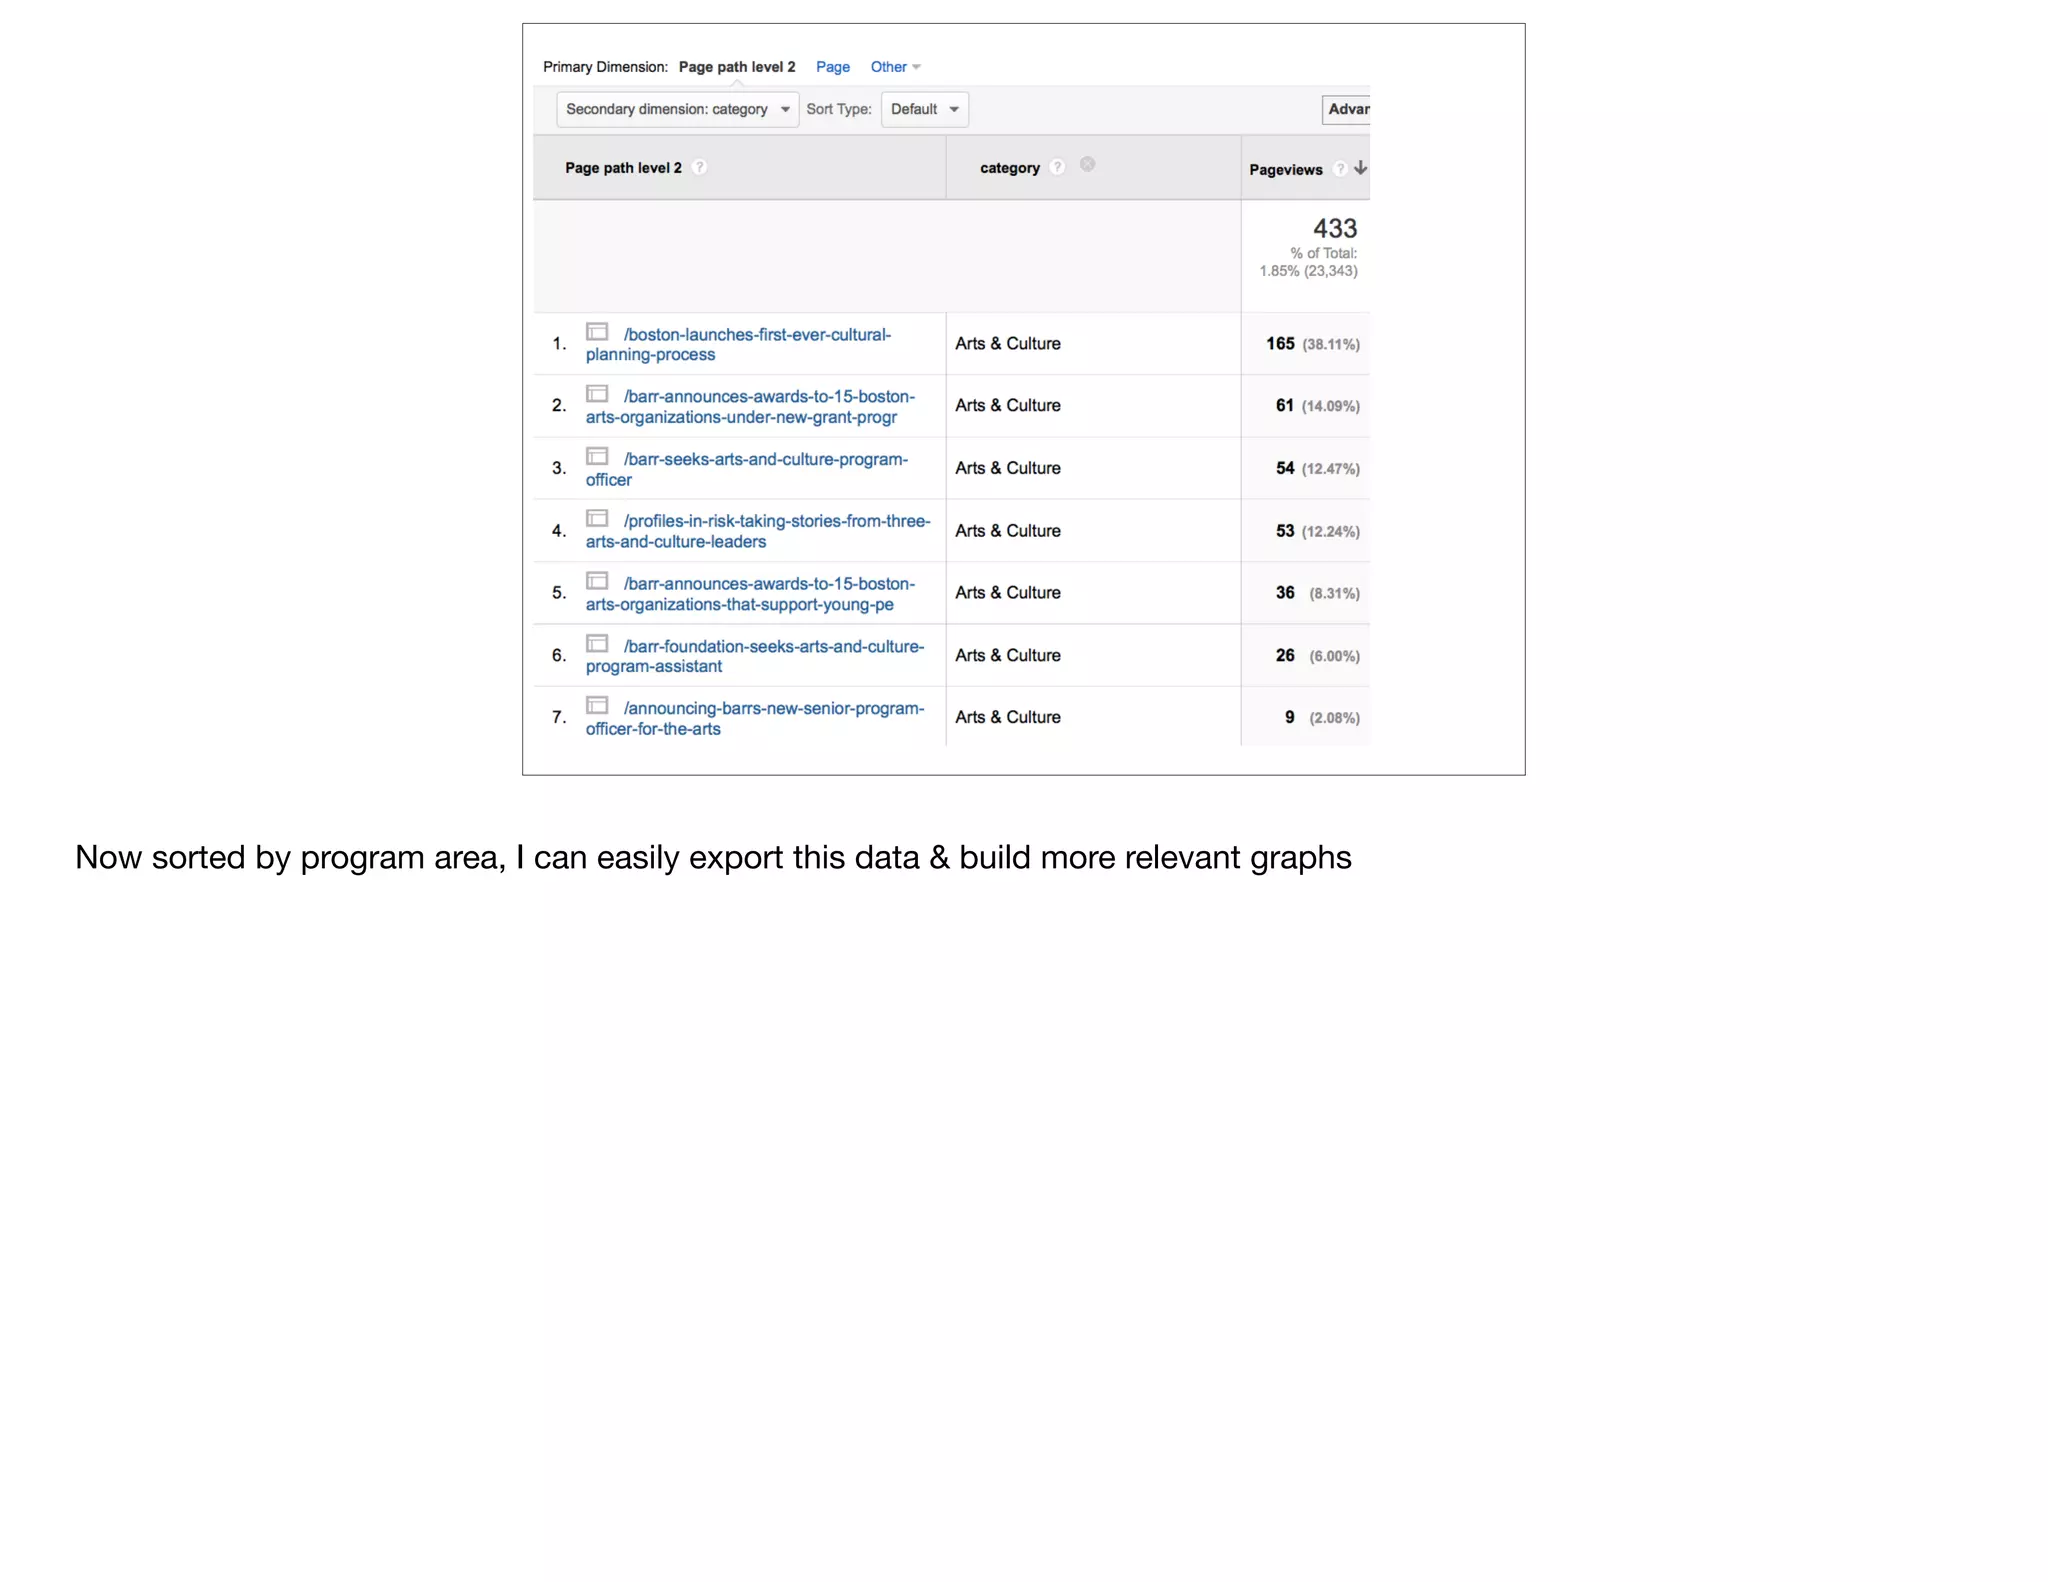


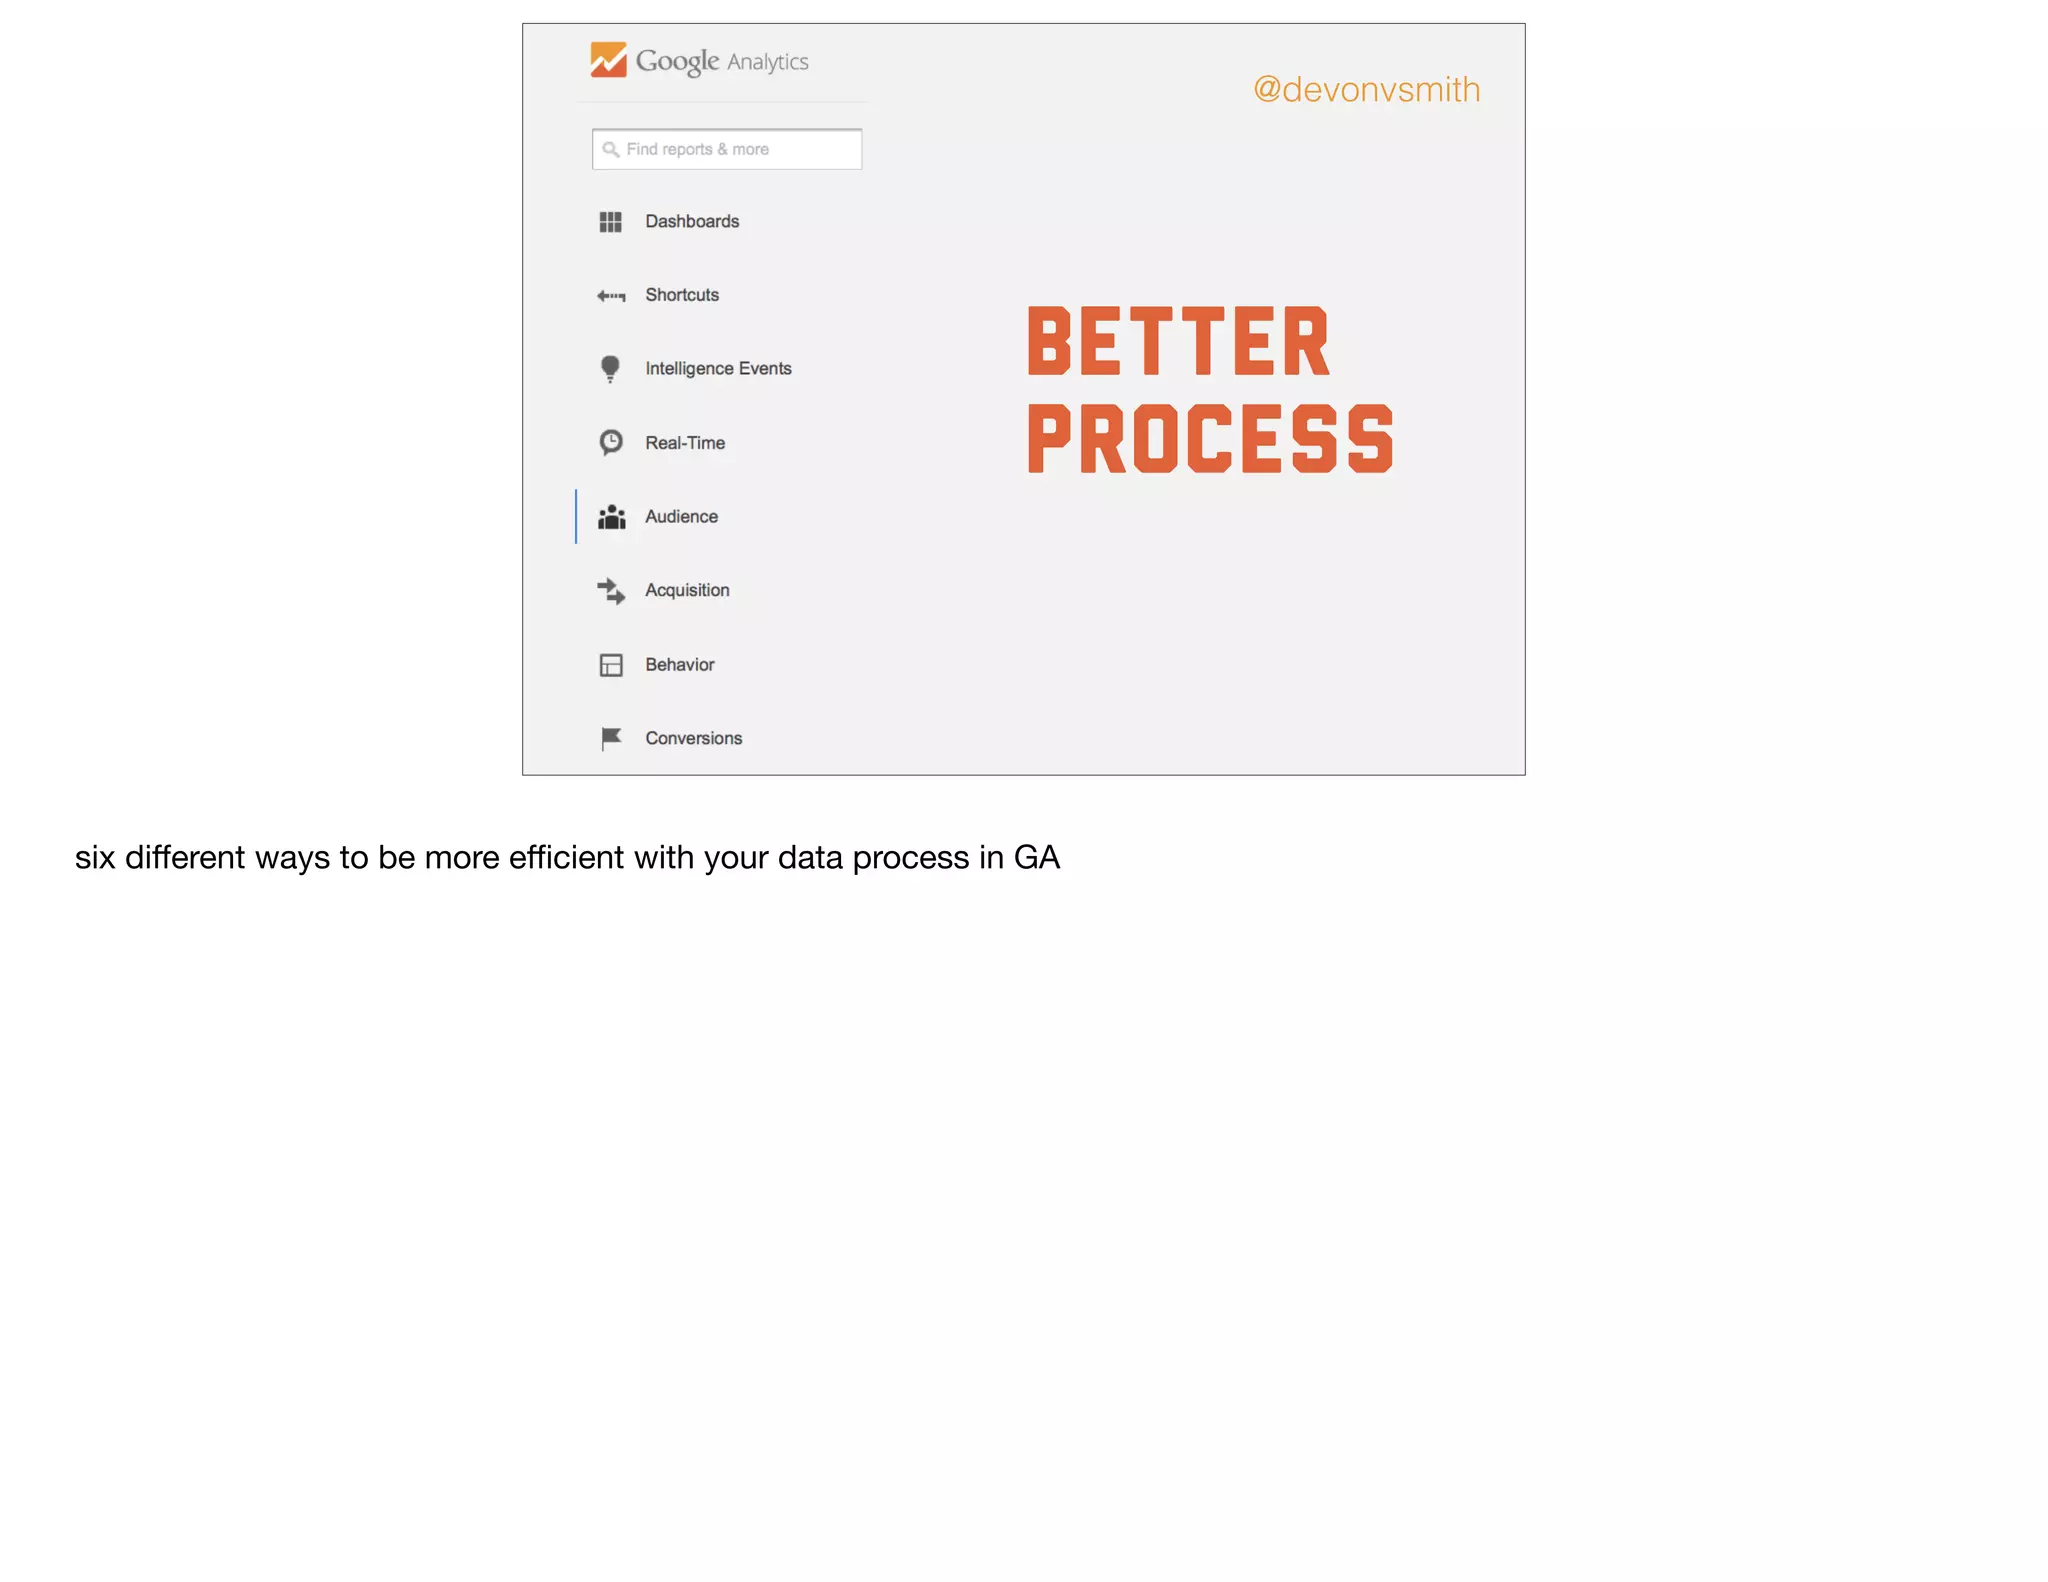
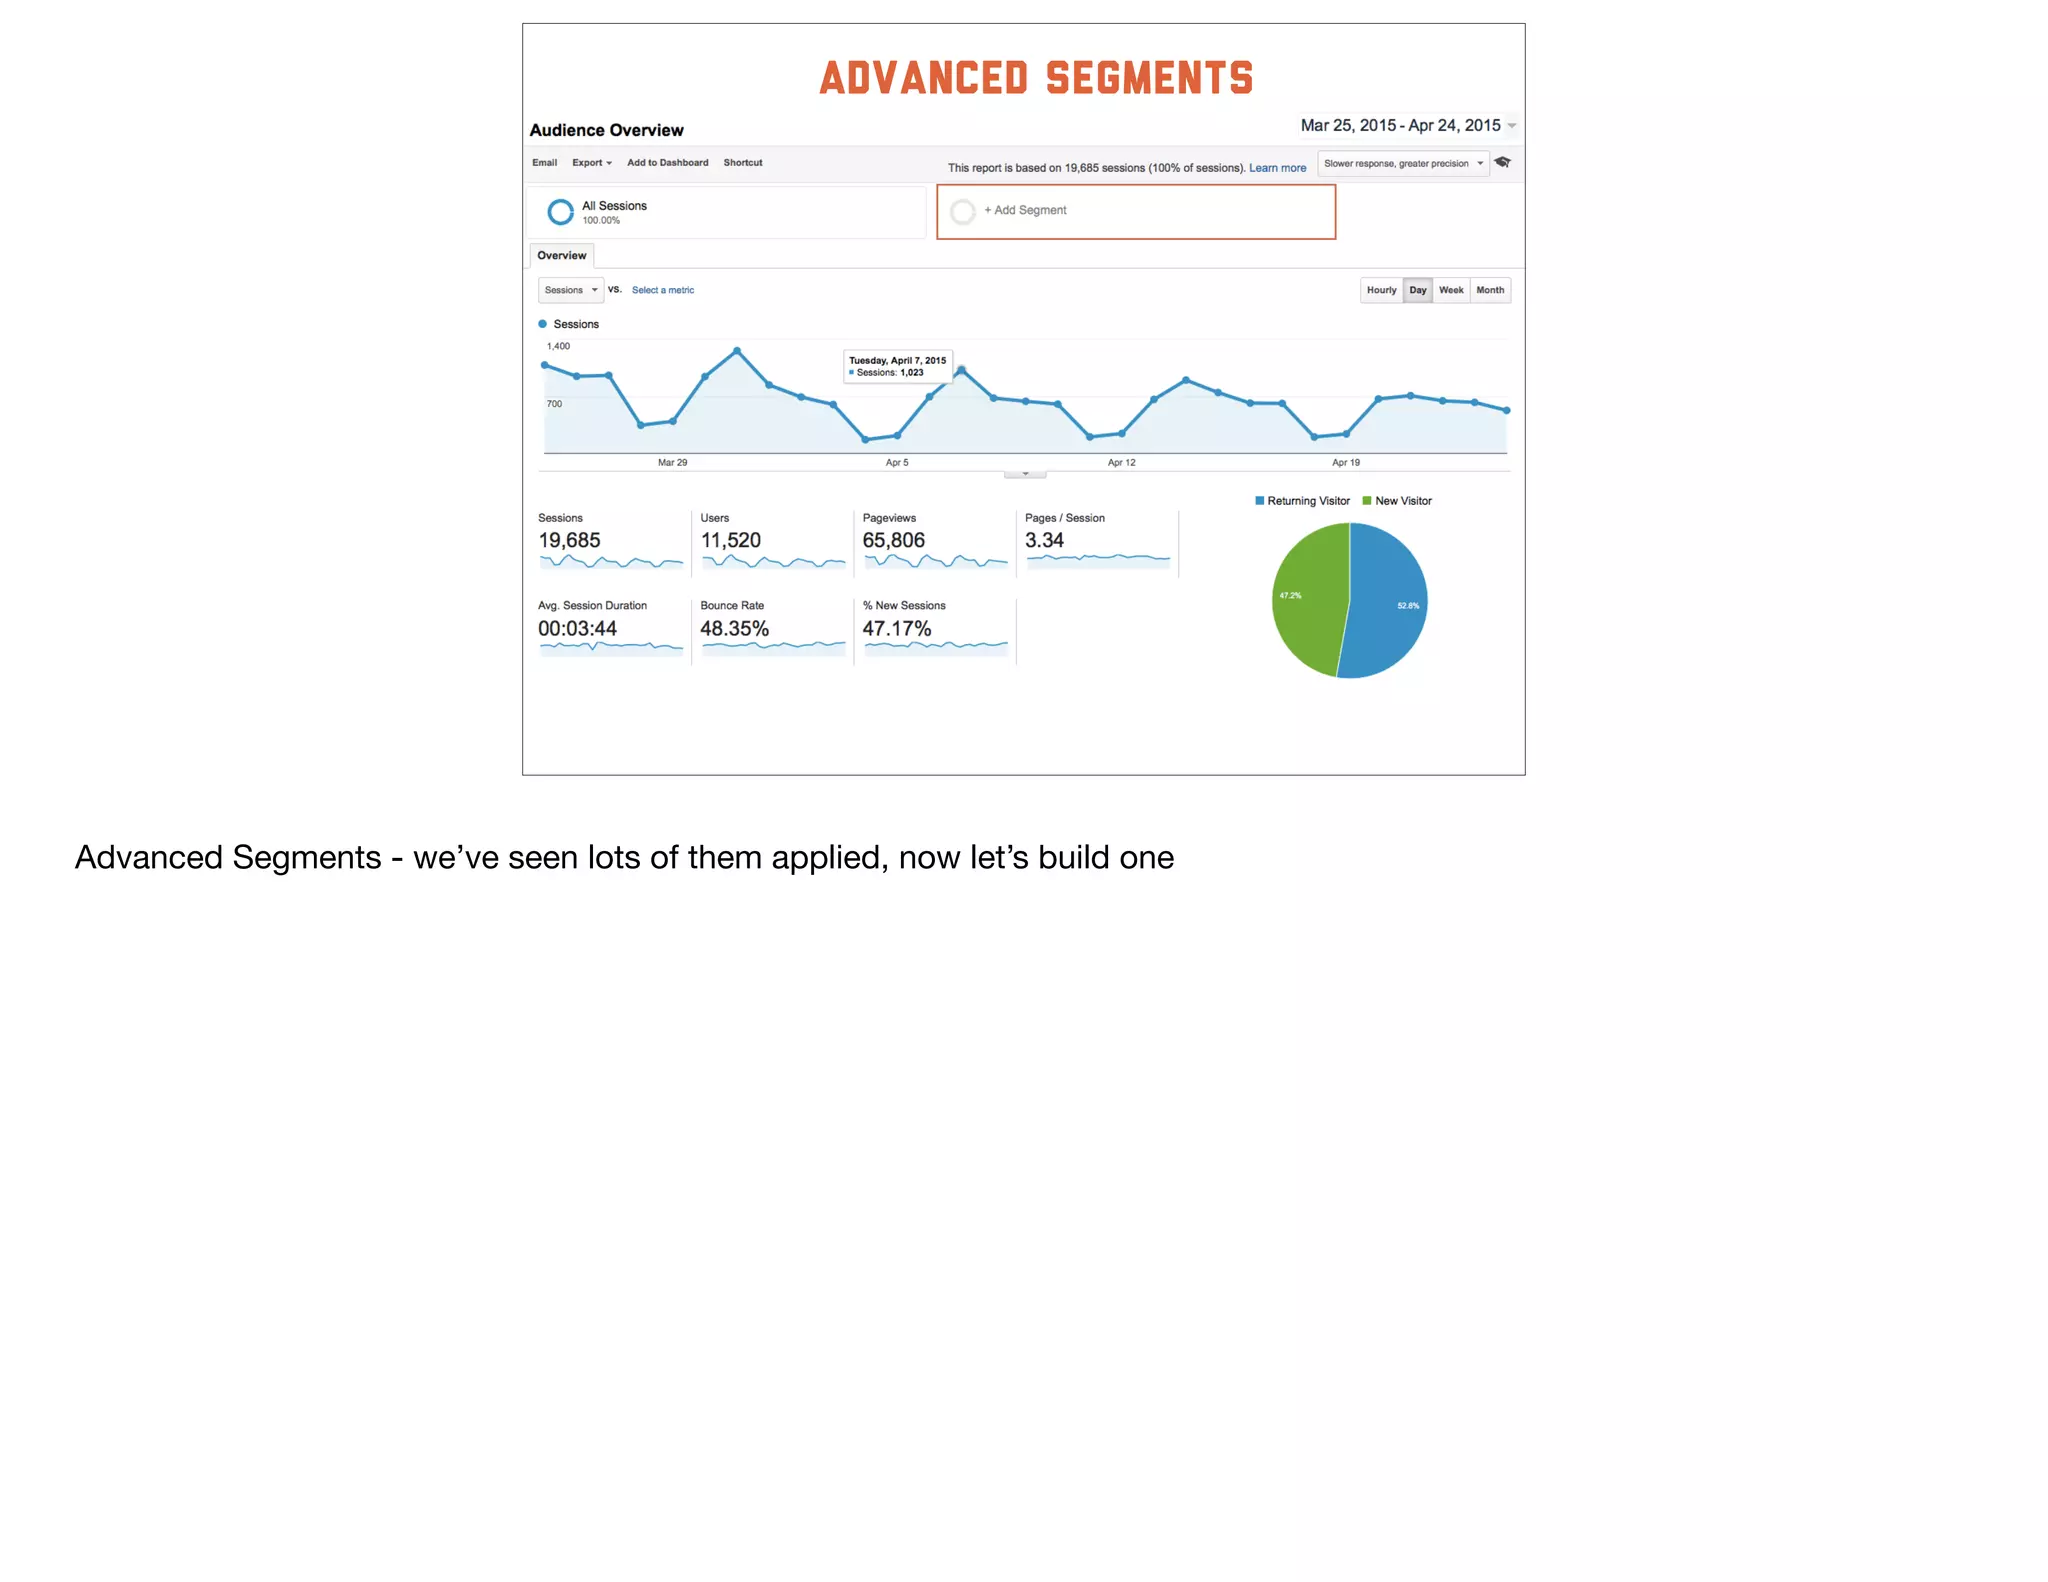
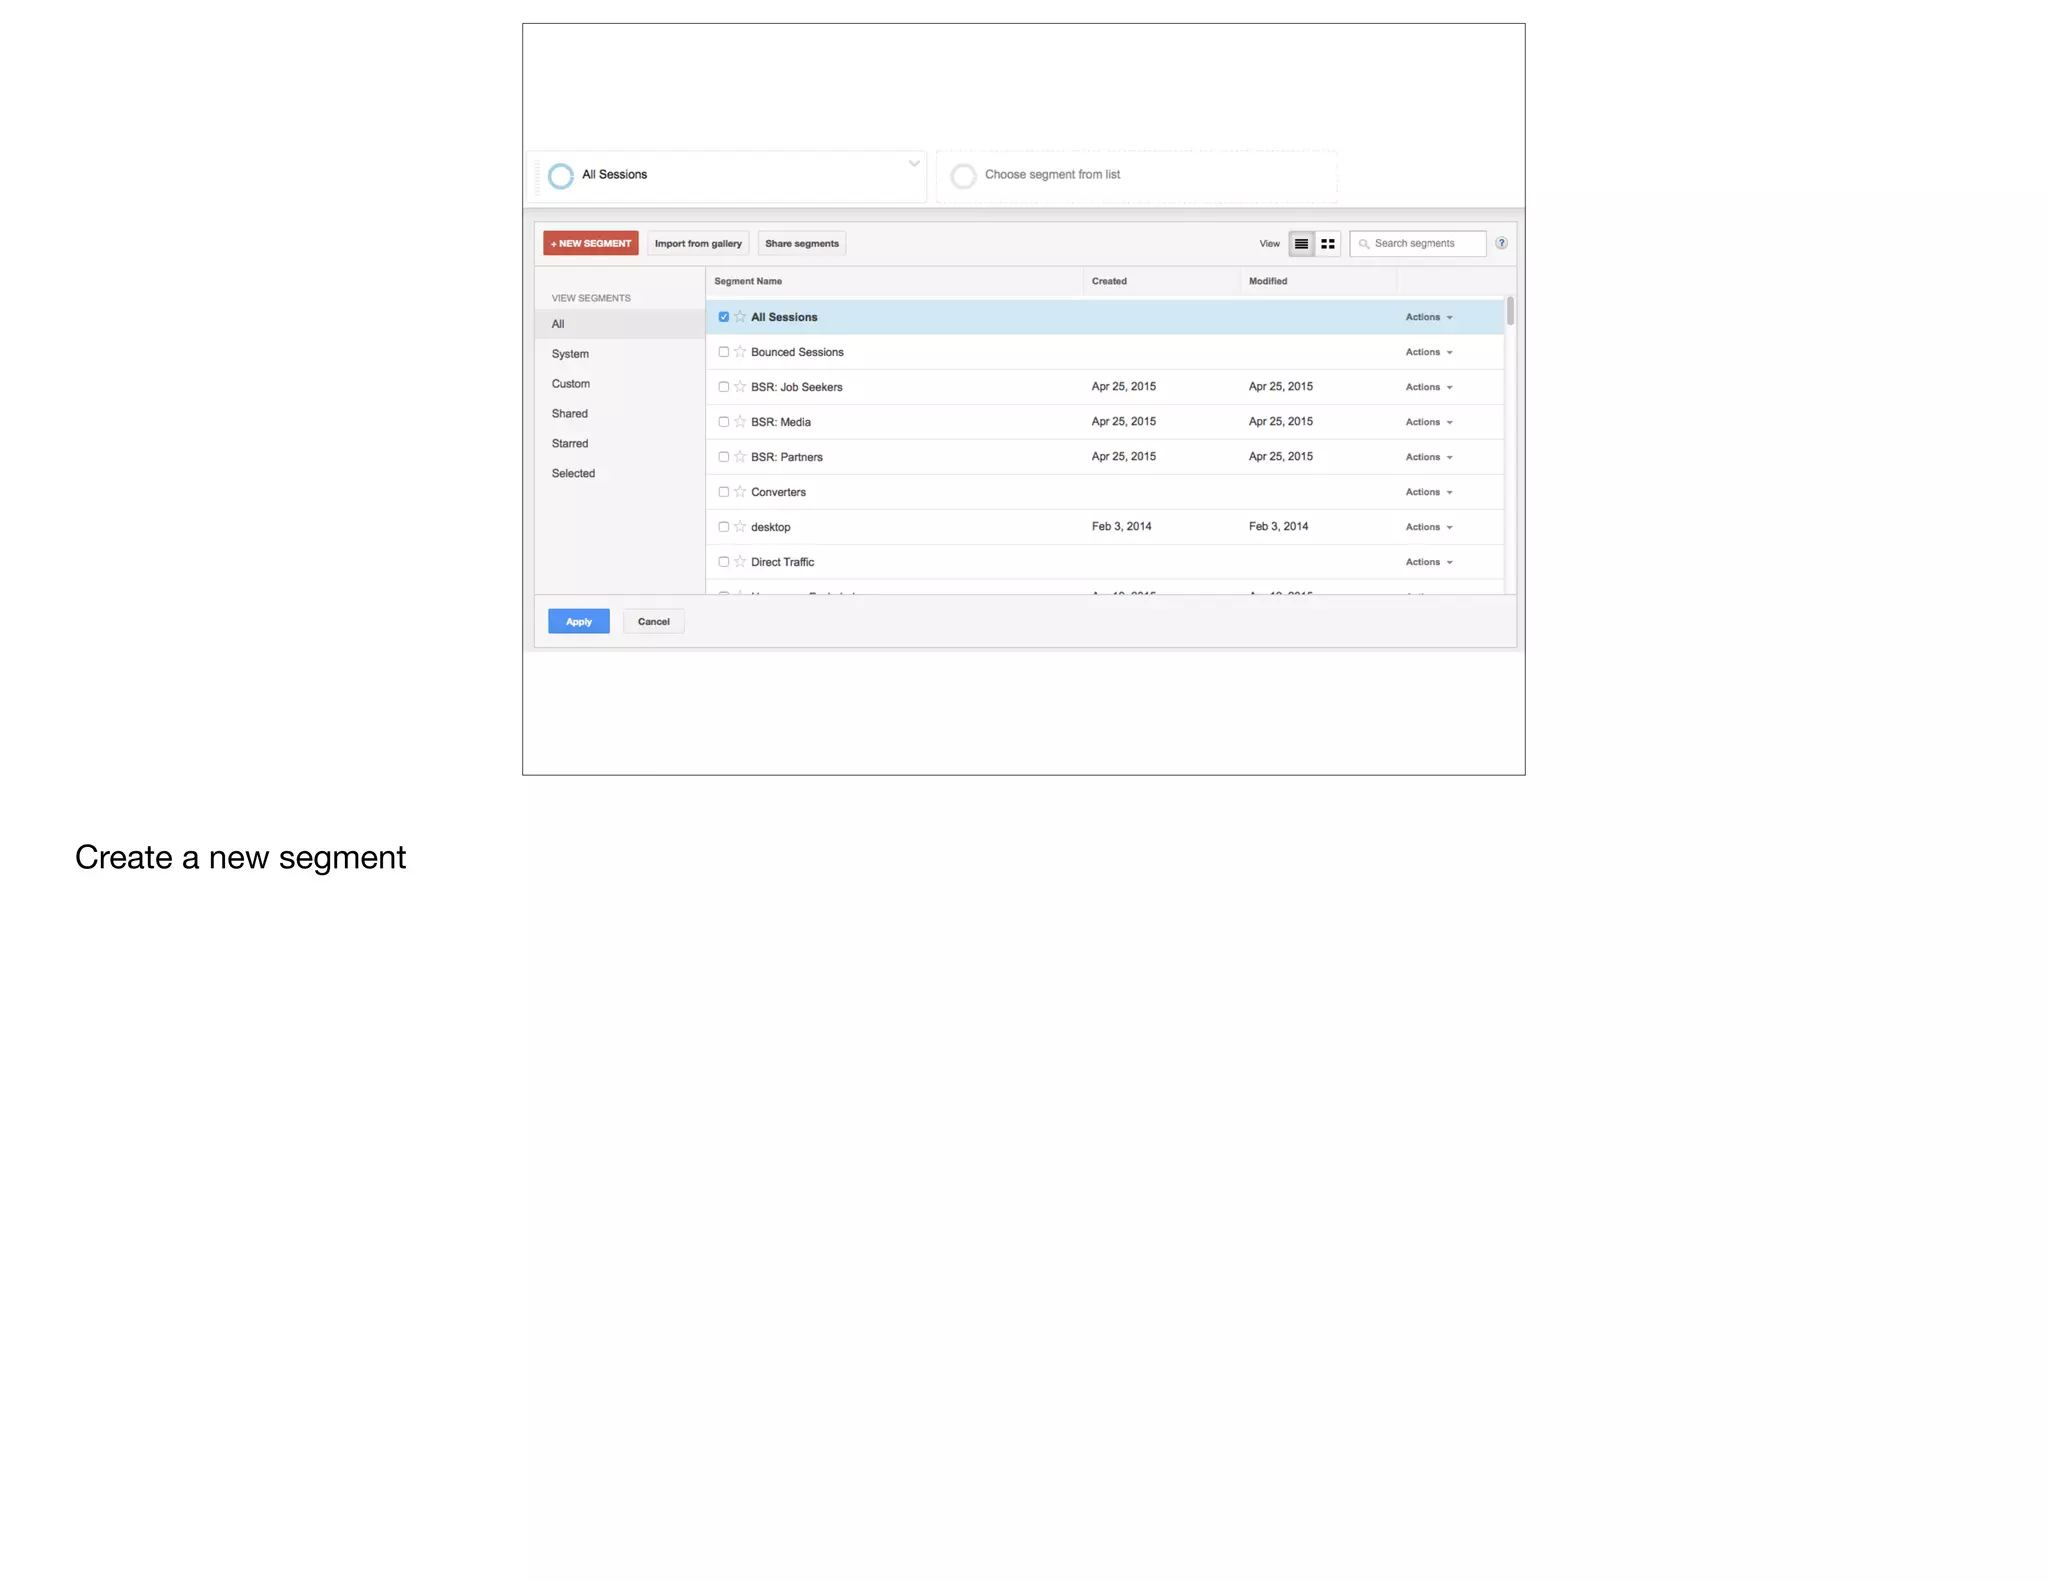
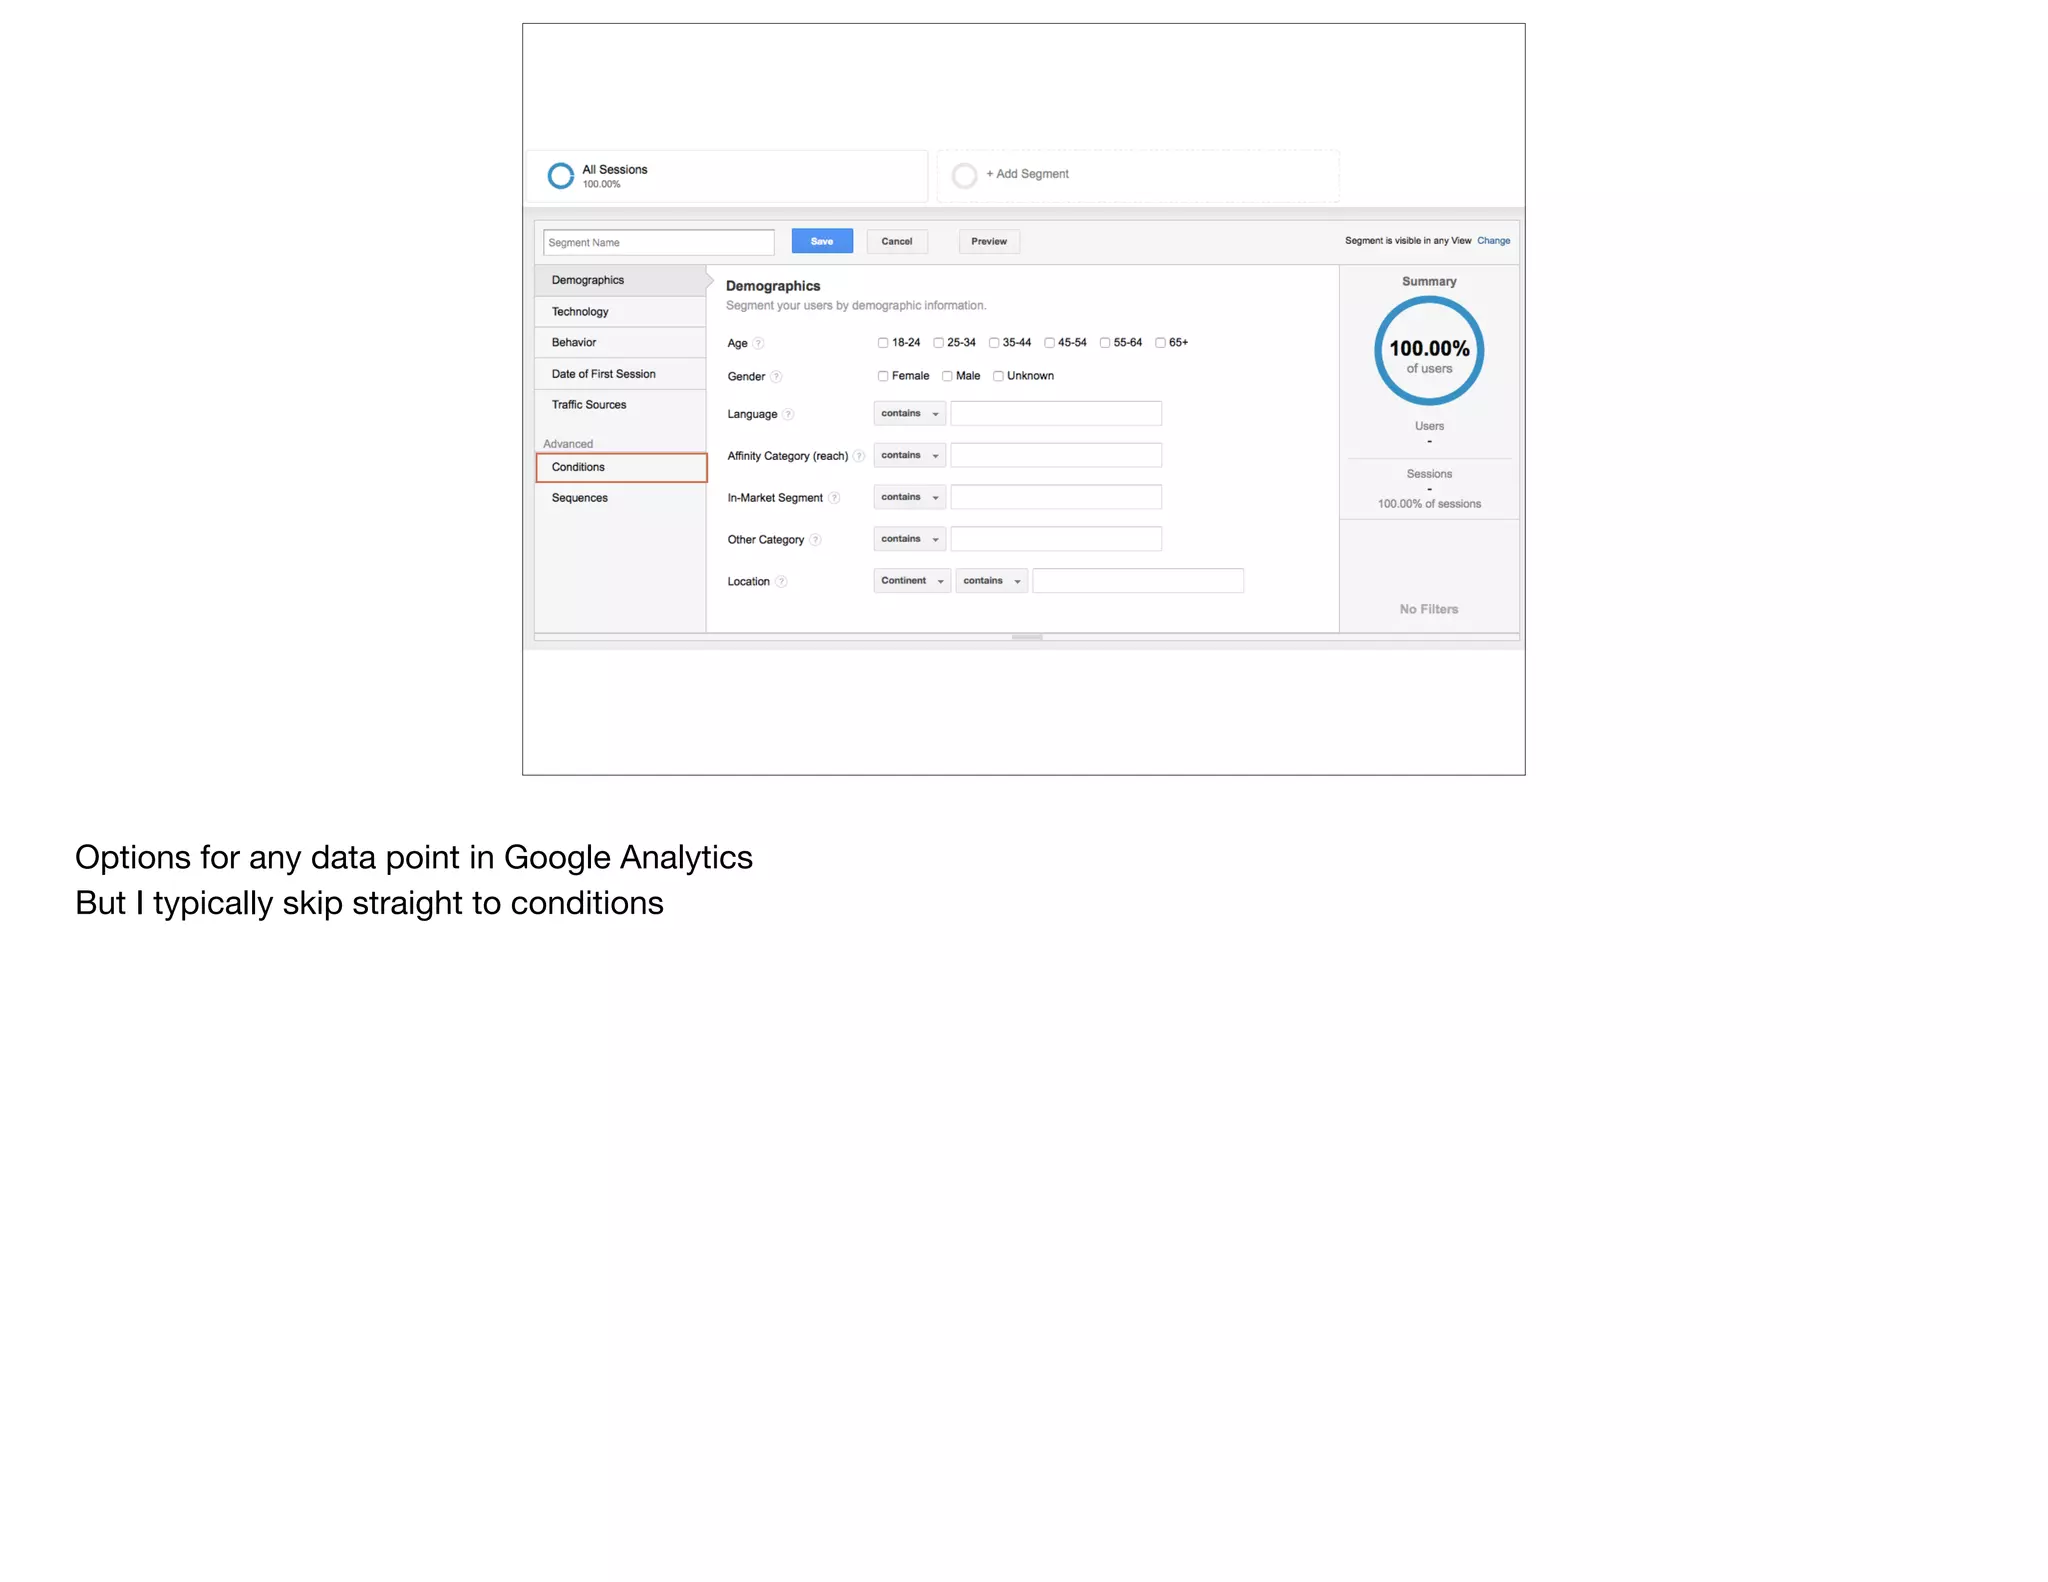
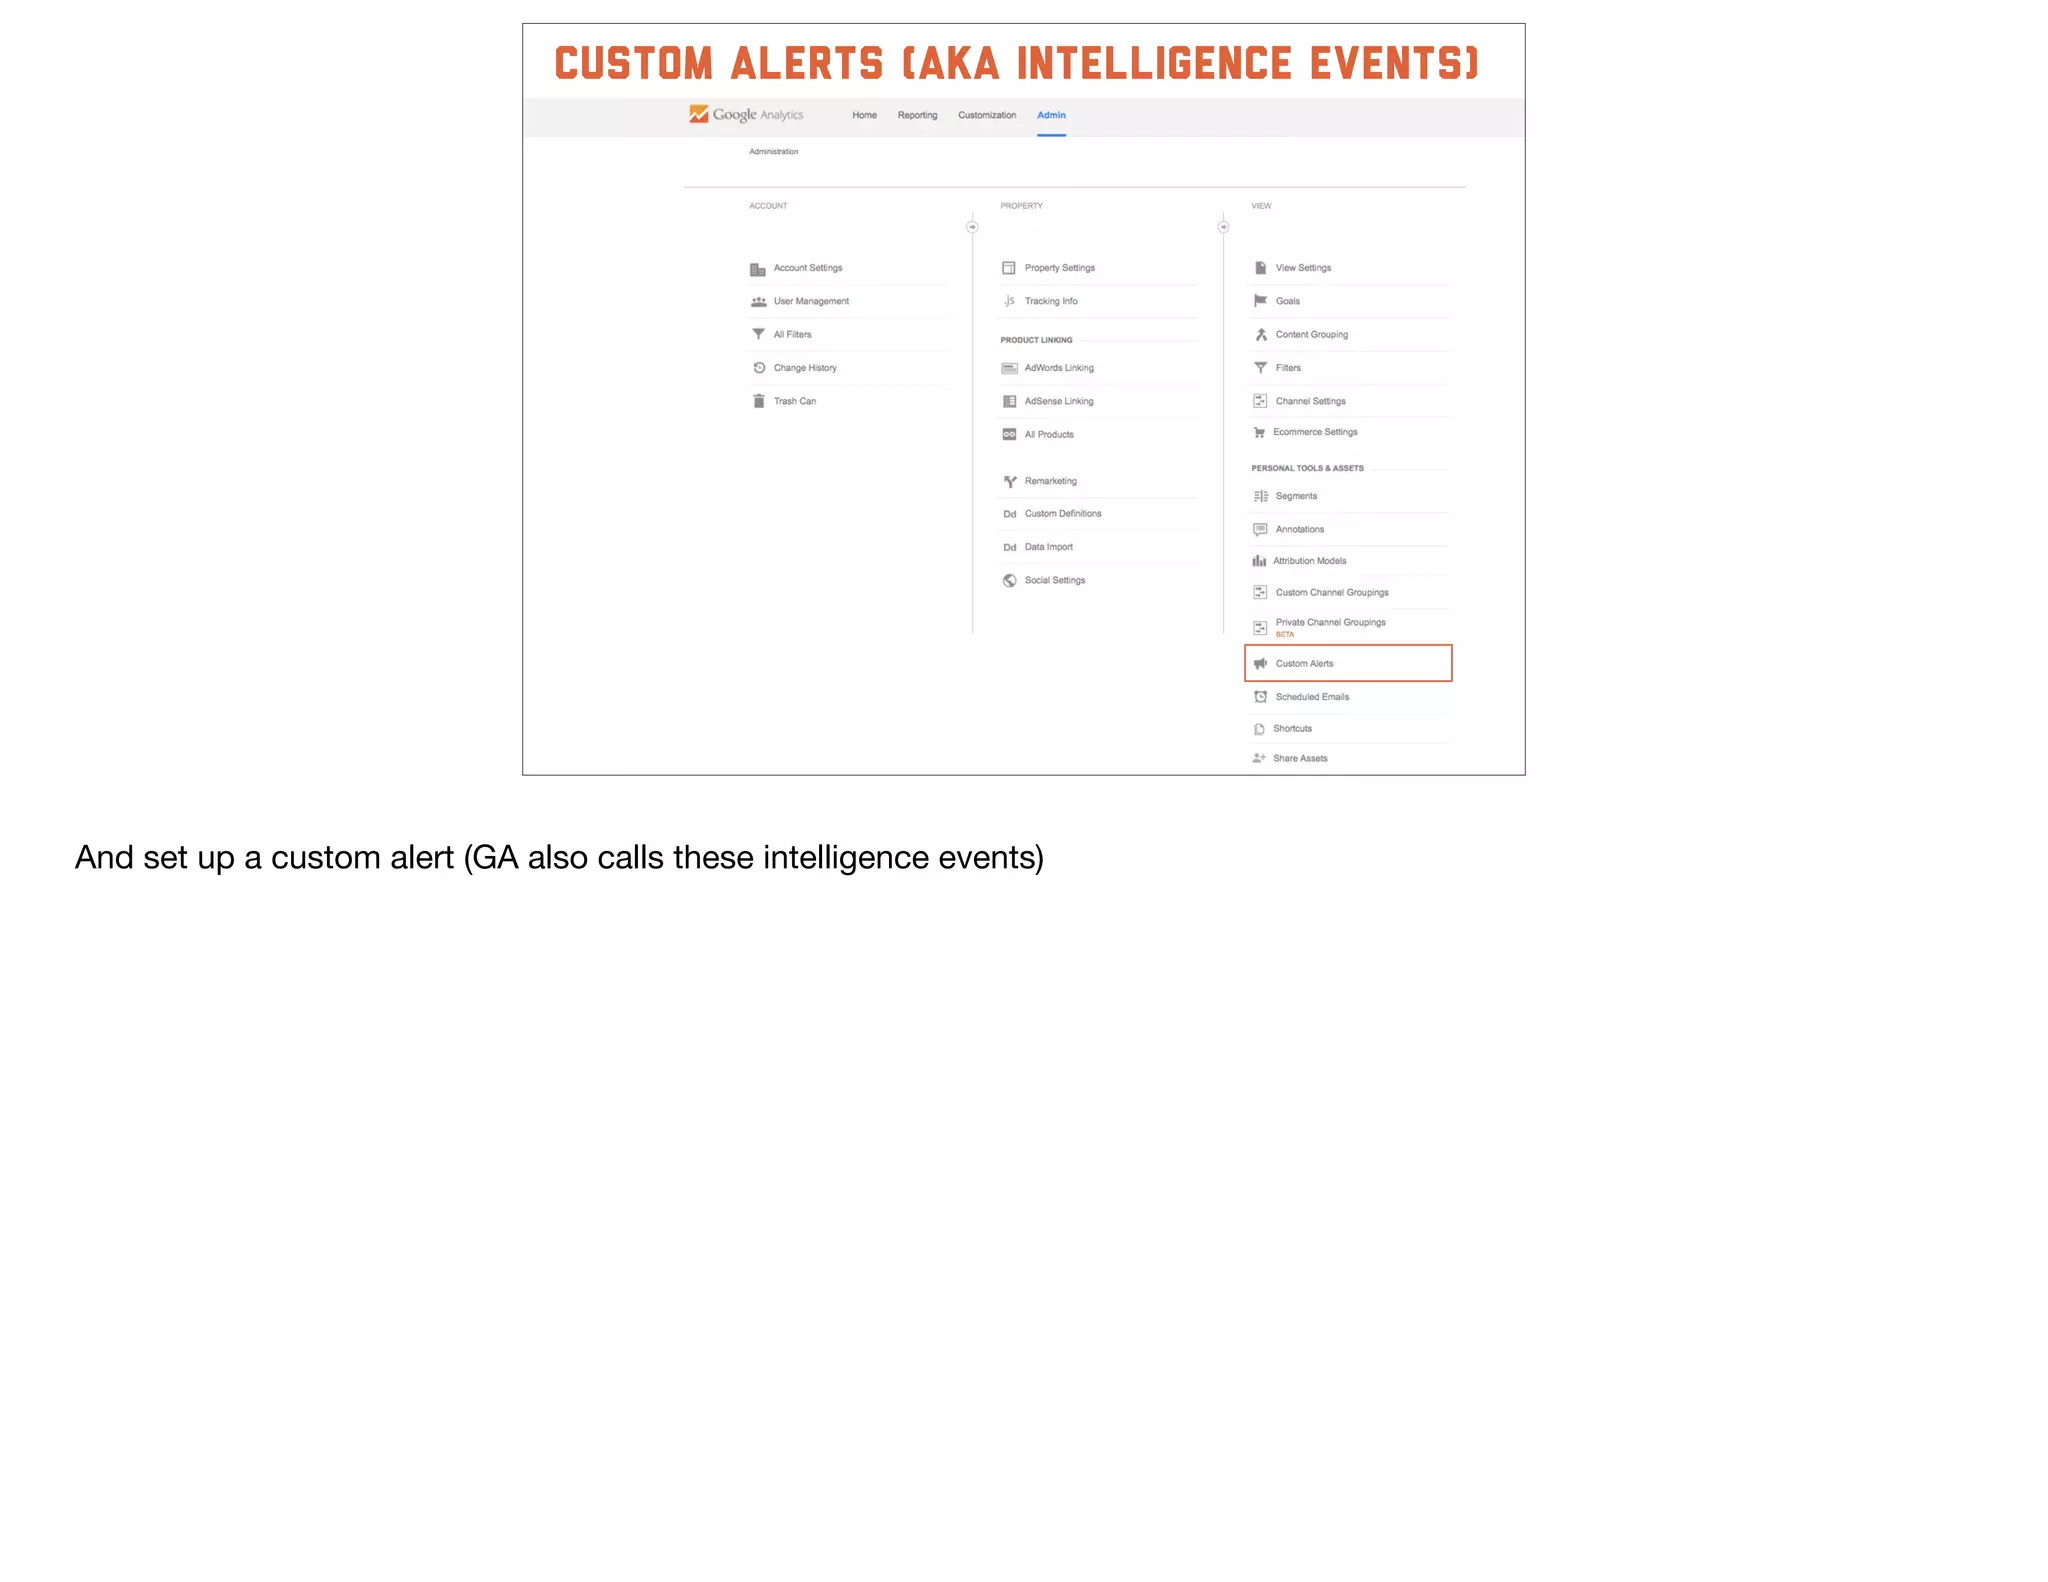
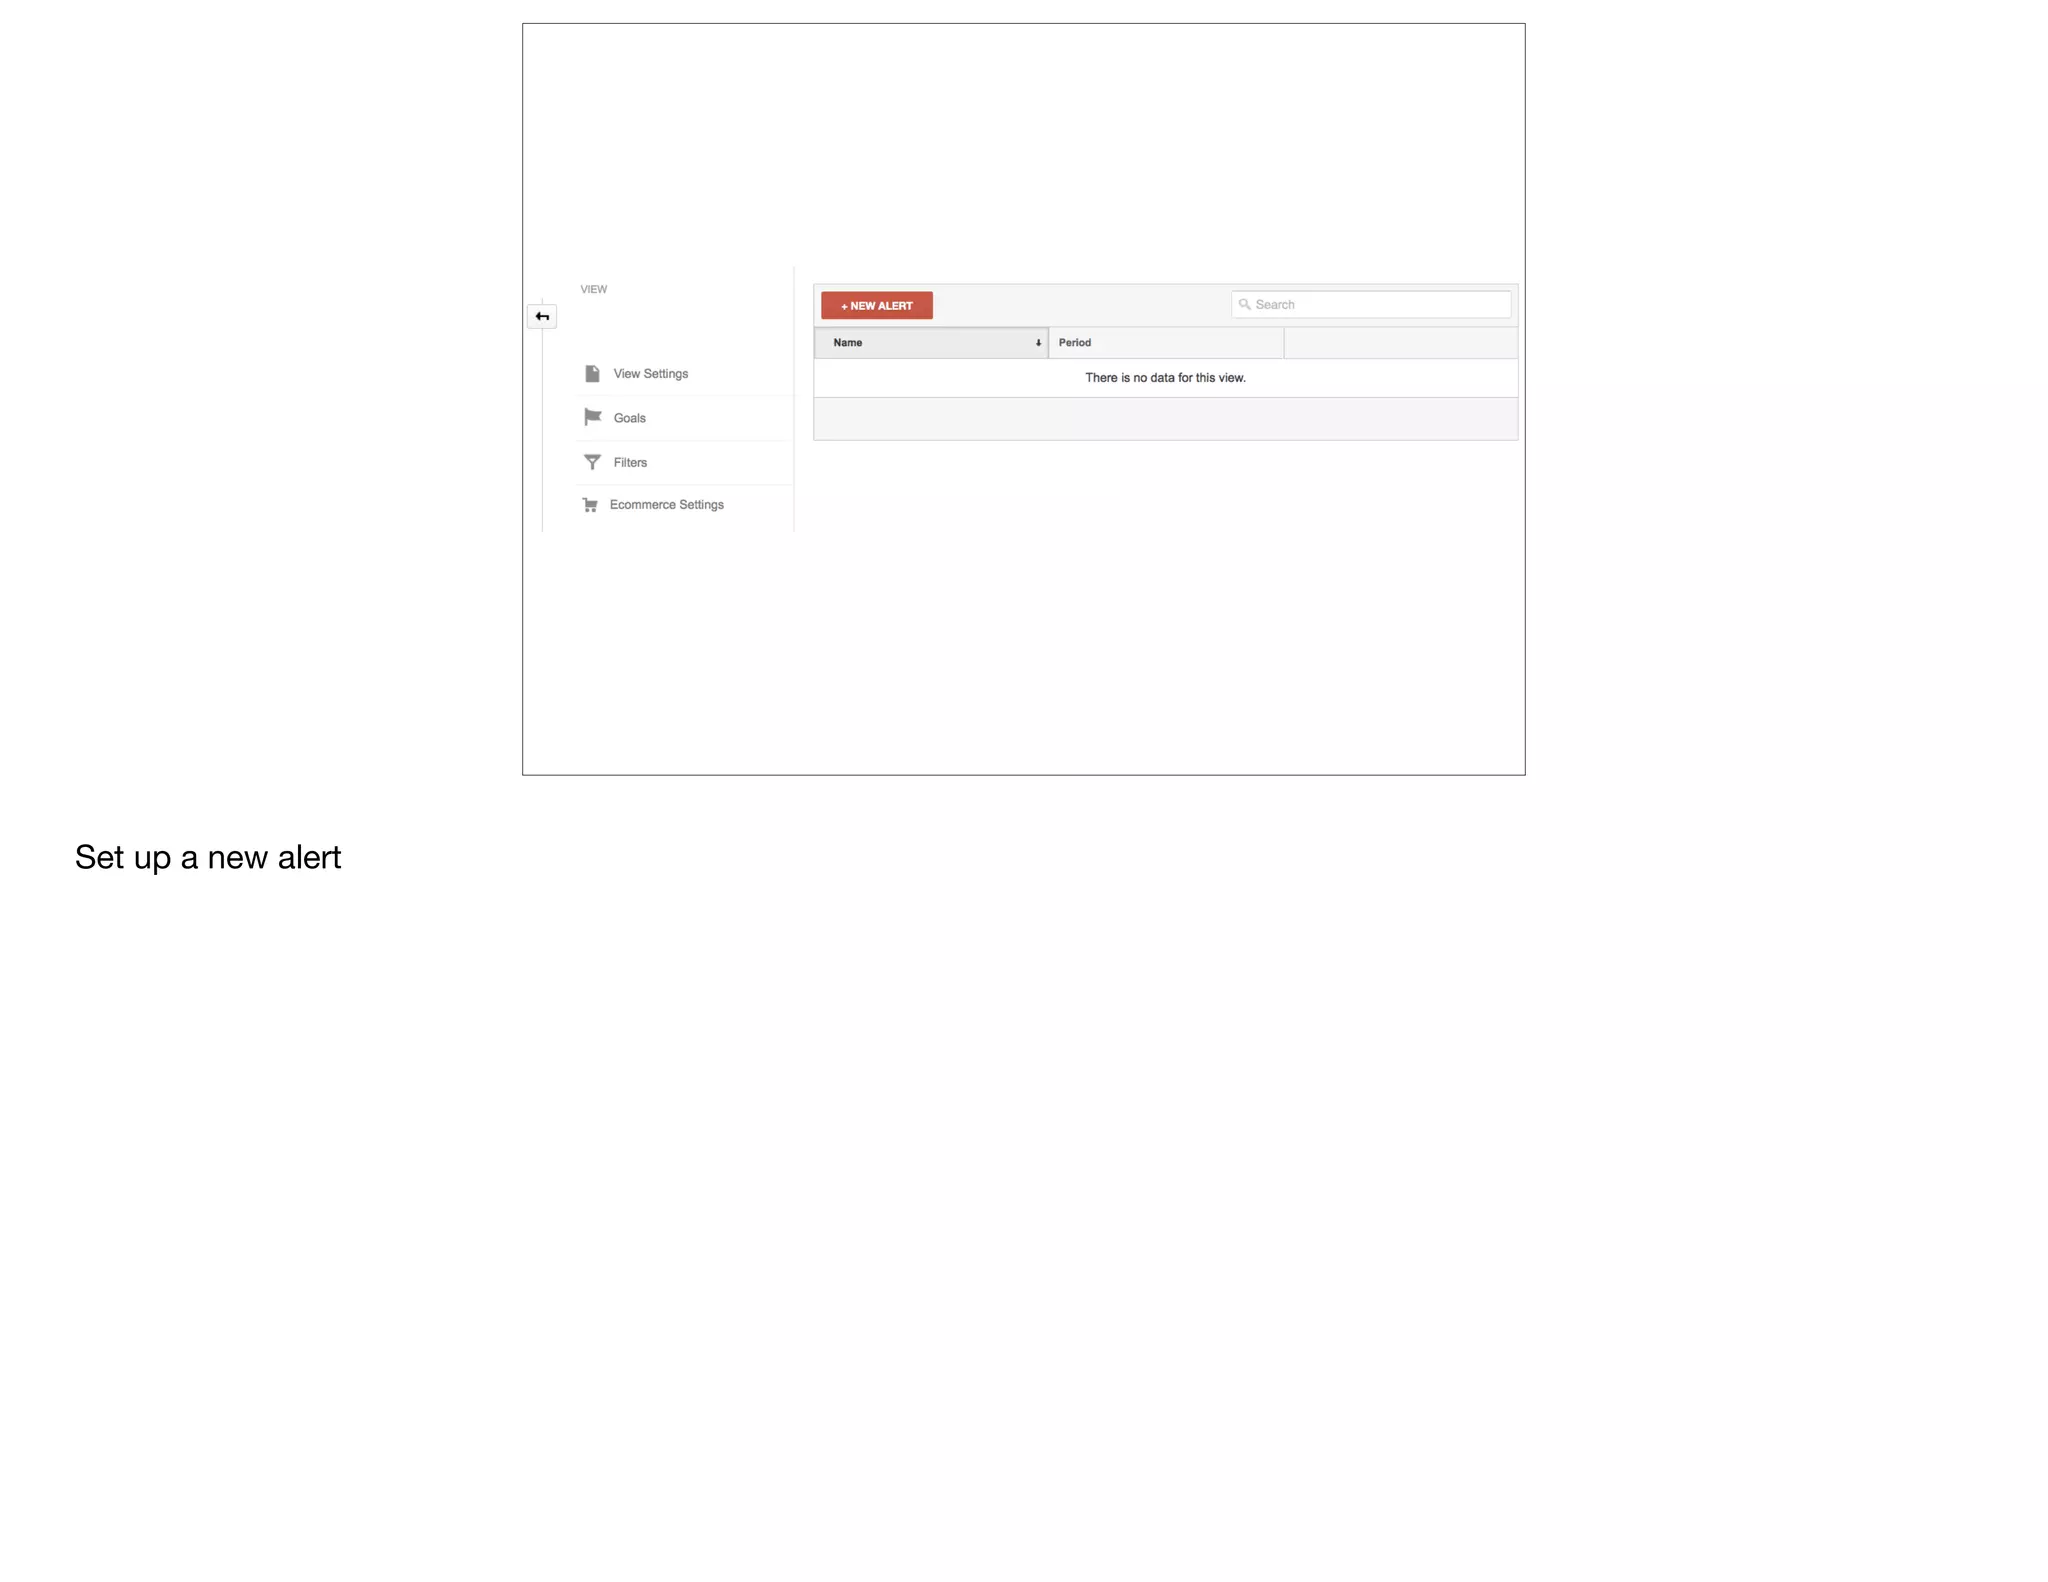
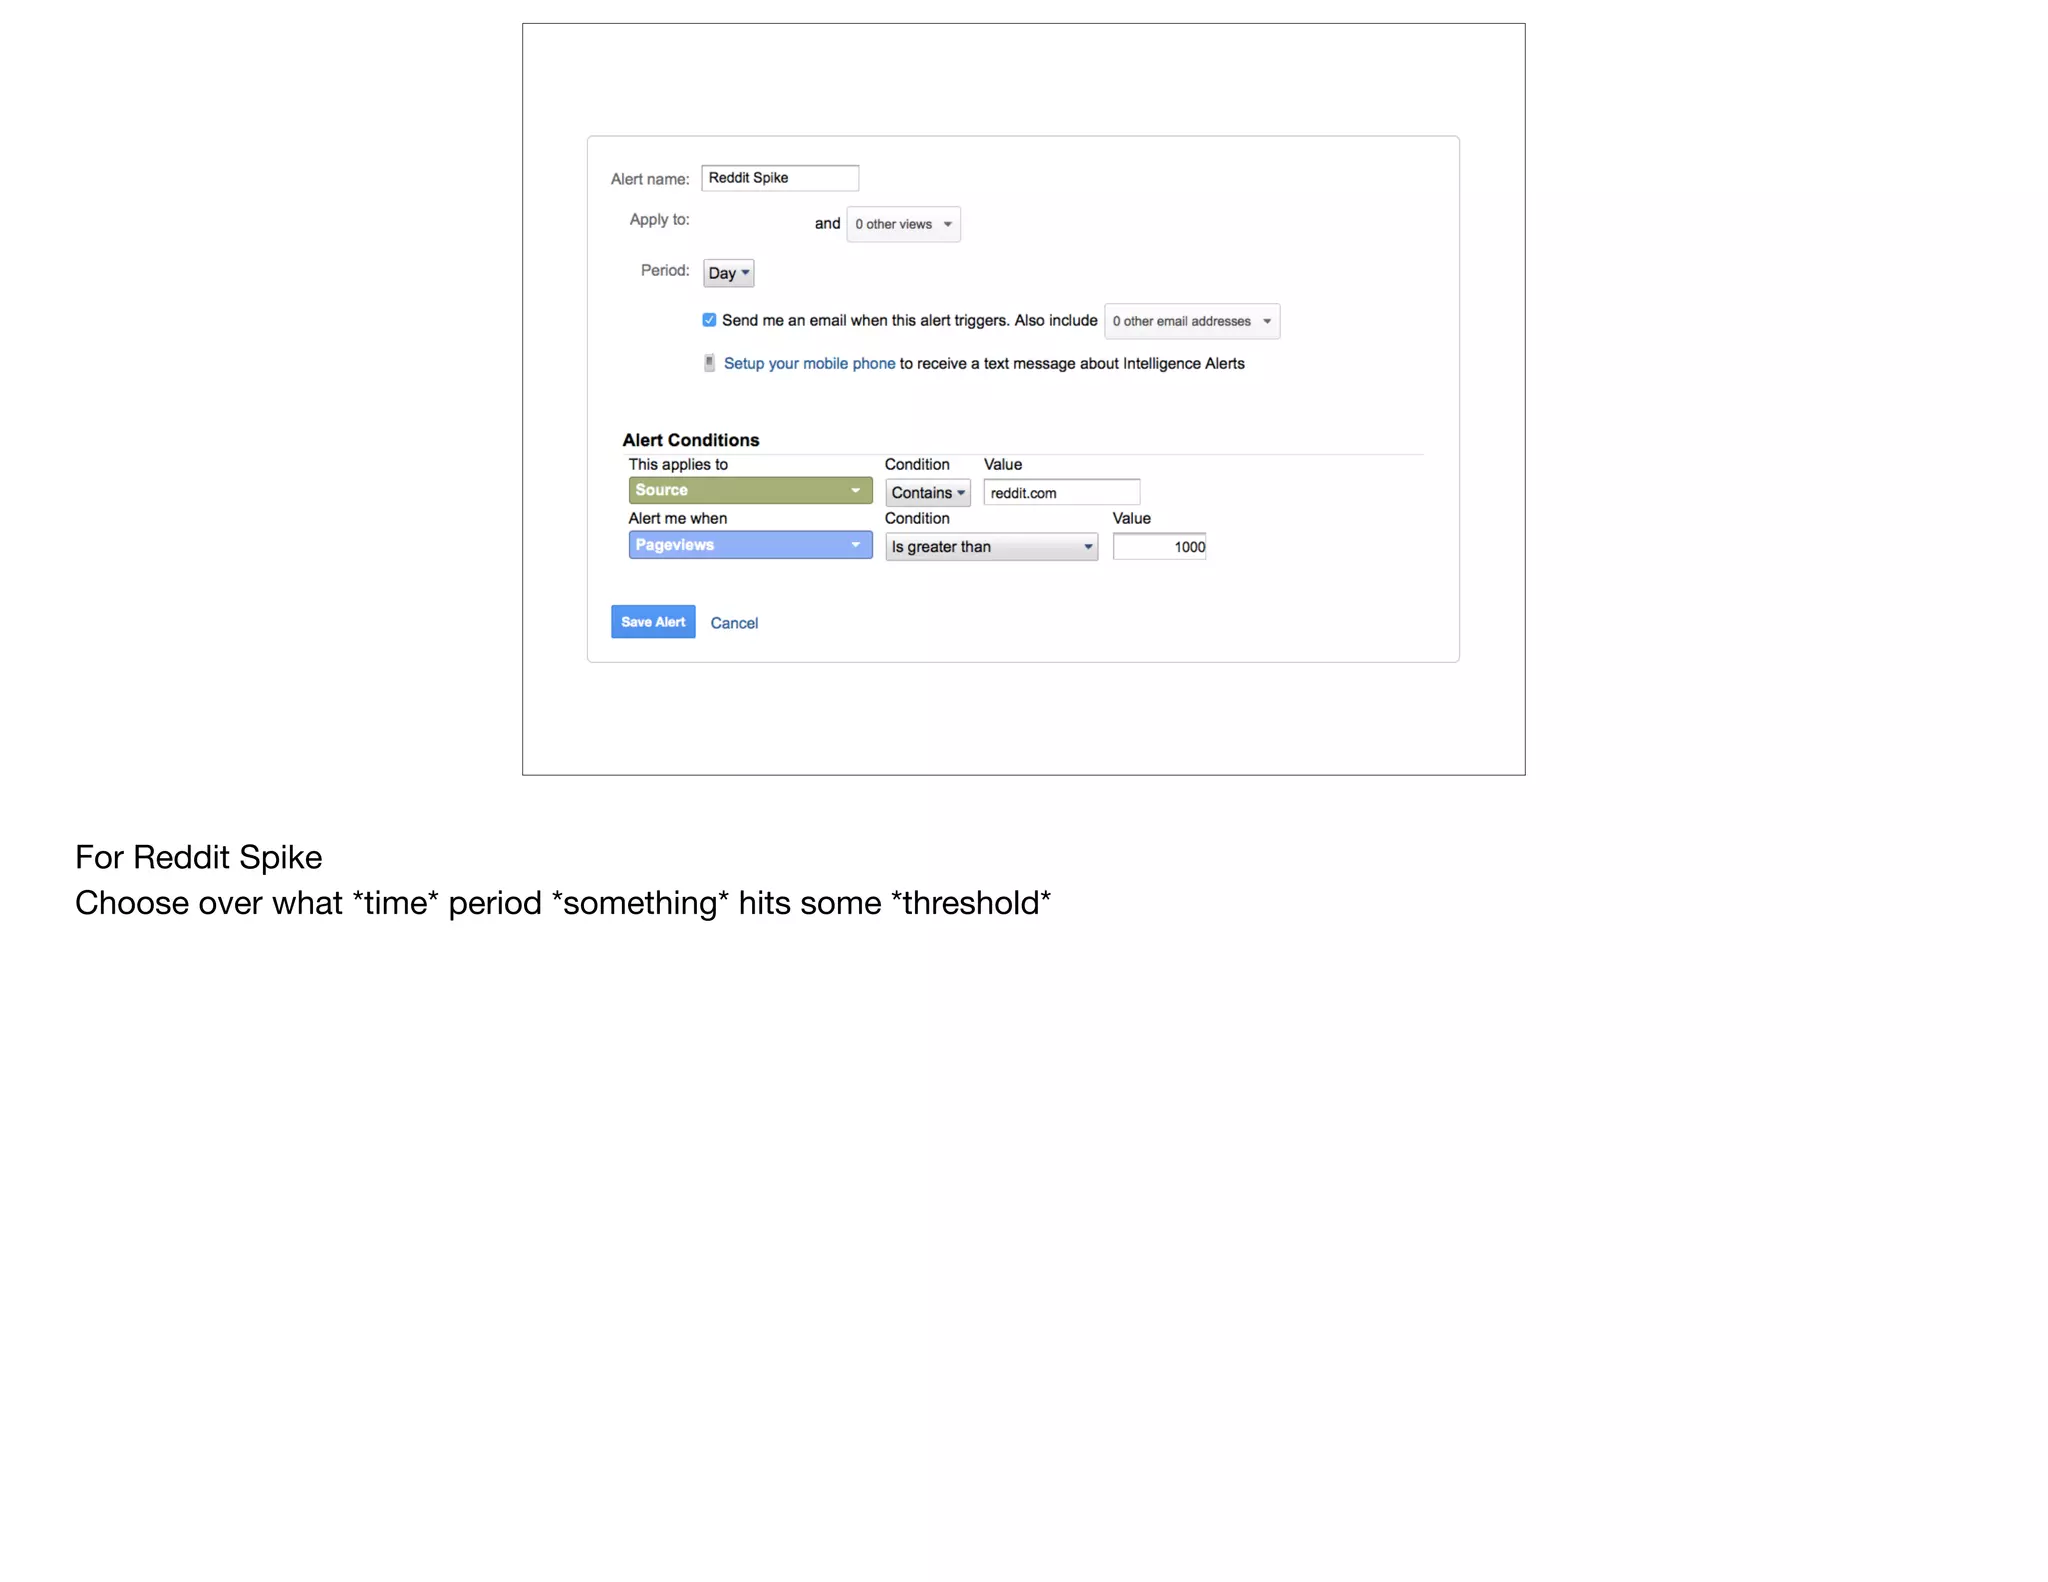


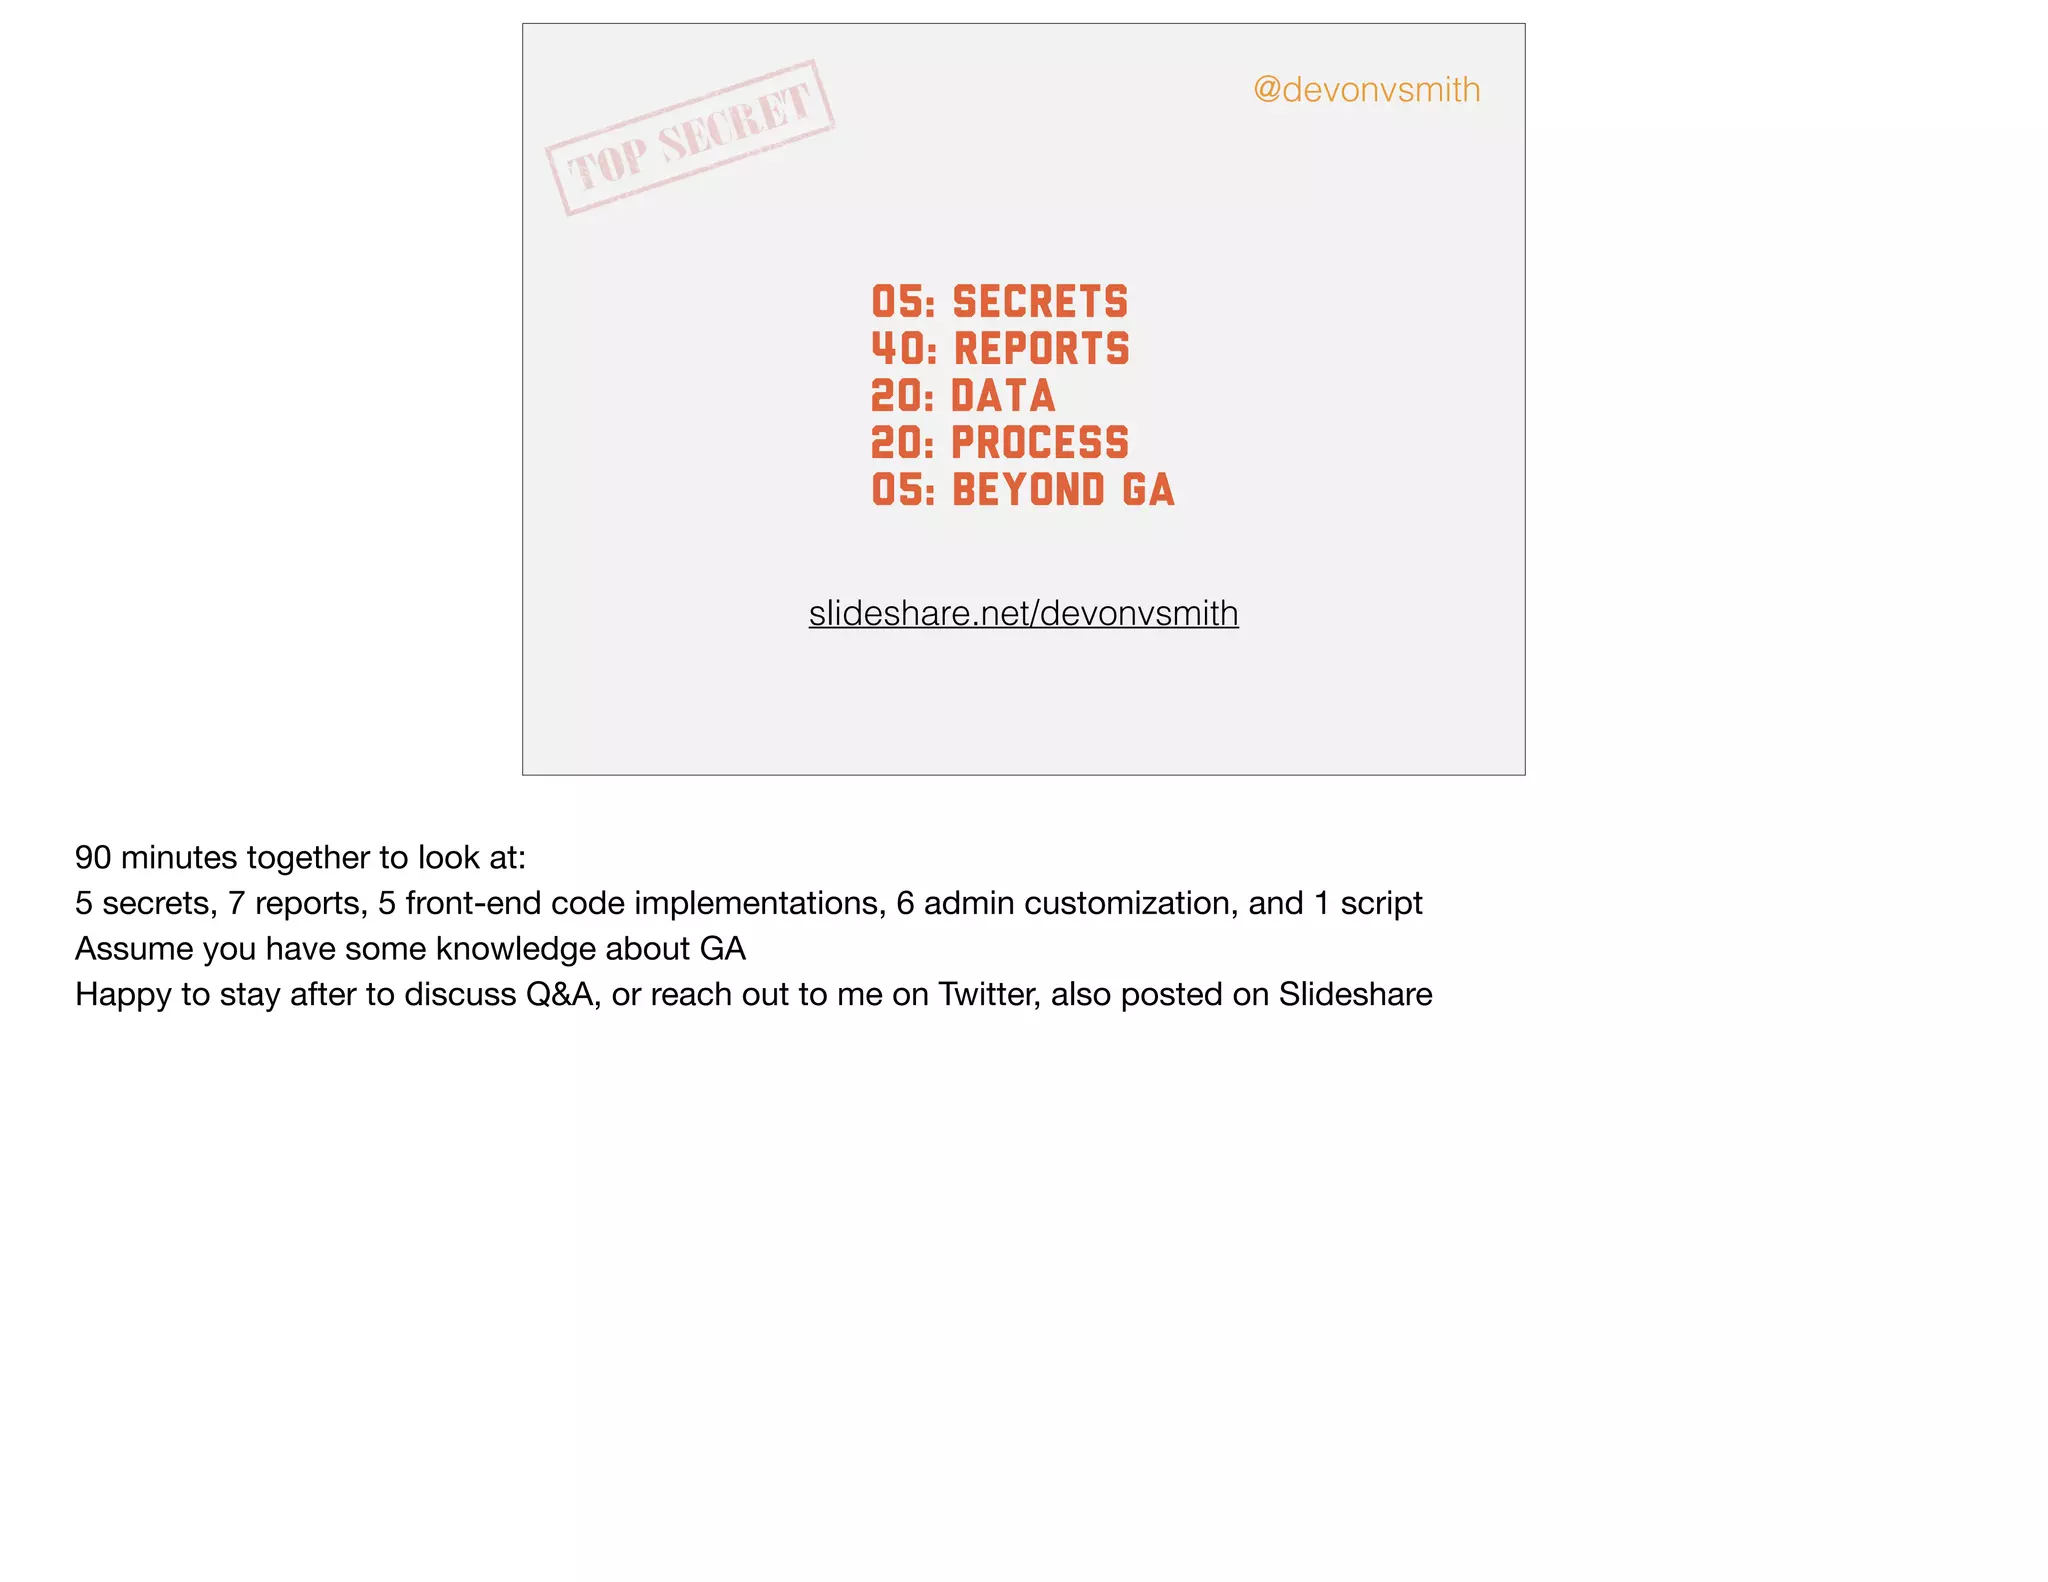
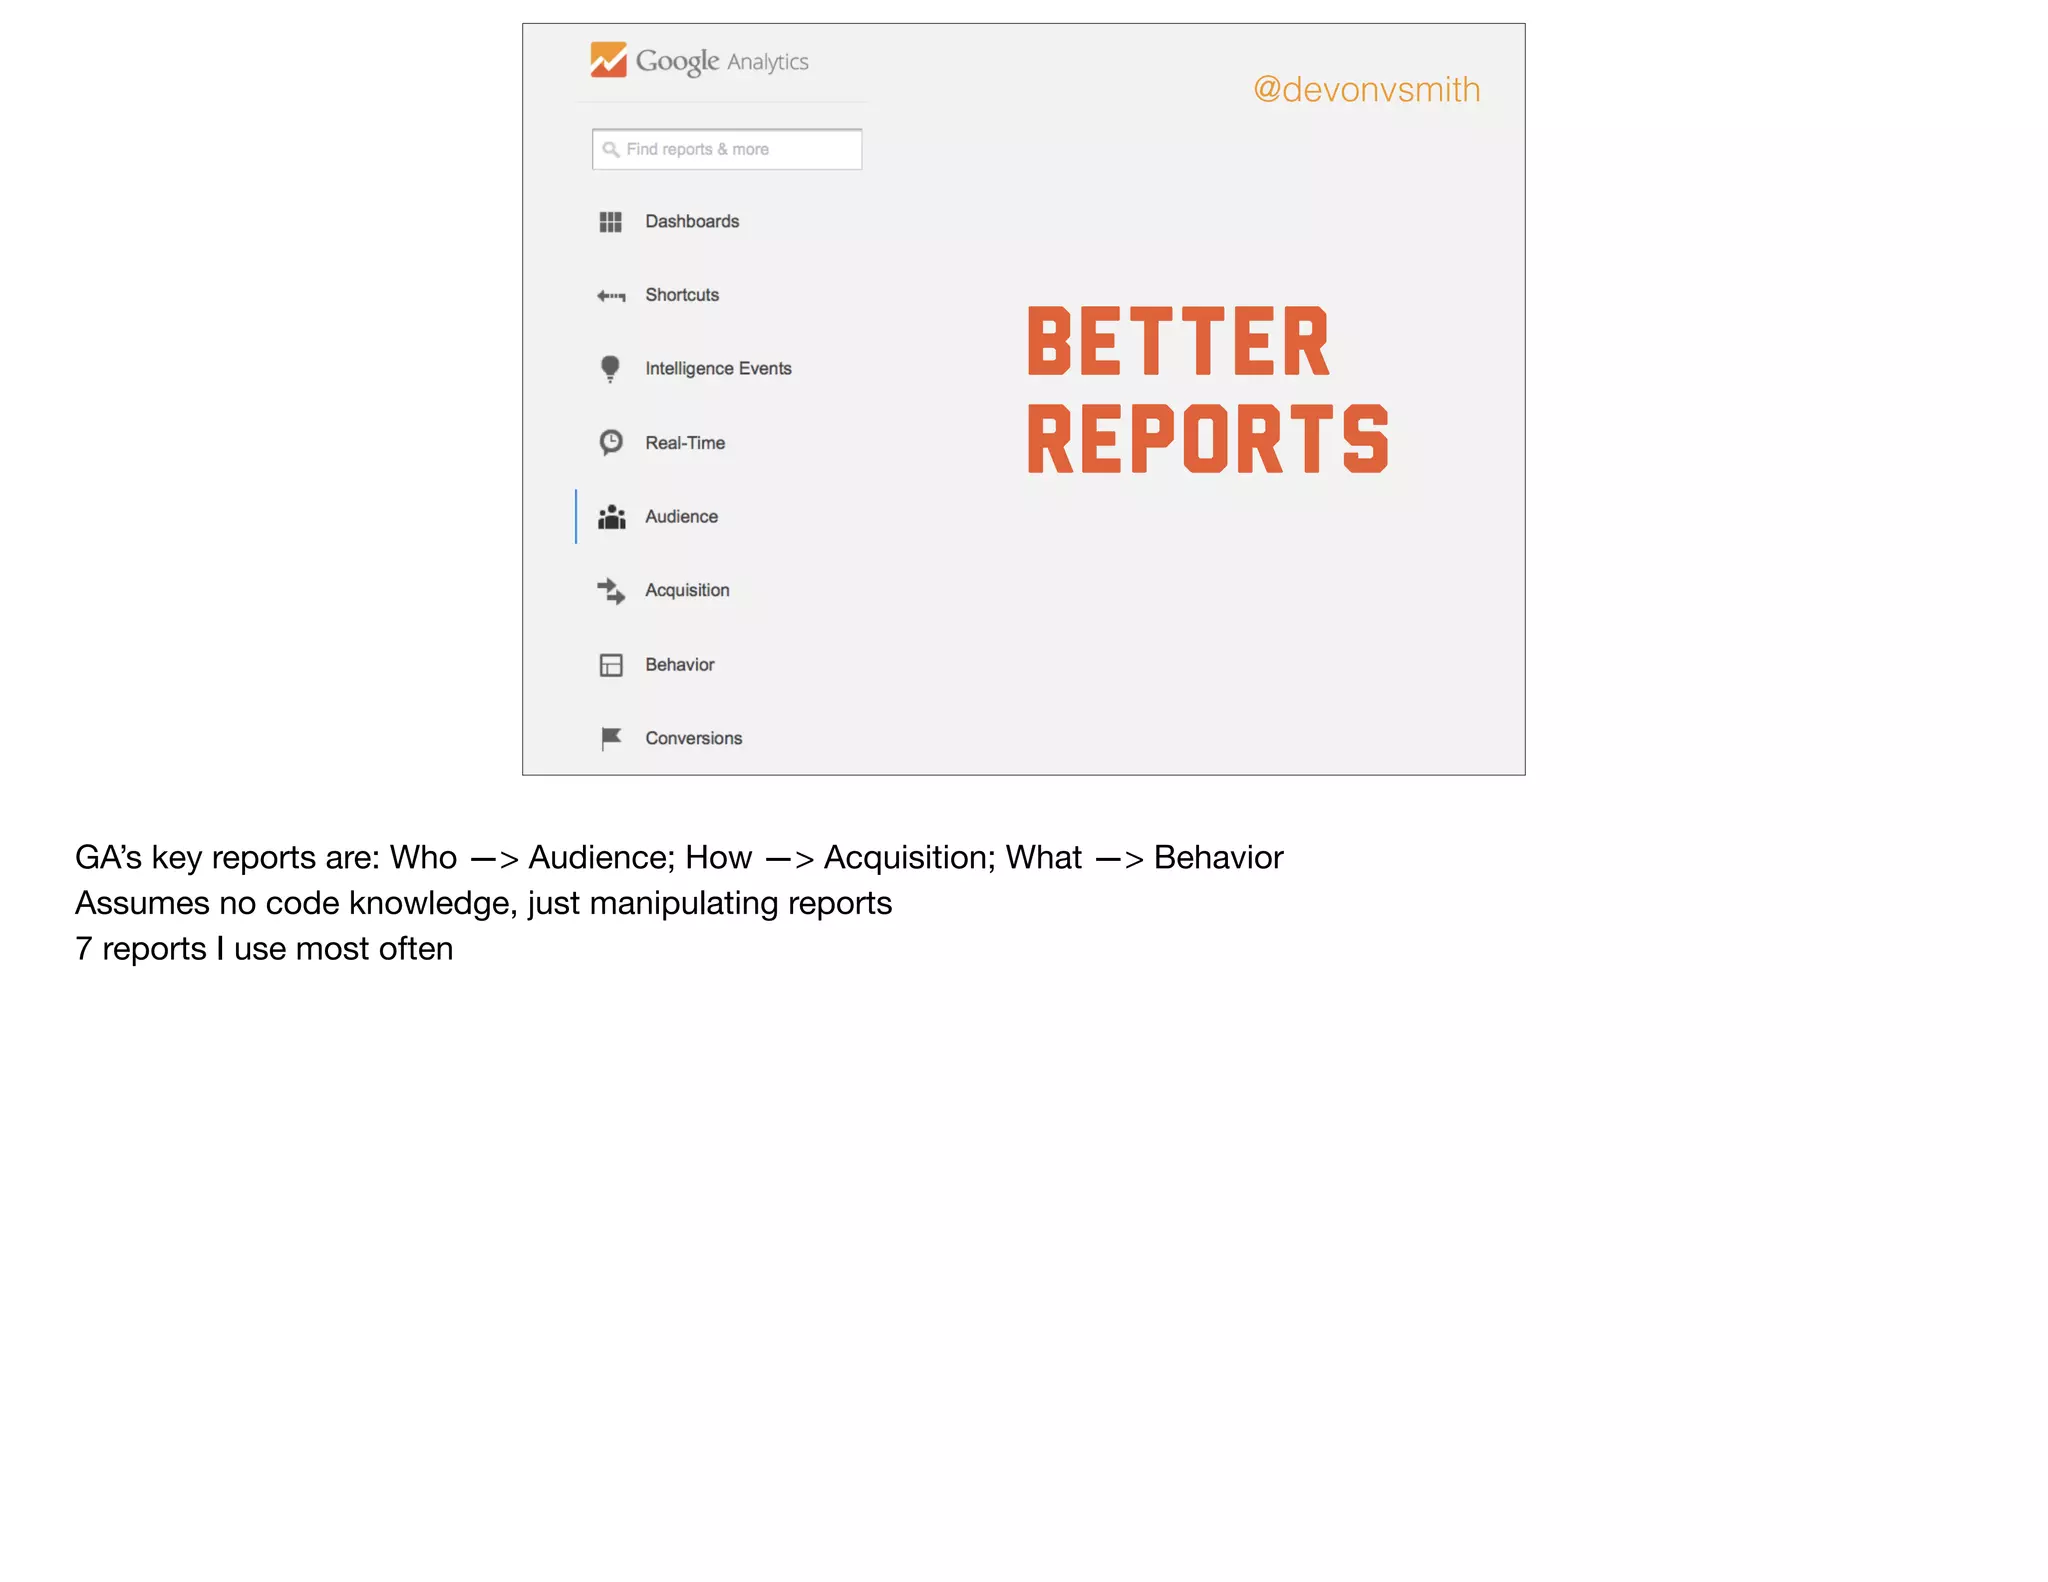
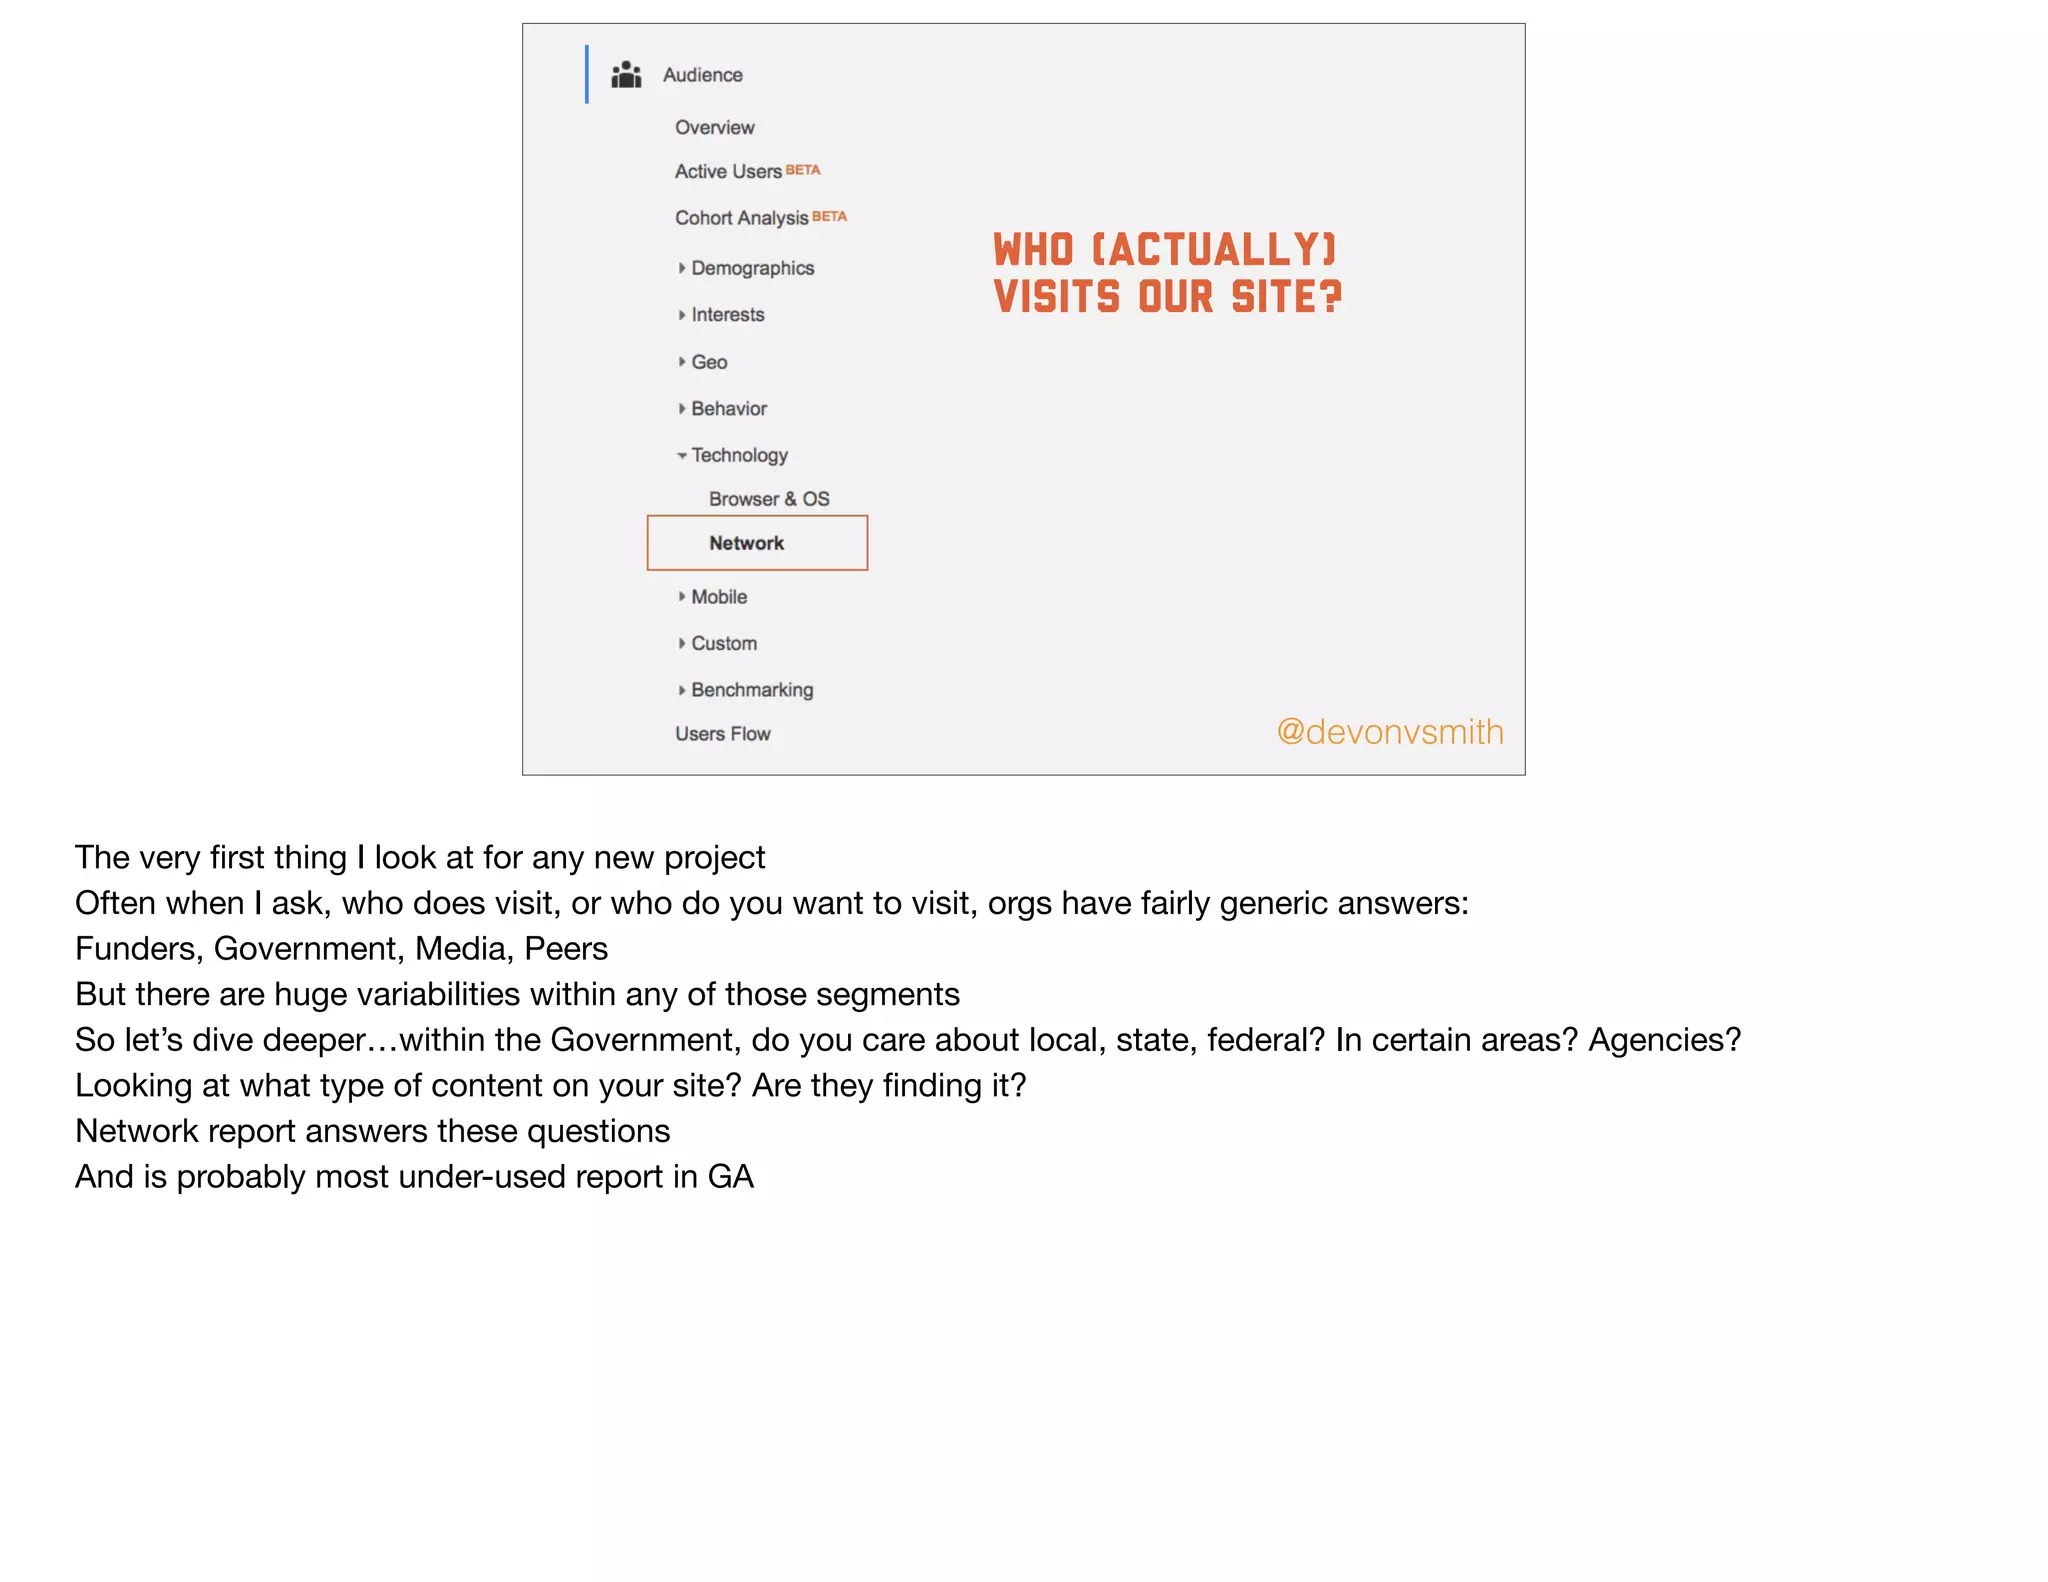
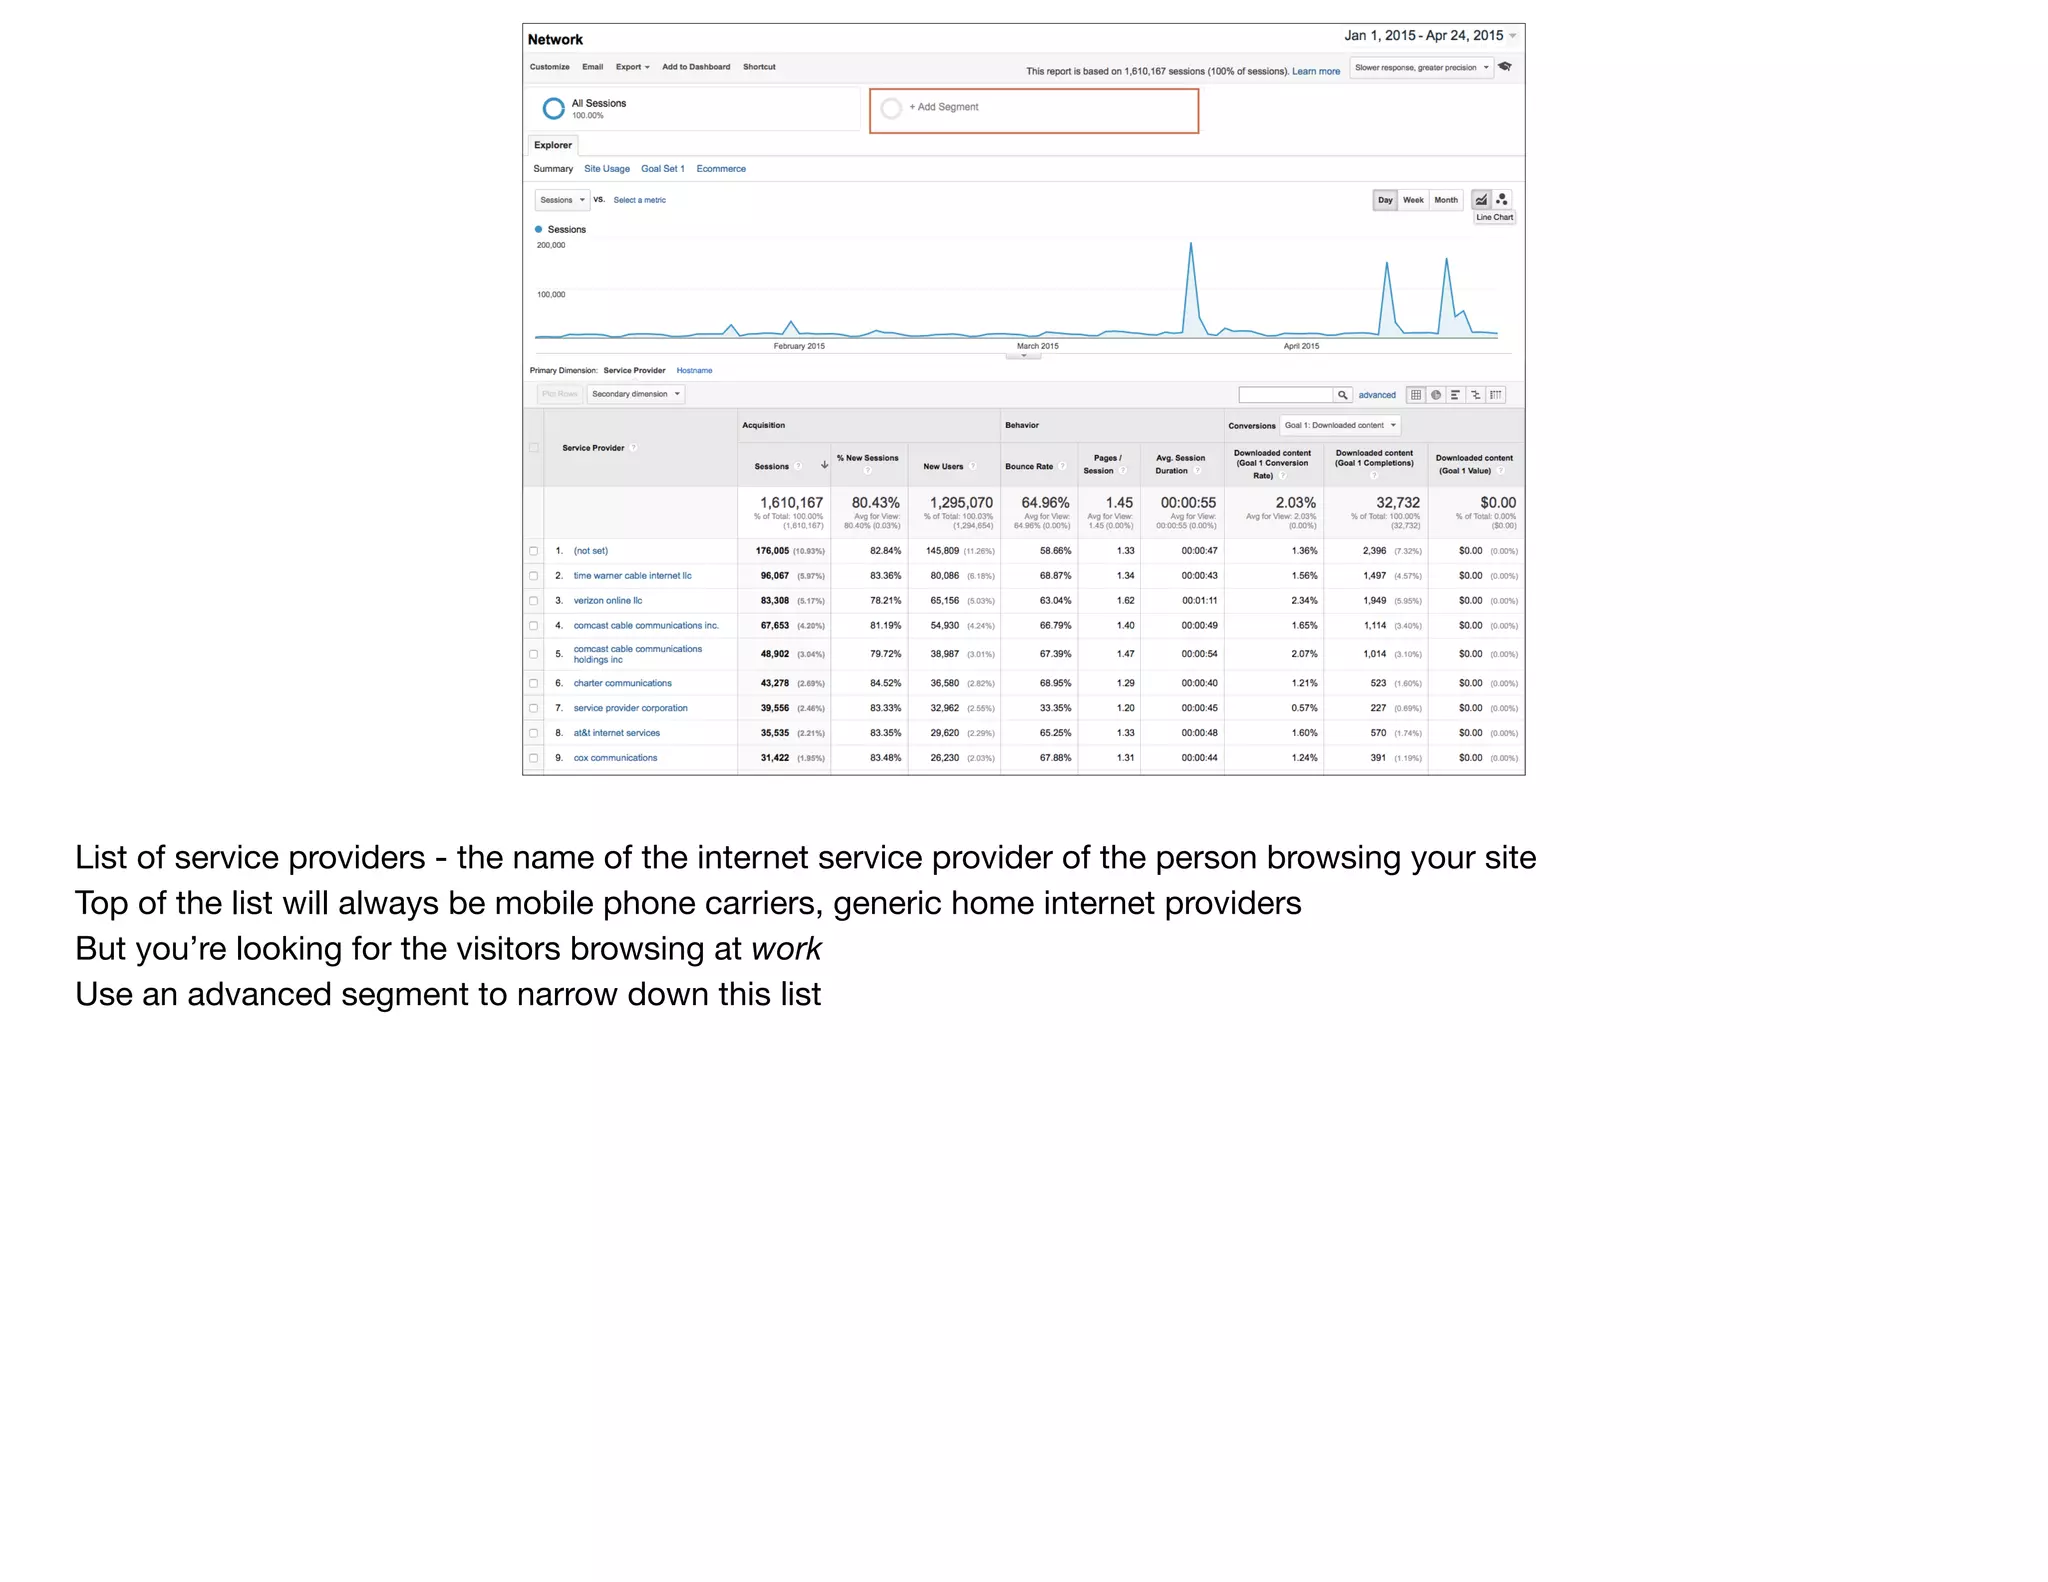
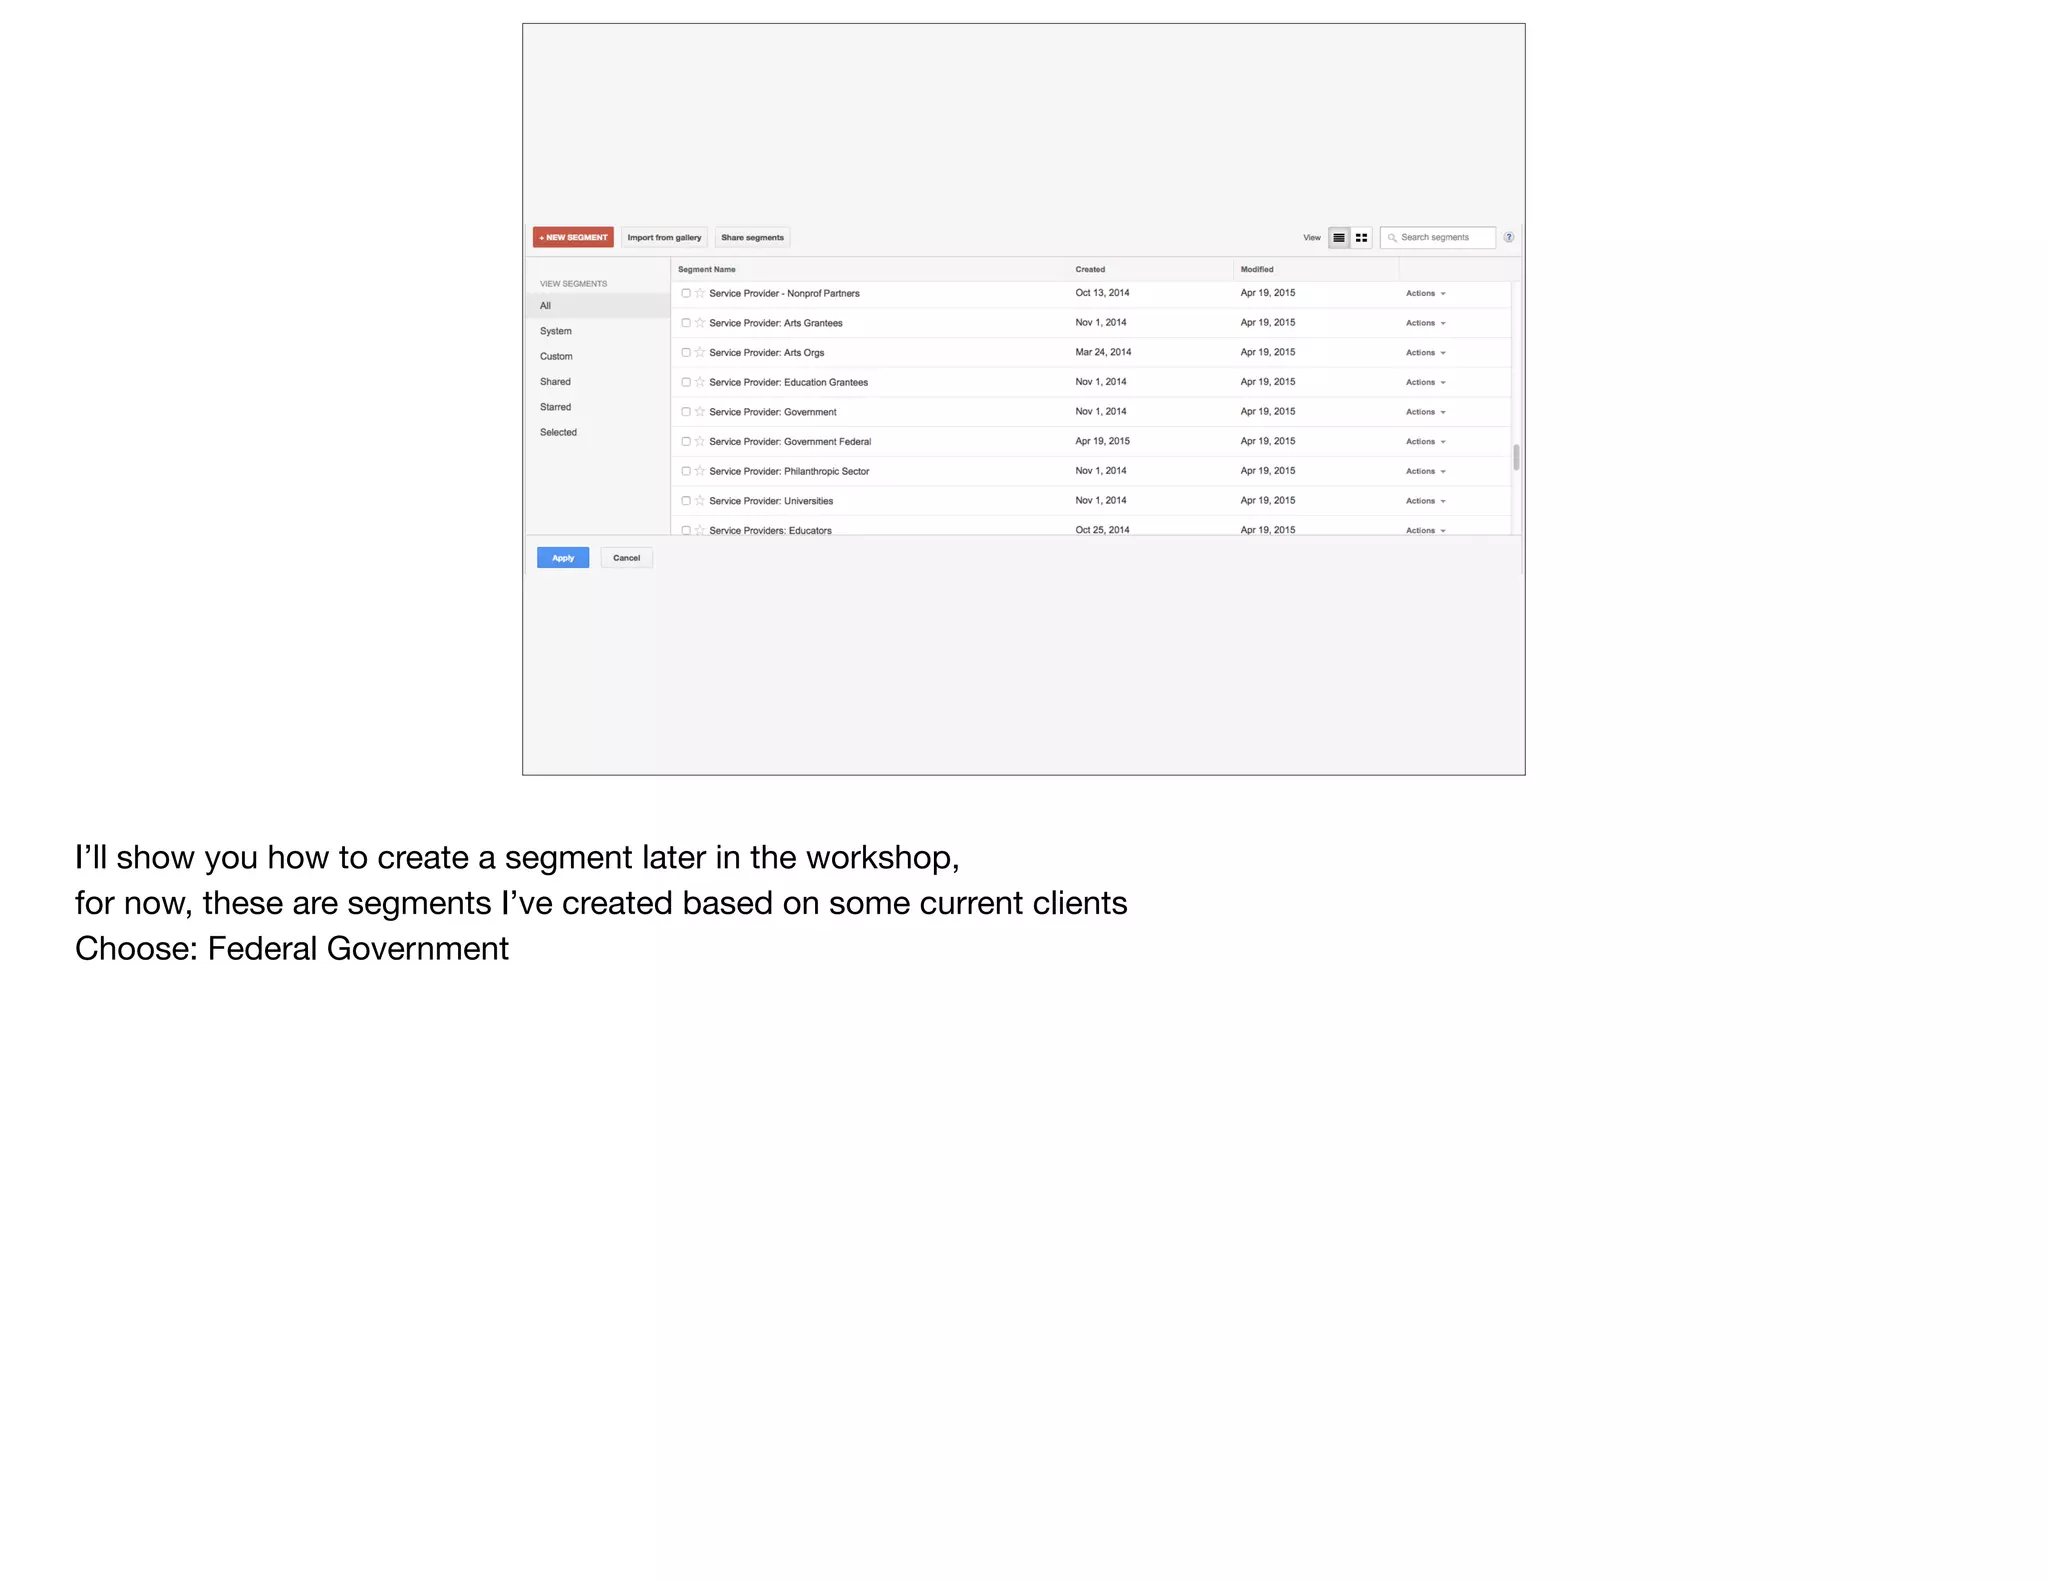
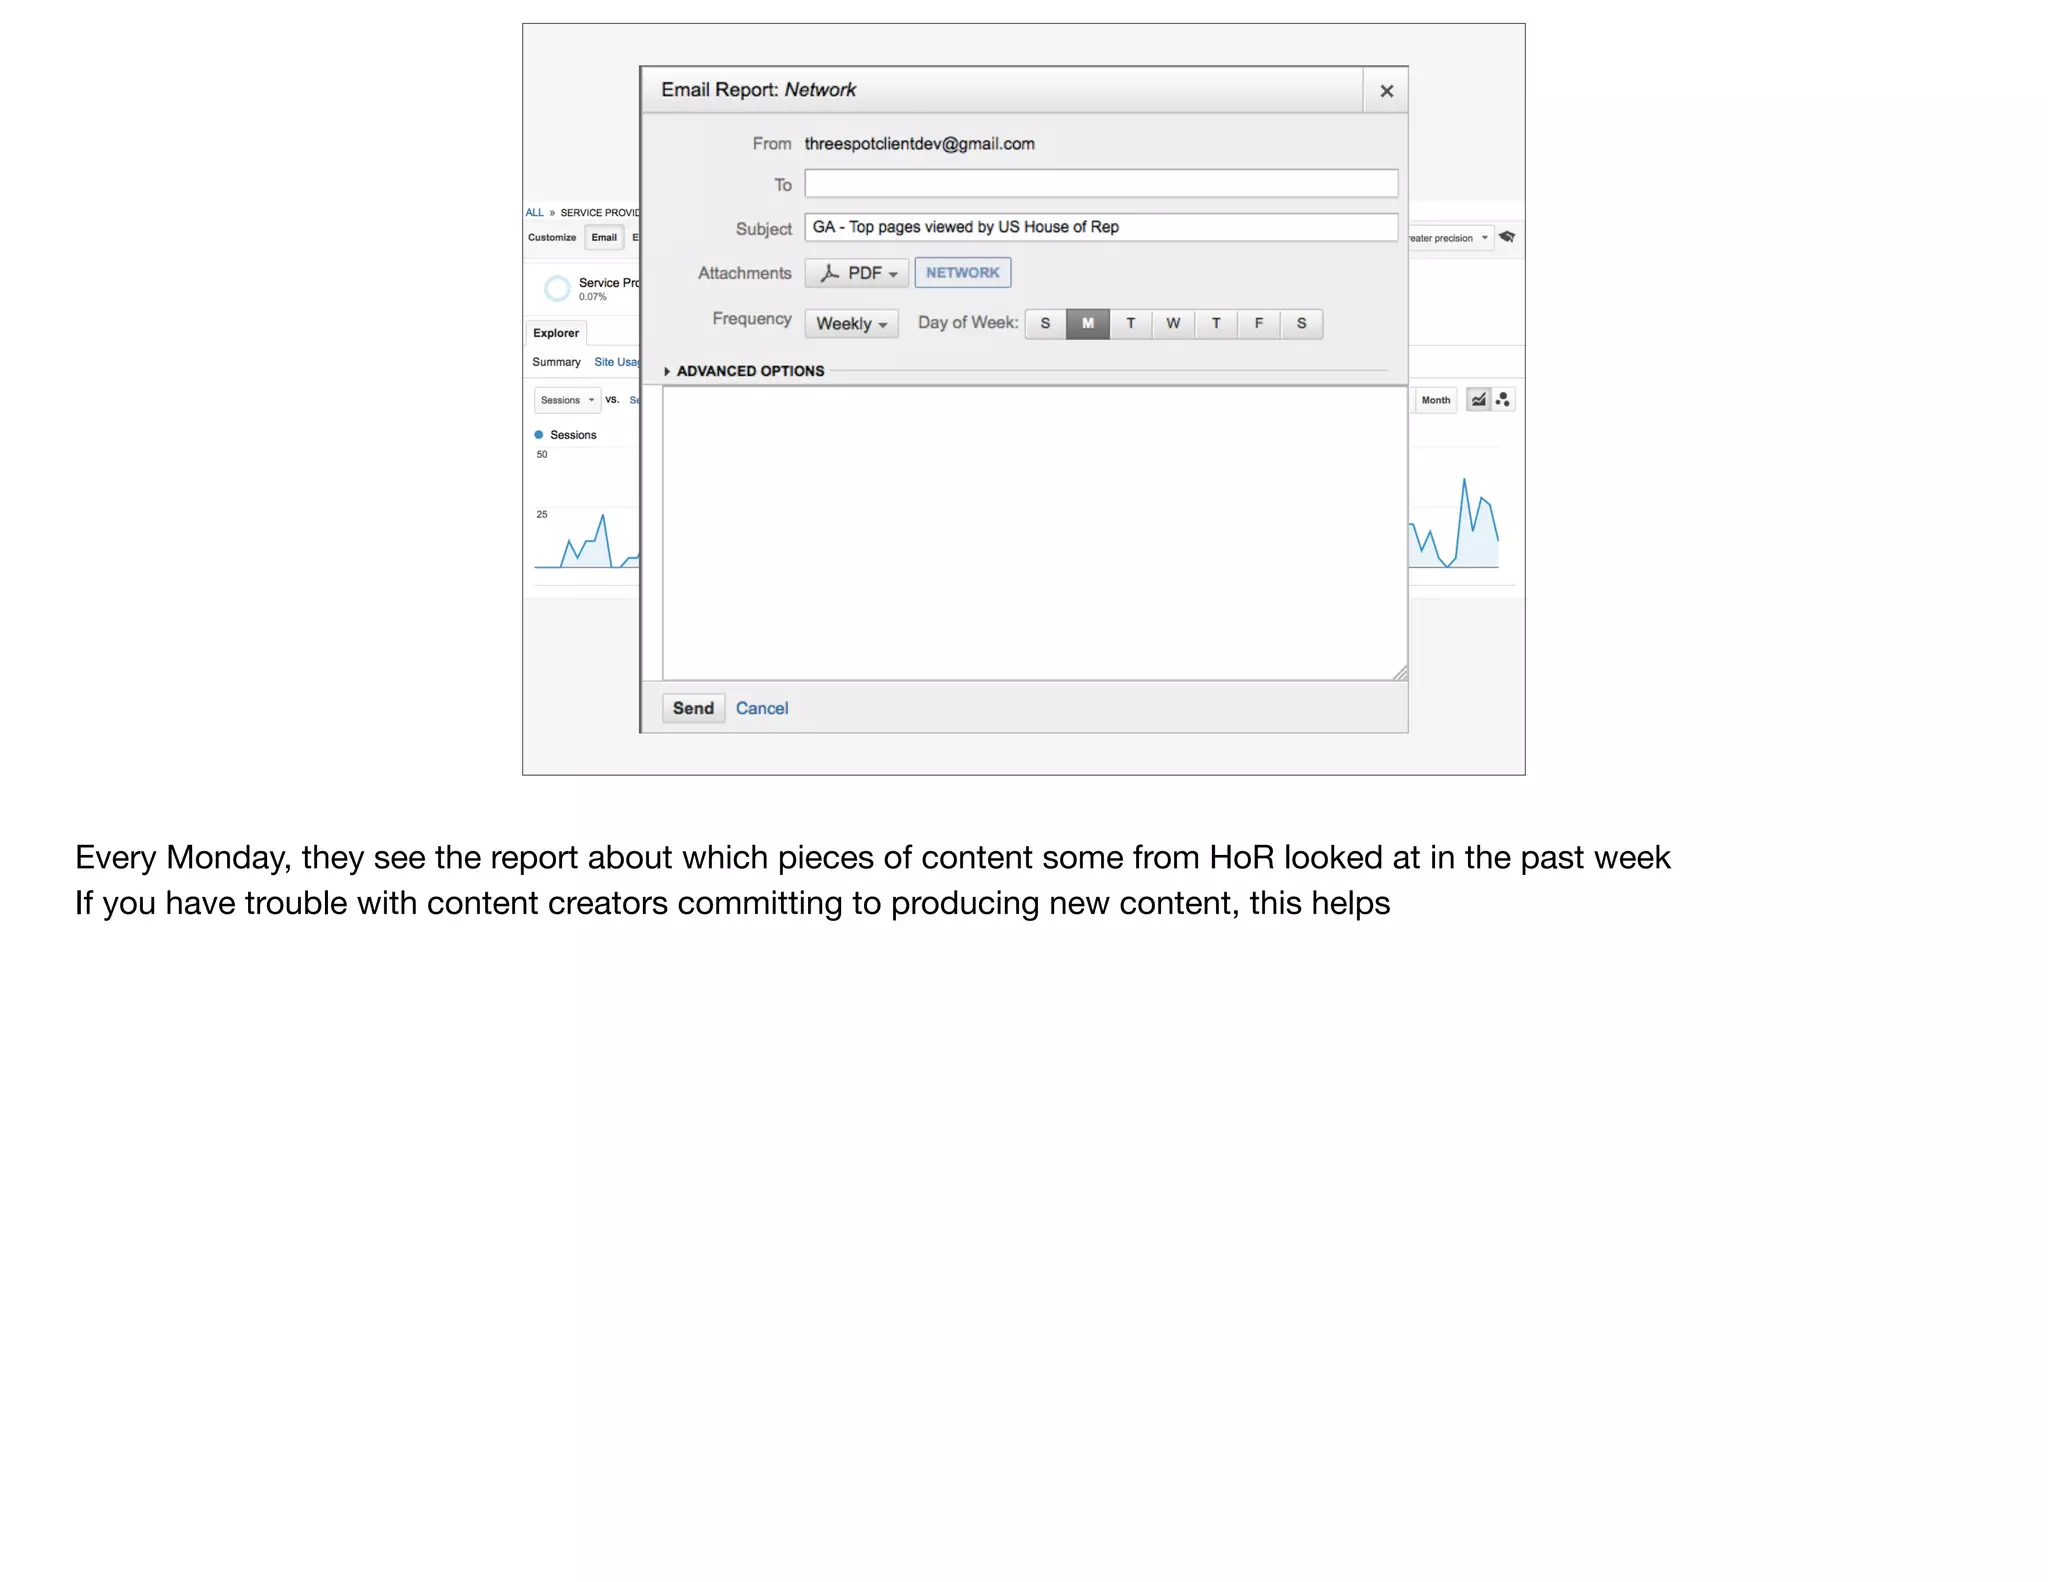
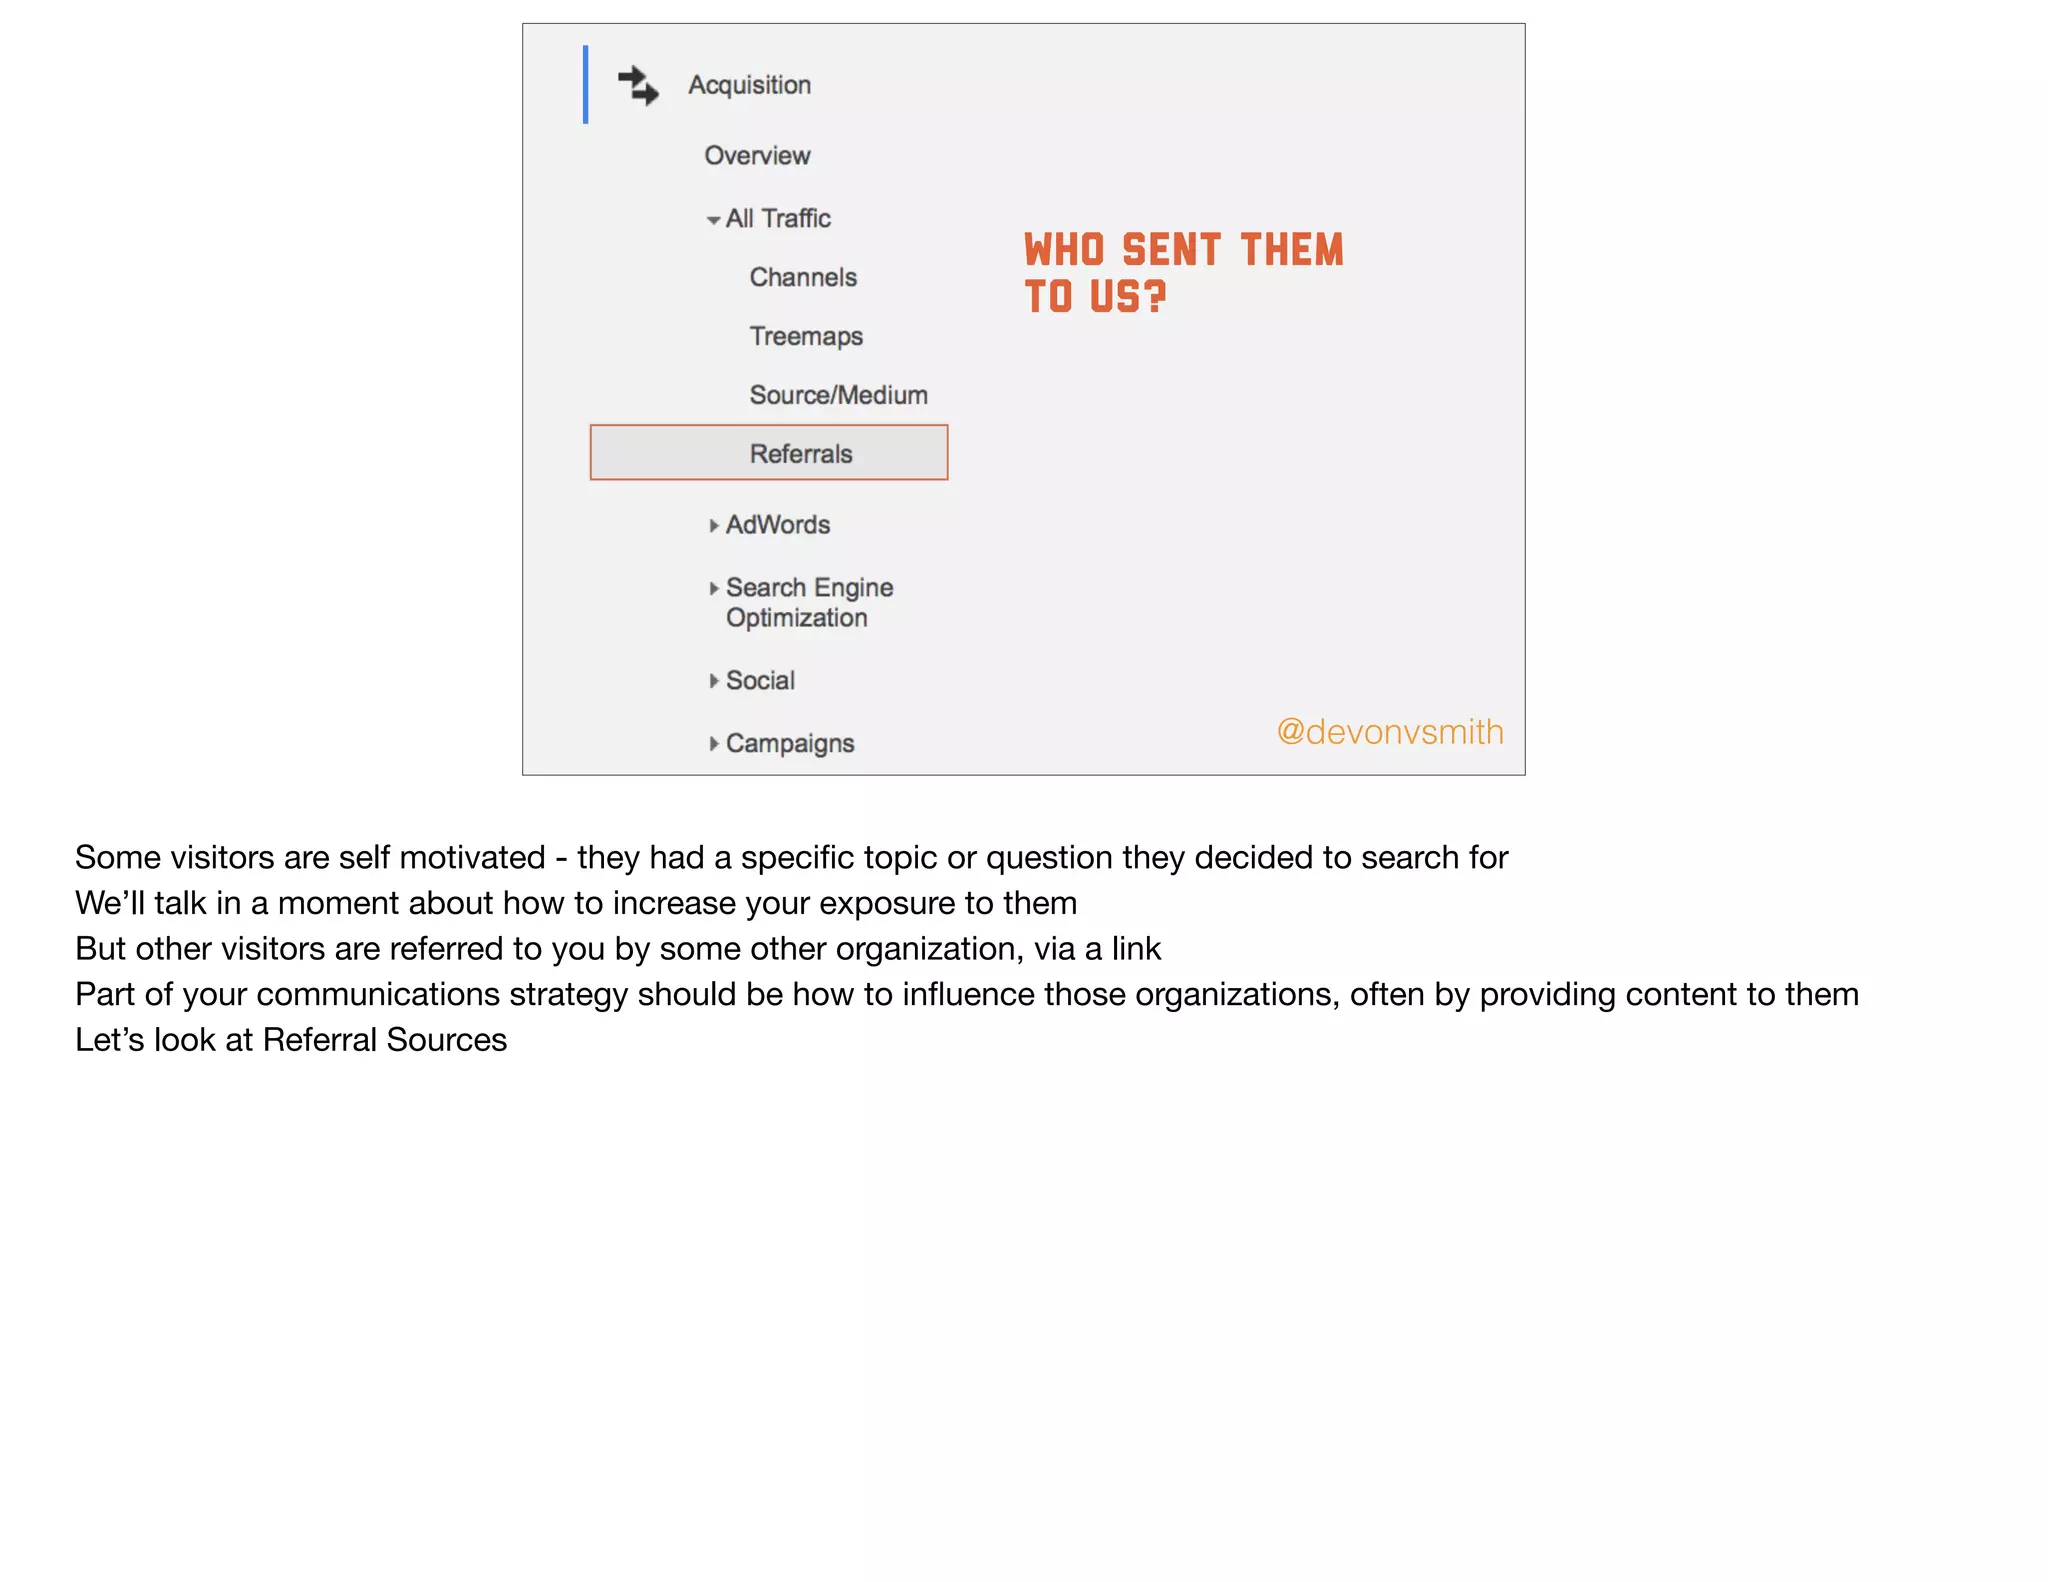
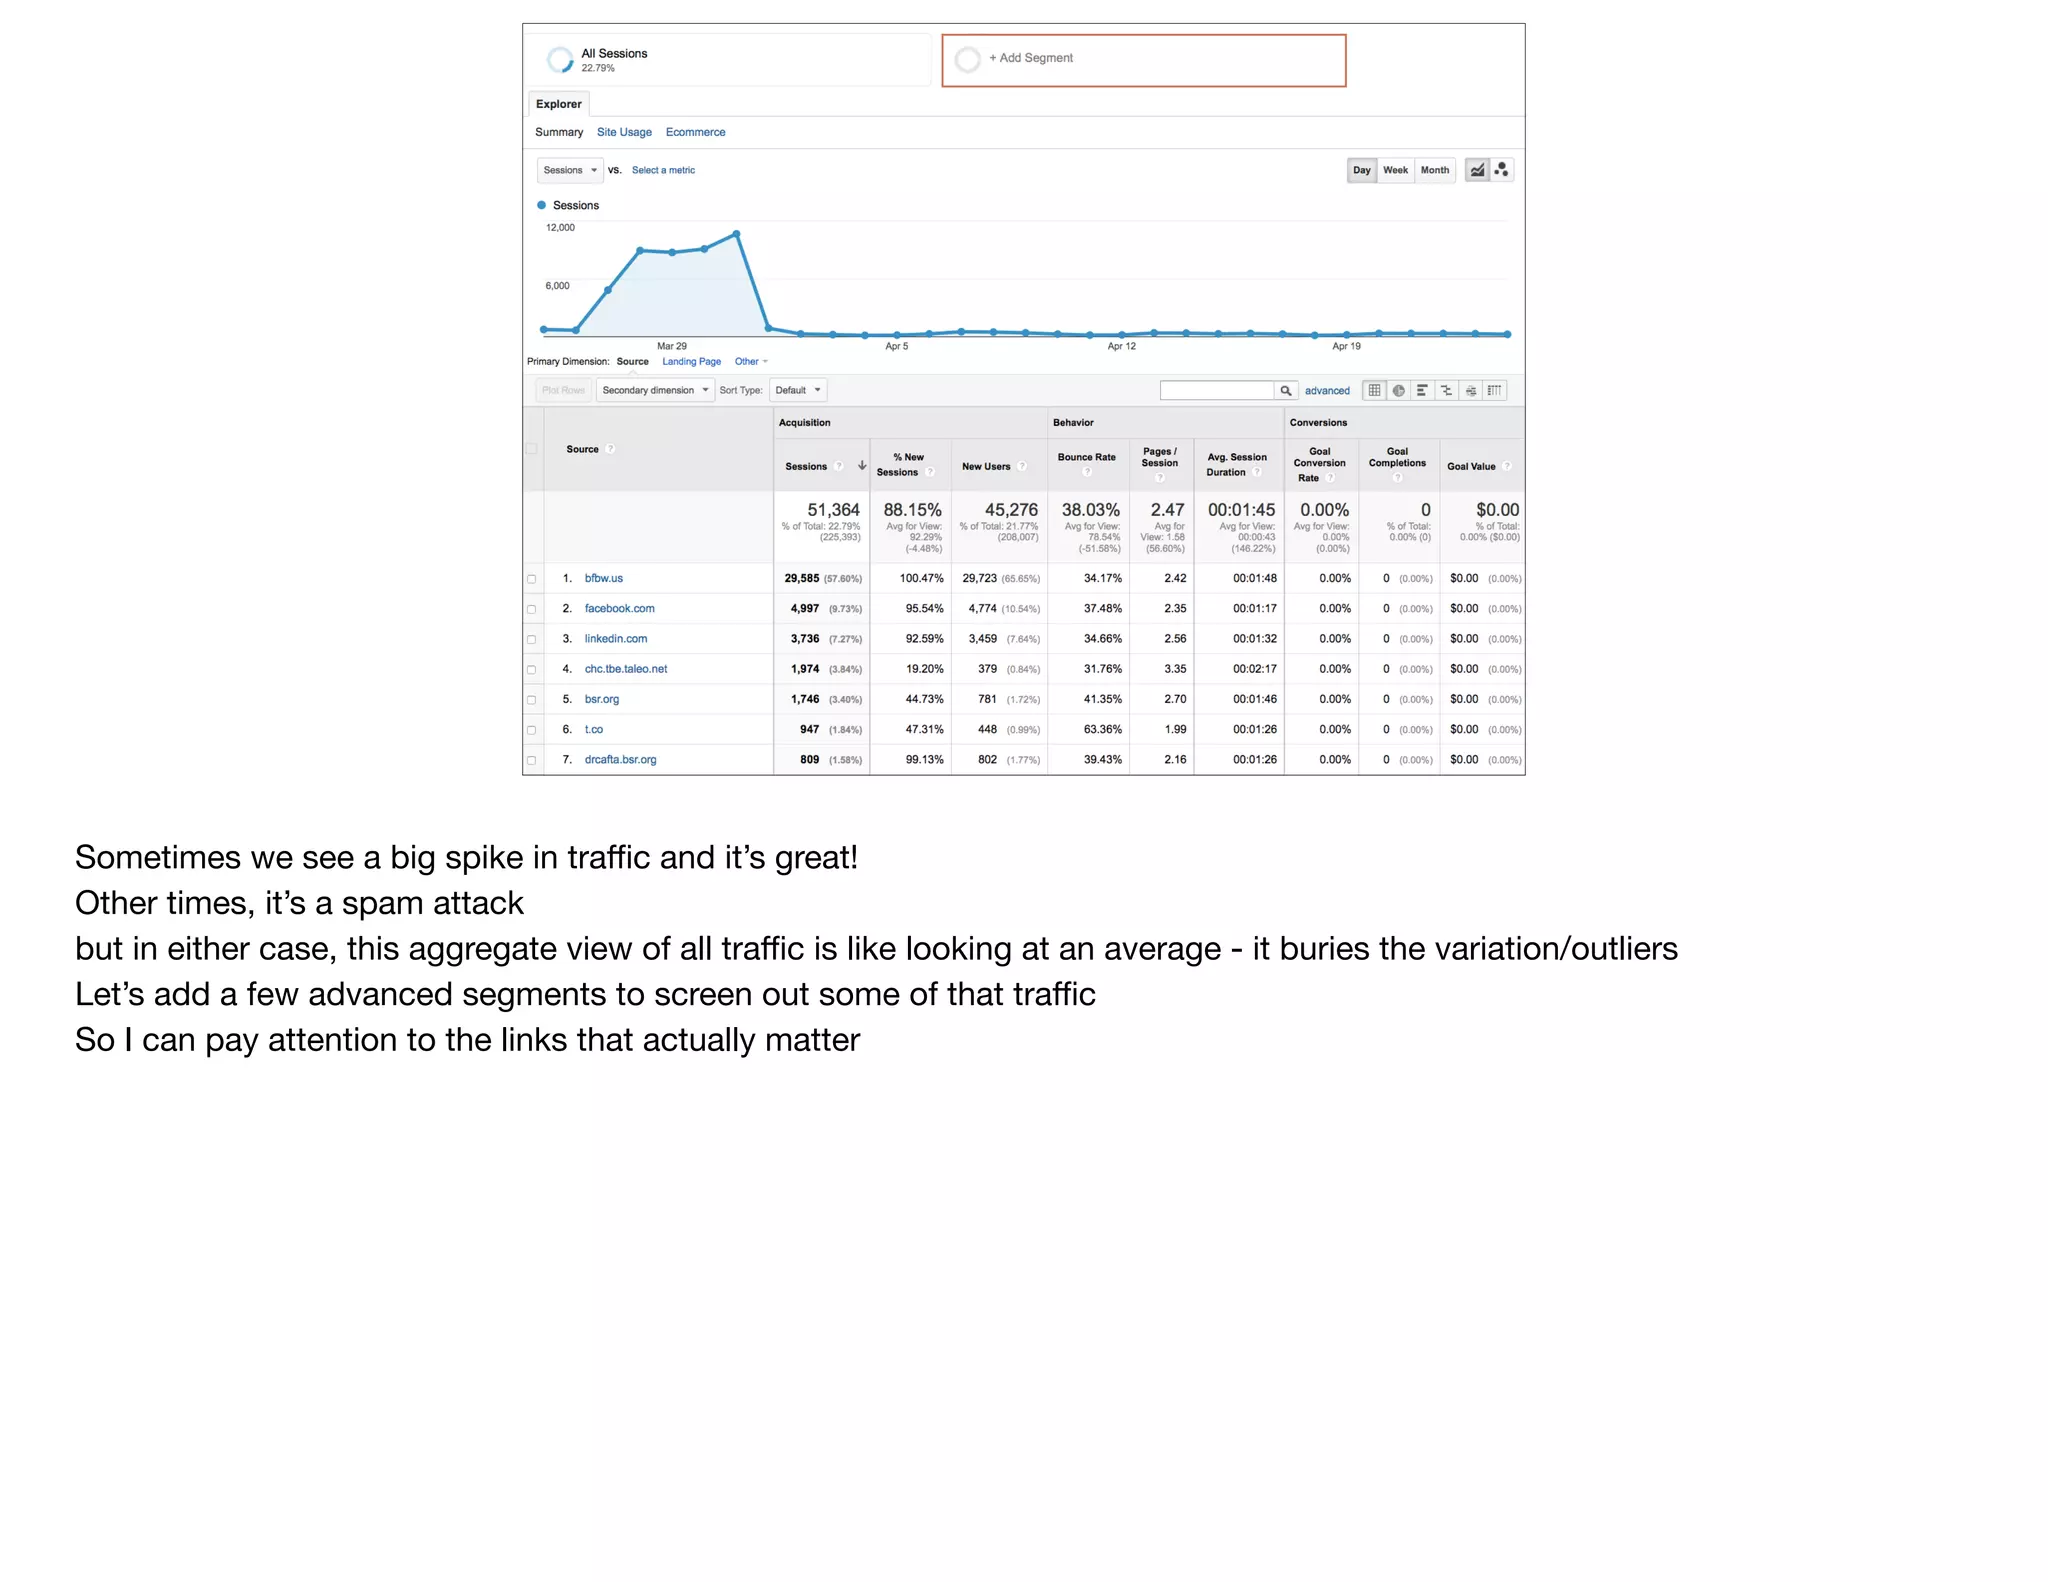
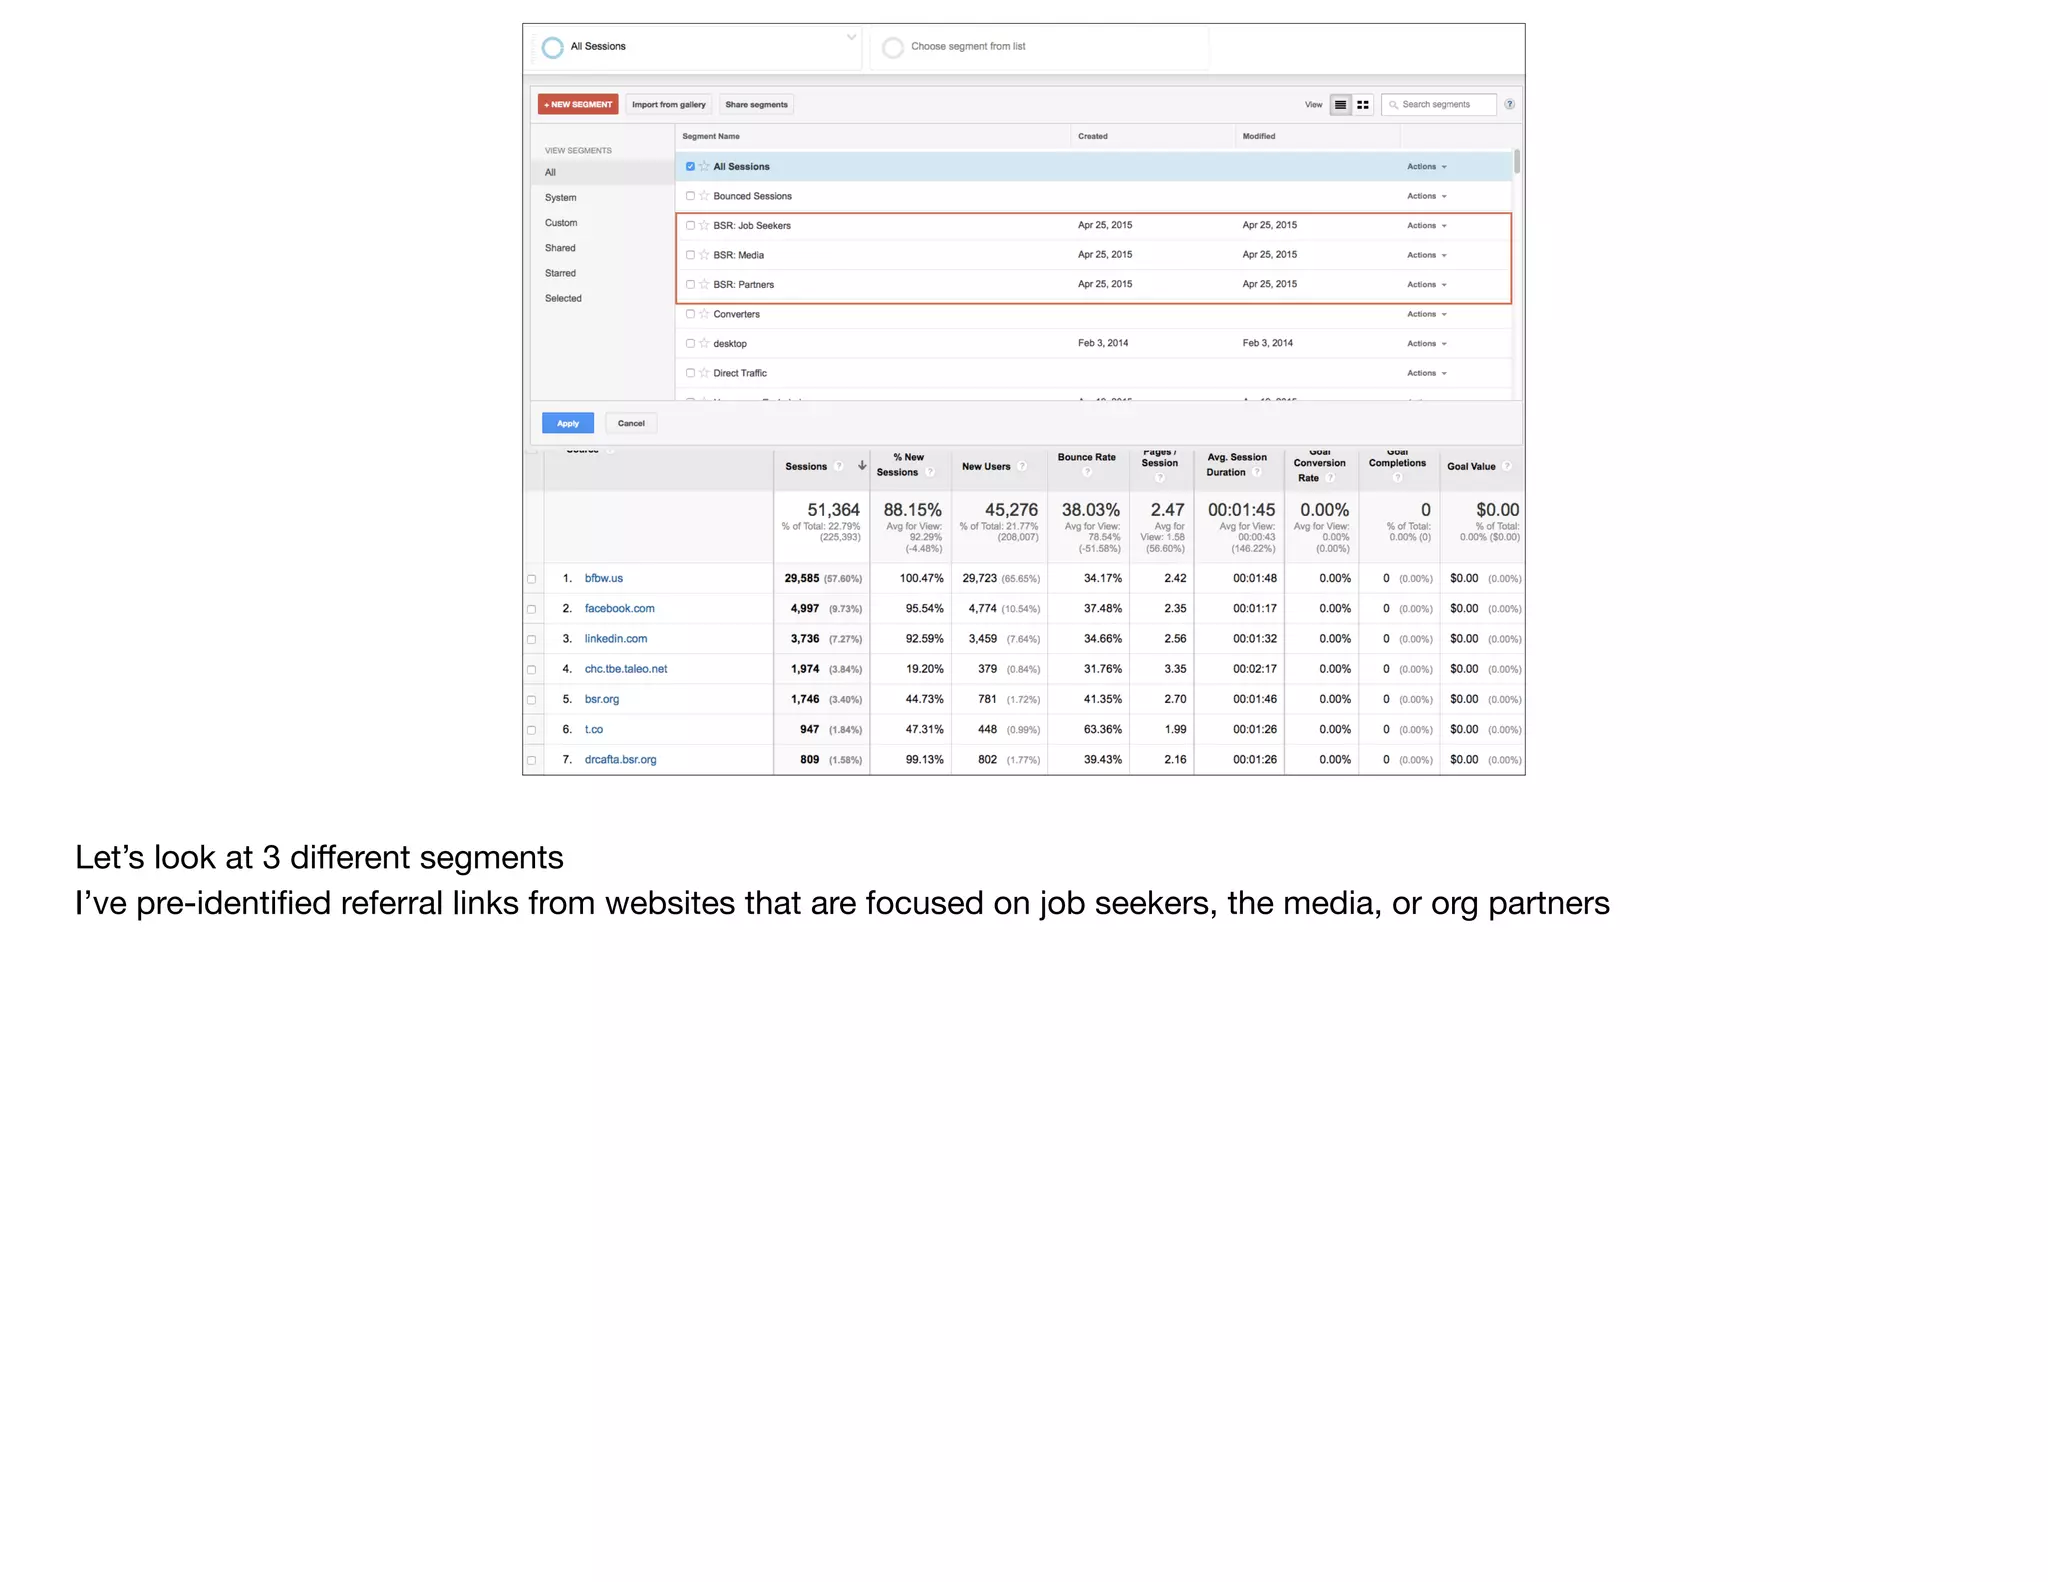
Devon Smith presents a workshop on effectively using Google Analytics (GA) for nonprofits, foundations, and government agencies, emphasizing the importance of data-driven decision-making. He outlines five critical steps for leveraging GA data, including asking targeted questions, focusing on specific data points, and implementing better data tracking practices. The session also covers essential reports, advanced segments, and practical strategies for improving website performance and understanding audience behavior.


![[DSC Europe 25] Nikolay Burlutskiy - Best Practices for Building Enterprise M...](https://cdn.slidesharecdn.com/ss_thumbnails/uirvaiuvq8y1w8hzd9tx-7-251212103249-2619edb4-thumbnail.jpg?width=640&height=640&fit=bounds)

![[DSC Europe 25] Branko Urosevic -Rethinking Financial Talent: Integrating Cod...](https://cdn.slidesharecdn.com/ss_thumbnails/8jjrus8ttko6qj64f58f-3-251212103250-642c6374-thumbnail.jpg?width=640&height=640&fit=bounds)
![[DSC Europe 25] Jovan Bogicevic - Legacy to AI-Driven Defense: Transforming D...](https://cdn.slidesharecdn.com/ss_thumbnails/rsarluadt563hntyfc8q-3-251211083849-3e7bc4c0-thumbnail.jpg?width=640&height=640&fit=bounds)
![[DSC Europe 25] Behzad Hosseini - AI Agents in the Wild: Deploying Models tha...](https://cdn.slidesharecdn.com/ss_thumbnails/3qtejajvsjqrzwfept2c-10-251212103250-7f2b1068-thumbnail.jpg?width=640&height=640&fit=bounds)
![[DSC Europe 25] Jon Dajci - Bridging TradFi and DeFi: Building the Future of ...](https://cdn.slidesharecdn.com/ss_thumbnails/fqmhfvlbqhkihjvqvhmu-7-251211083849-6af7e325-thumbnail.jpg?width=640&height=640&fit=bounds)
![[DSC Europe 25] Aleksandra Dragicevic - AI-Boosted Research in Healthcare: Fr...](https://cdn.slidesharecdn.com/ss_thumbnails/iqwngszurf2r7pi1lnnj-4-aleksandra-dragicevic-ad-dsc-europe-conference-20-251208151905-37c3238a-thumbnail.jpg?width=640&height=640&fit=bounds)


![[DSC Europe 25] Branko Dzakula - From Defense to Attack: How AI Redefines Cyb...](https://cdn.slidesharecdn.com/ss_thumbnails/80bdzdxpr3ky2g0qvyk9-8-251211083048-ce5fc1ee-thumbnail.jpg?width=640&height=640&fit=bounds)
![[DSC Europe 25] Marija Vlajkovic & Andrea Radonjanin - Integration of AI tool...](https://cdn.slidesharecdn.com/ss_thumbnails/qf1jrglttoc3bm8s3aop-final-integration-of-ai-tools-251208151905-394f3a6a-thumbnail.jpg?width=640&height=640&fit=bounds)

![[DSC Europe 25] Hans Kleinsman - The Compliance Gearbox: How Tax Tech Mediate...](https://cdn.slidesharecdn.com/ss_thumbnails/dxdytie1toel0hr90bjs-2-251212103250-174fdbe7-thumbnail.jpg?width=640&height=640&fit=bounds)


![[DSC Europe 25] Milan Zdravkovic - The road less traveled in District Heating...](https://cdn.slidesharecdn.com/ss_thumbnails/nfaboniqwsz4ucyctnmy-2-milan-zdravkovic-dsc2025-the-road-less-traveled-in-district-heating-operation-251208151905-f56388a5-thumbnail.jpg?width=640&height=640&fit=bounds)
![[DSC Europe 25] Dragana Ilic - AI for Big Data in Astronomy.pptx](https://cdn.slidesharecdn.com/ss_thumbnails/8palya86qaatvjhva1ms-2-dragana-ilic-ai-ilic-251208151906-652b819c-thumbnail.jpg?width=640&height=640&fit=bounds)