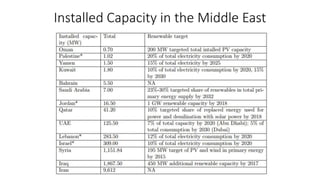
1) Hiba Naffaa is evaluating the use of a supercritical CO2 turbine cycle for a 100 MW solar power tower plant in Lebanon under the direction of Prof. Michael Driscoll and Dr. Koroush Shirvan at MIT.
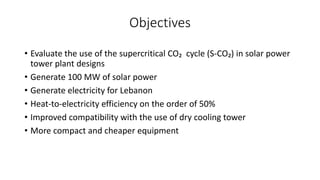
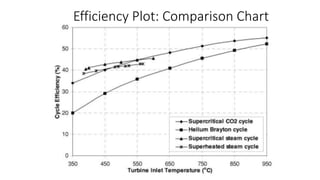
2) The objectives are to generate solar power with a heat-to-electricity efficiency of around 50% using the supercritical CO2 cycle and dry cooling.
3) An advanced form of power tower conversion using supercritical CO2 has advantages over steam cycles and physical testing is needed, with Julich proposed as the best option.