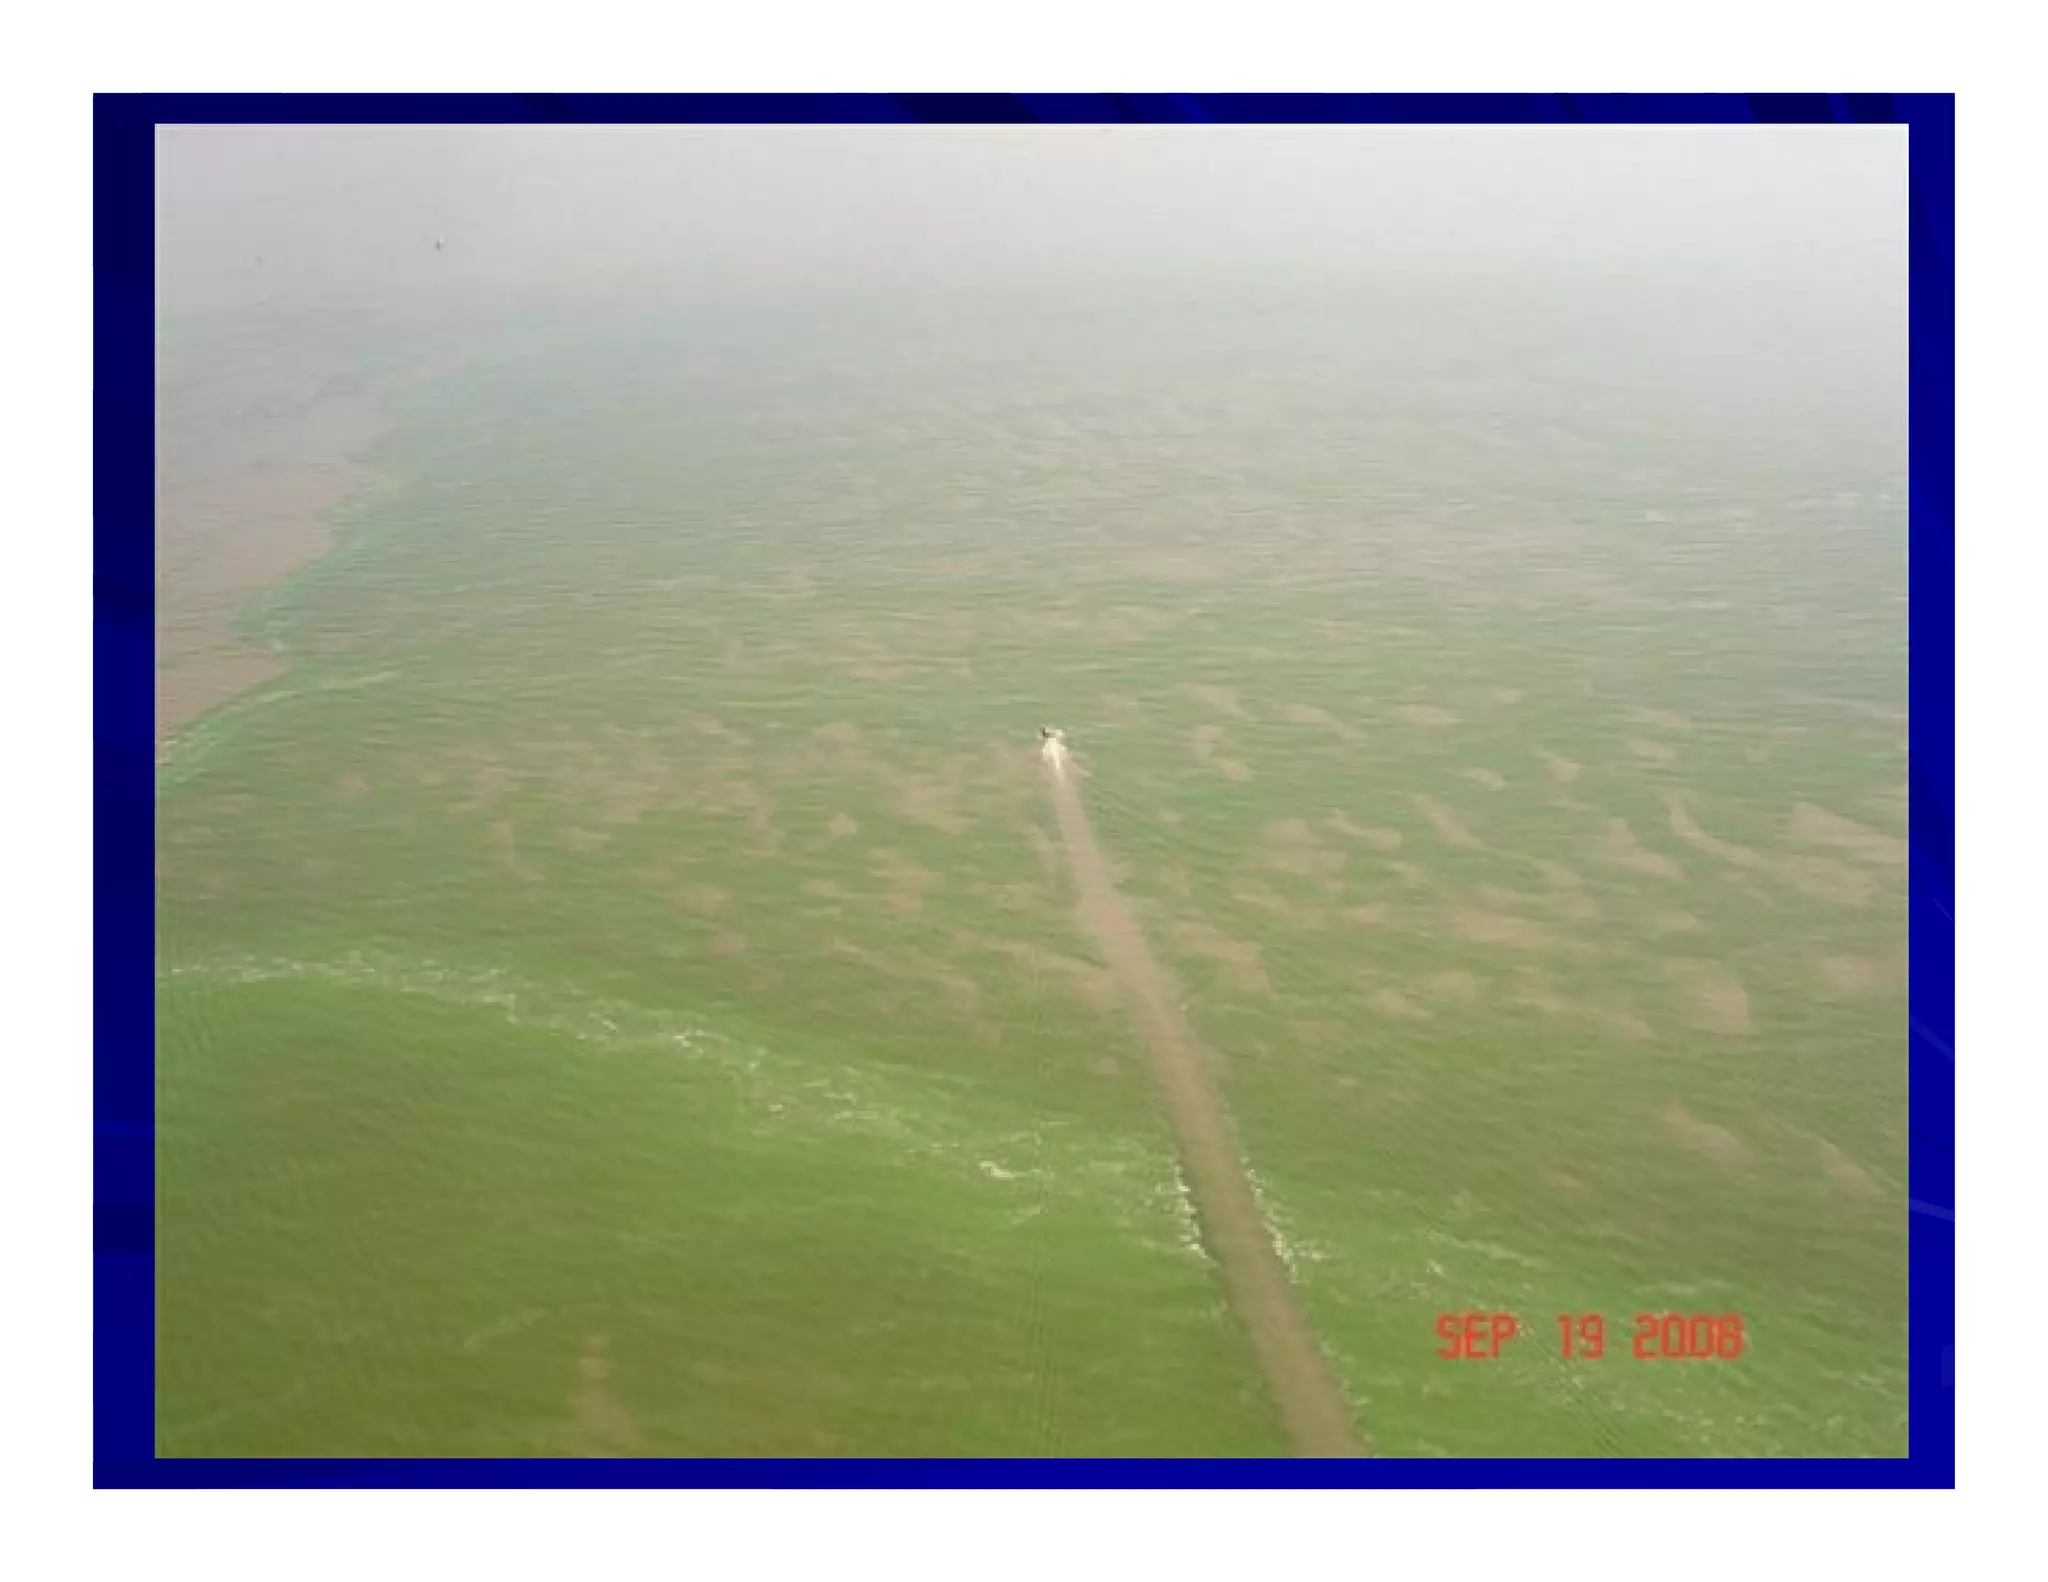
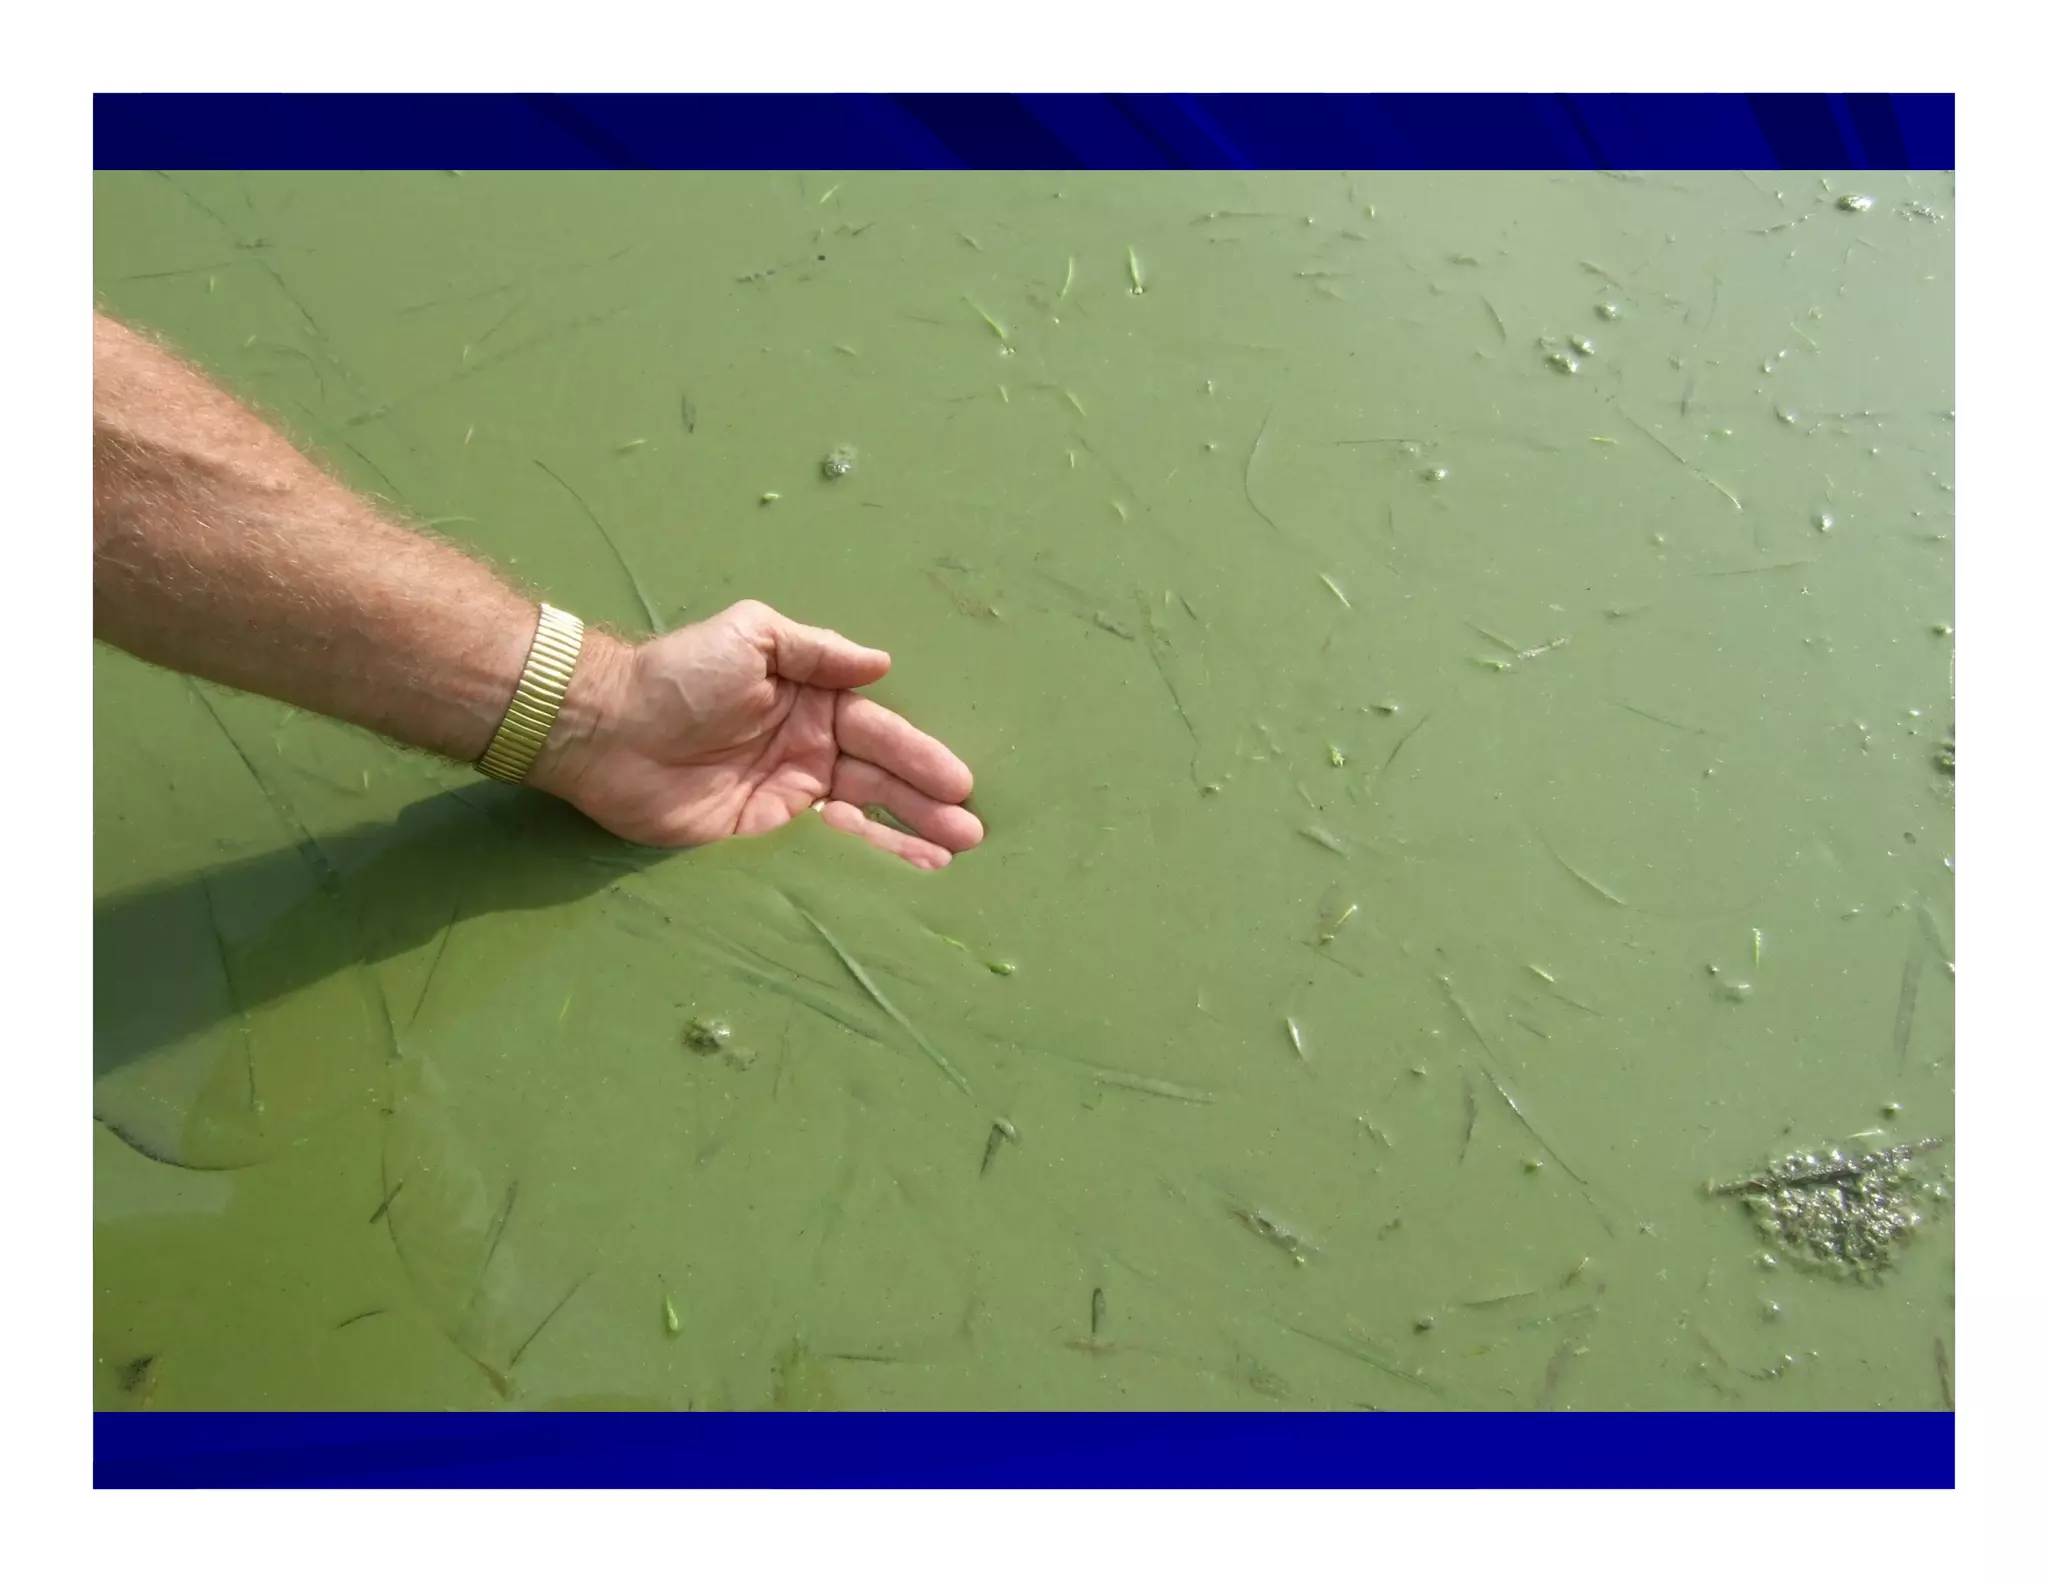
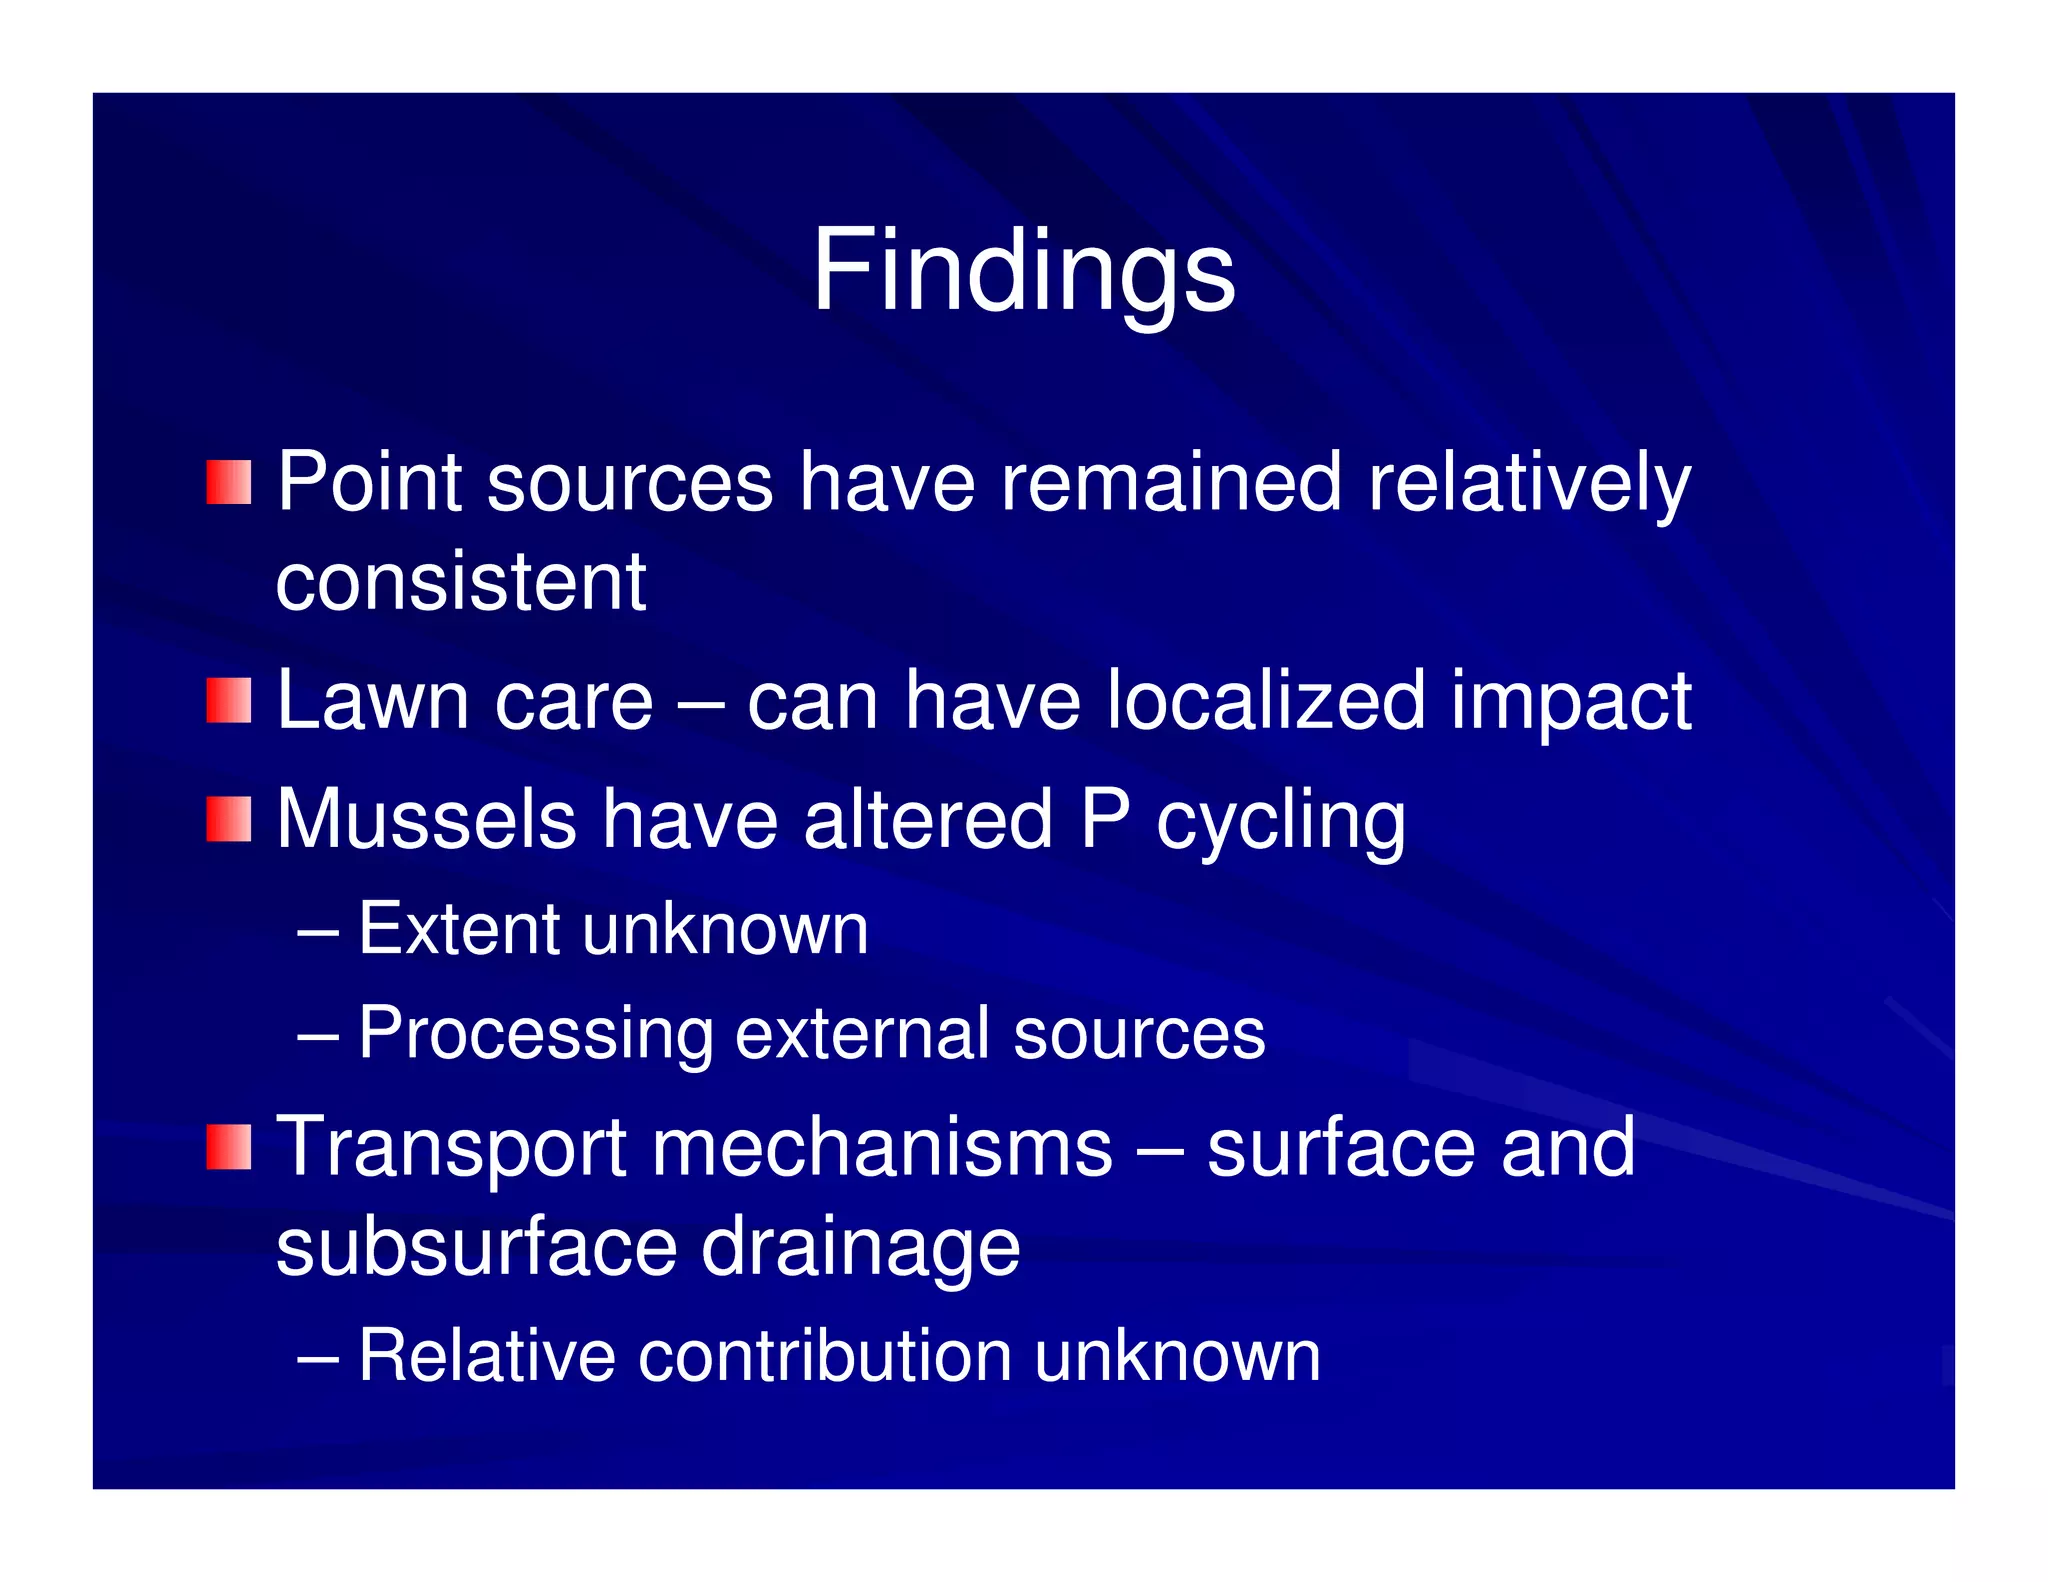
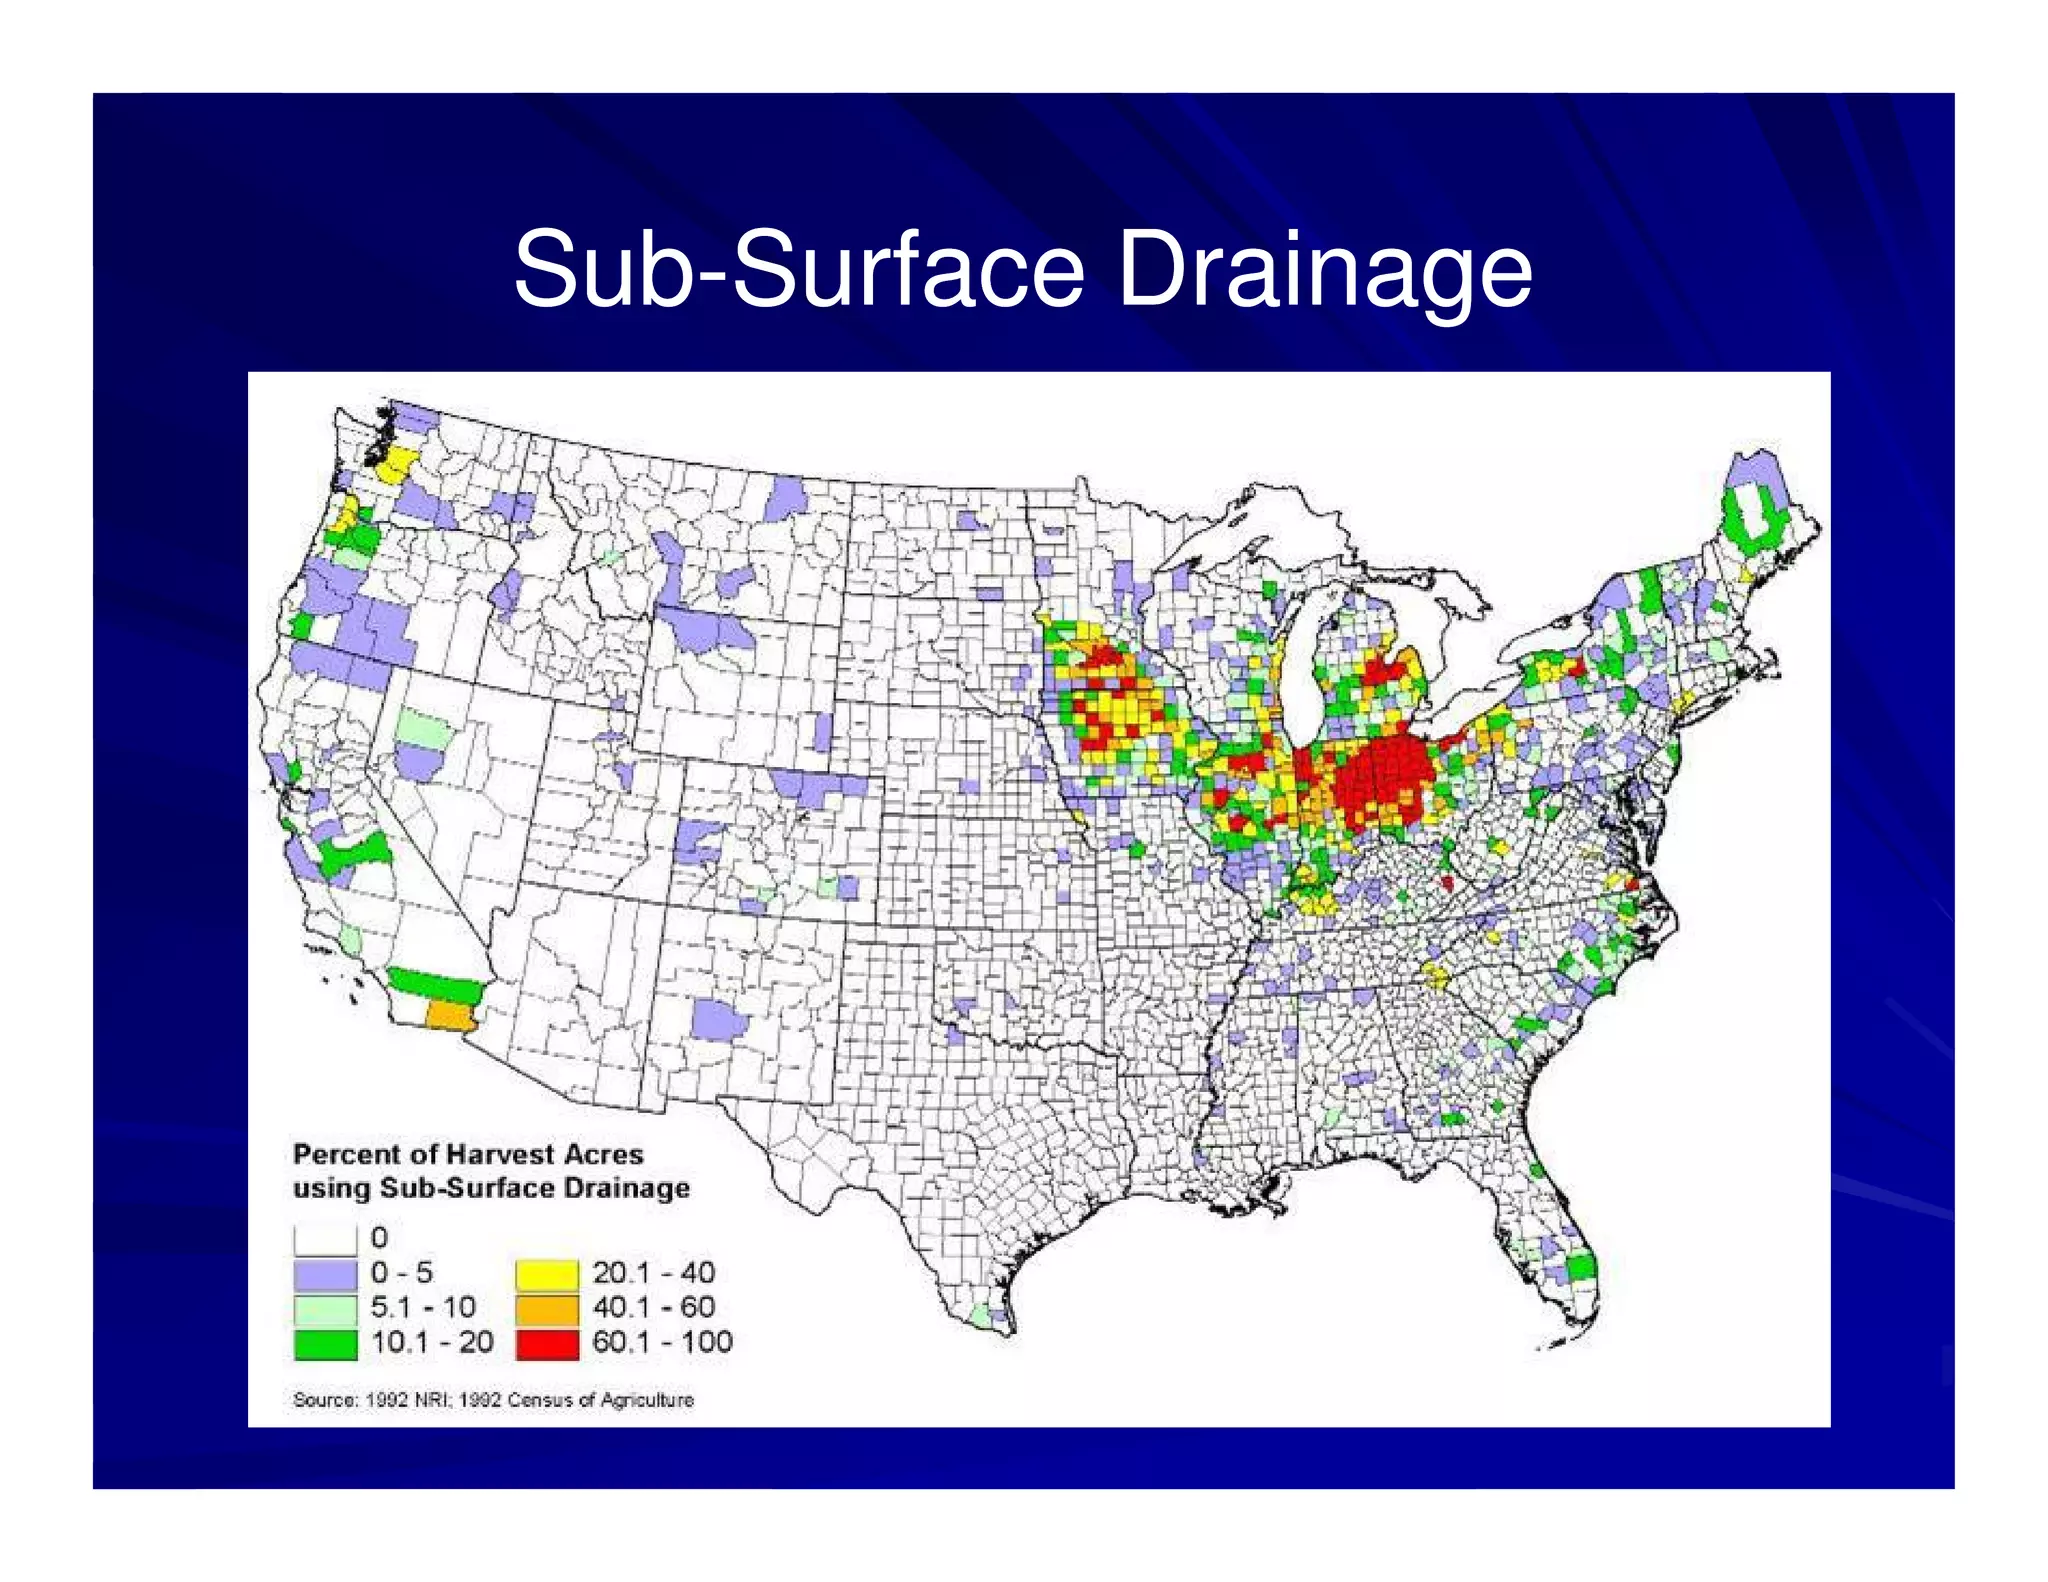
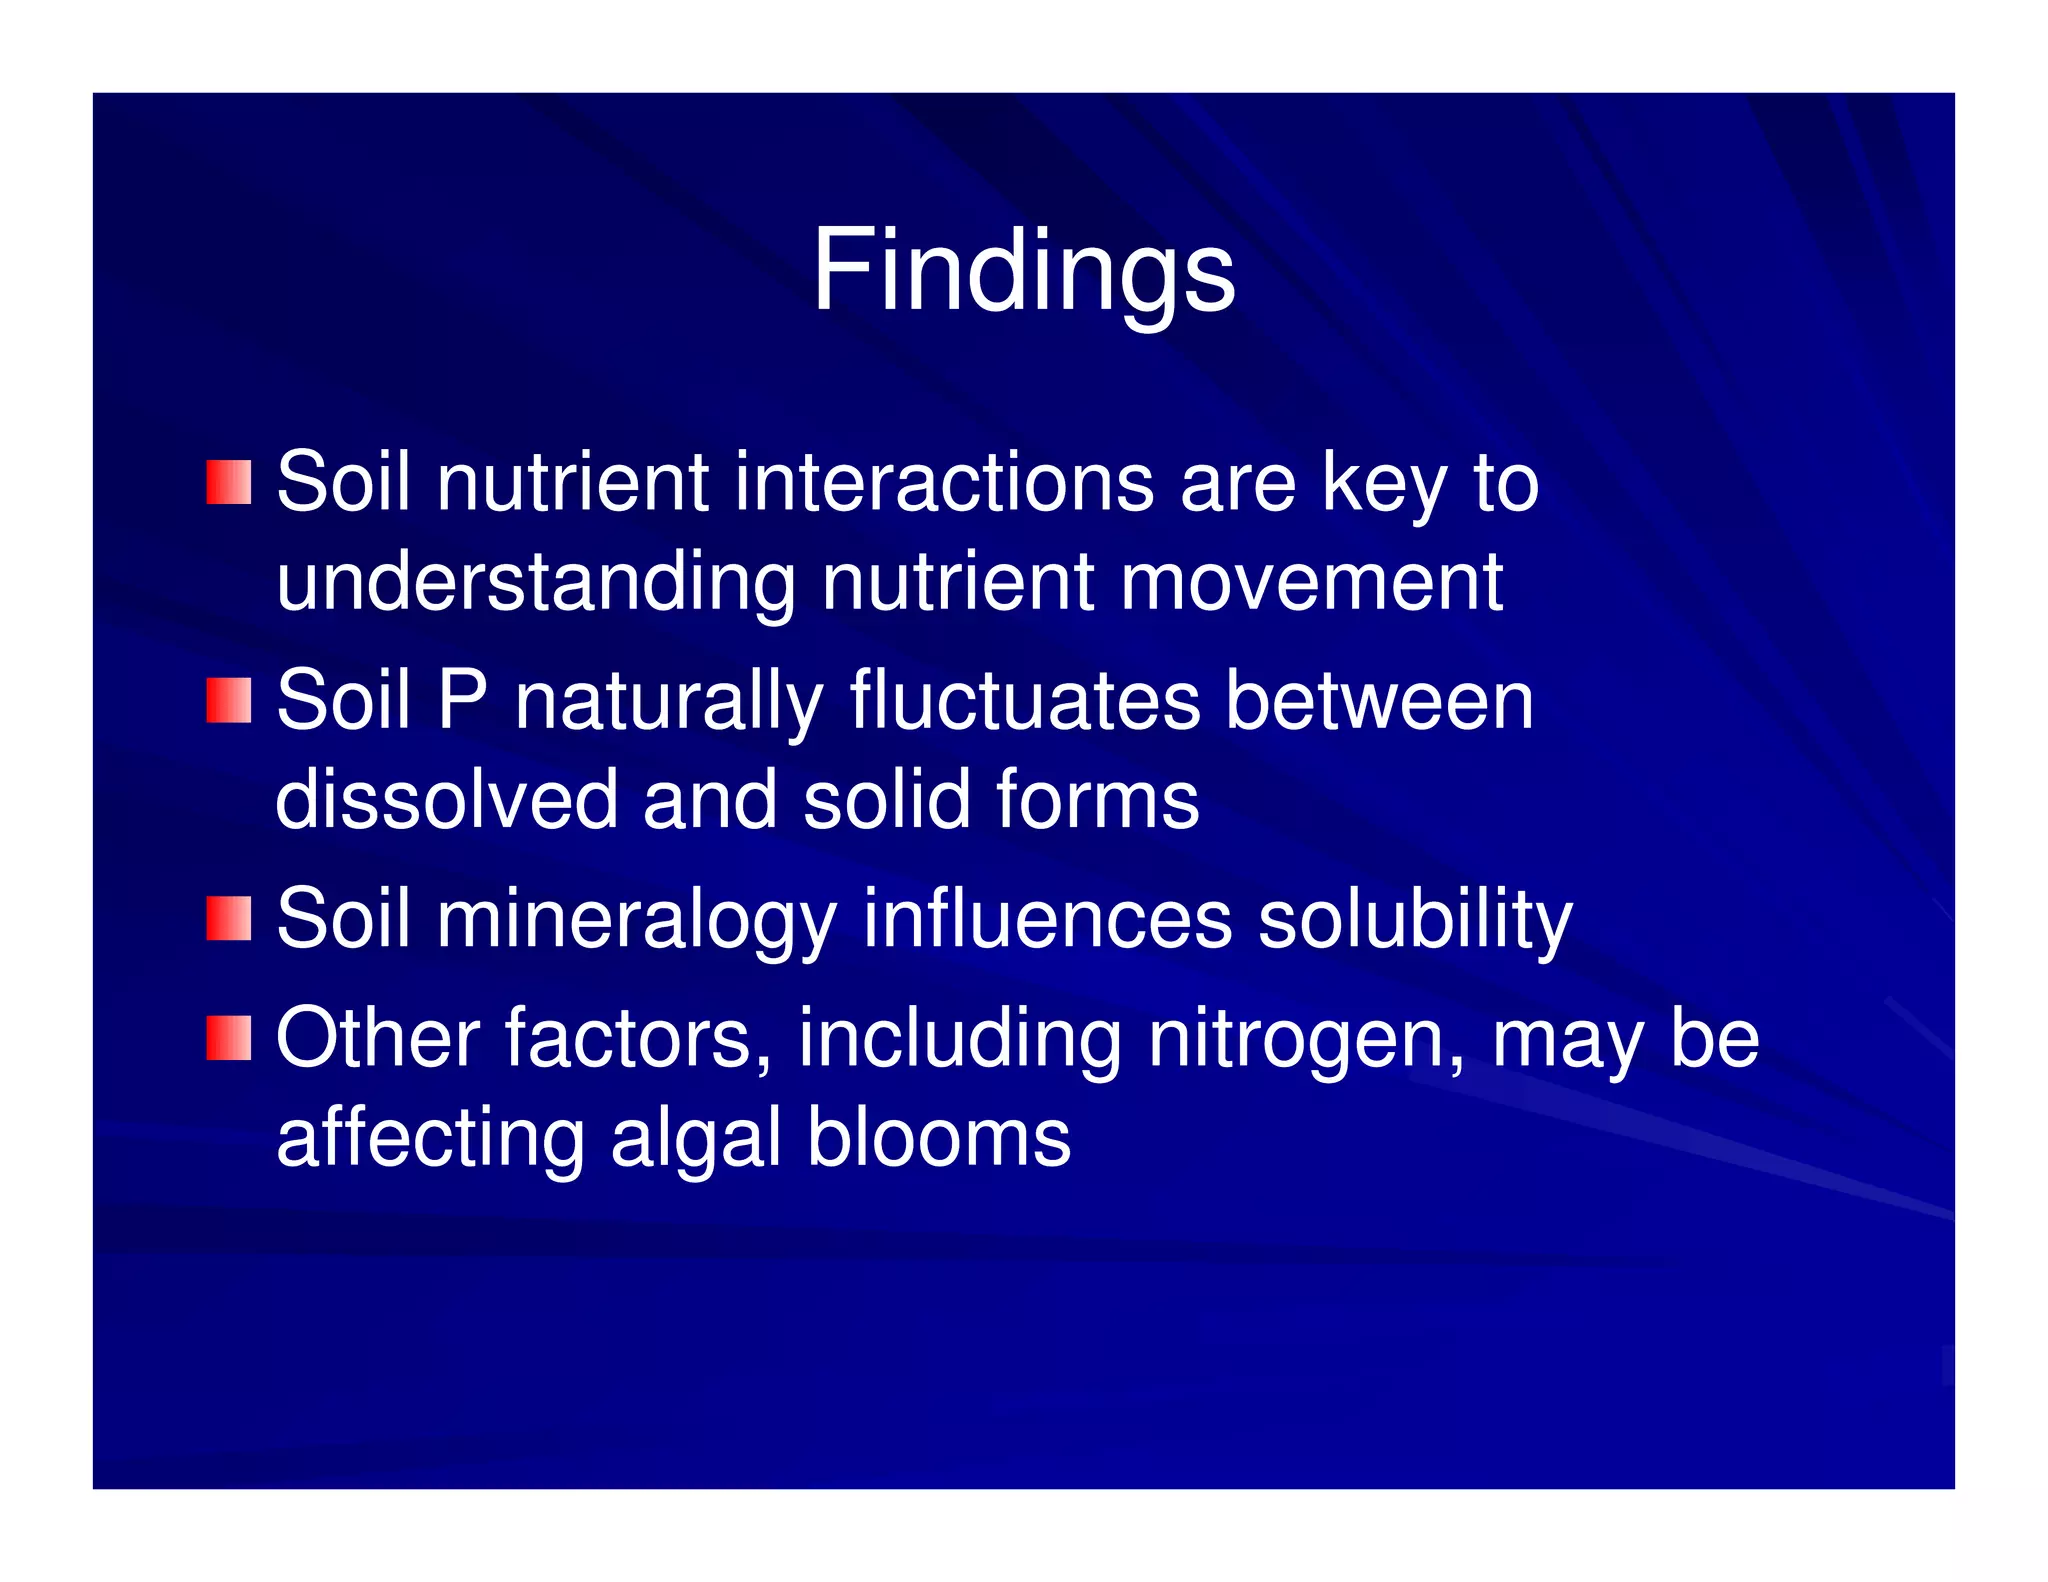
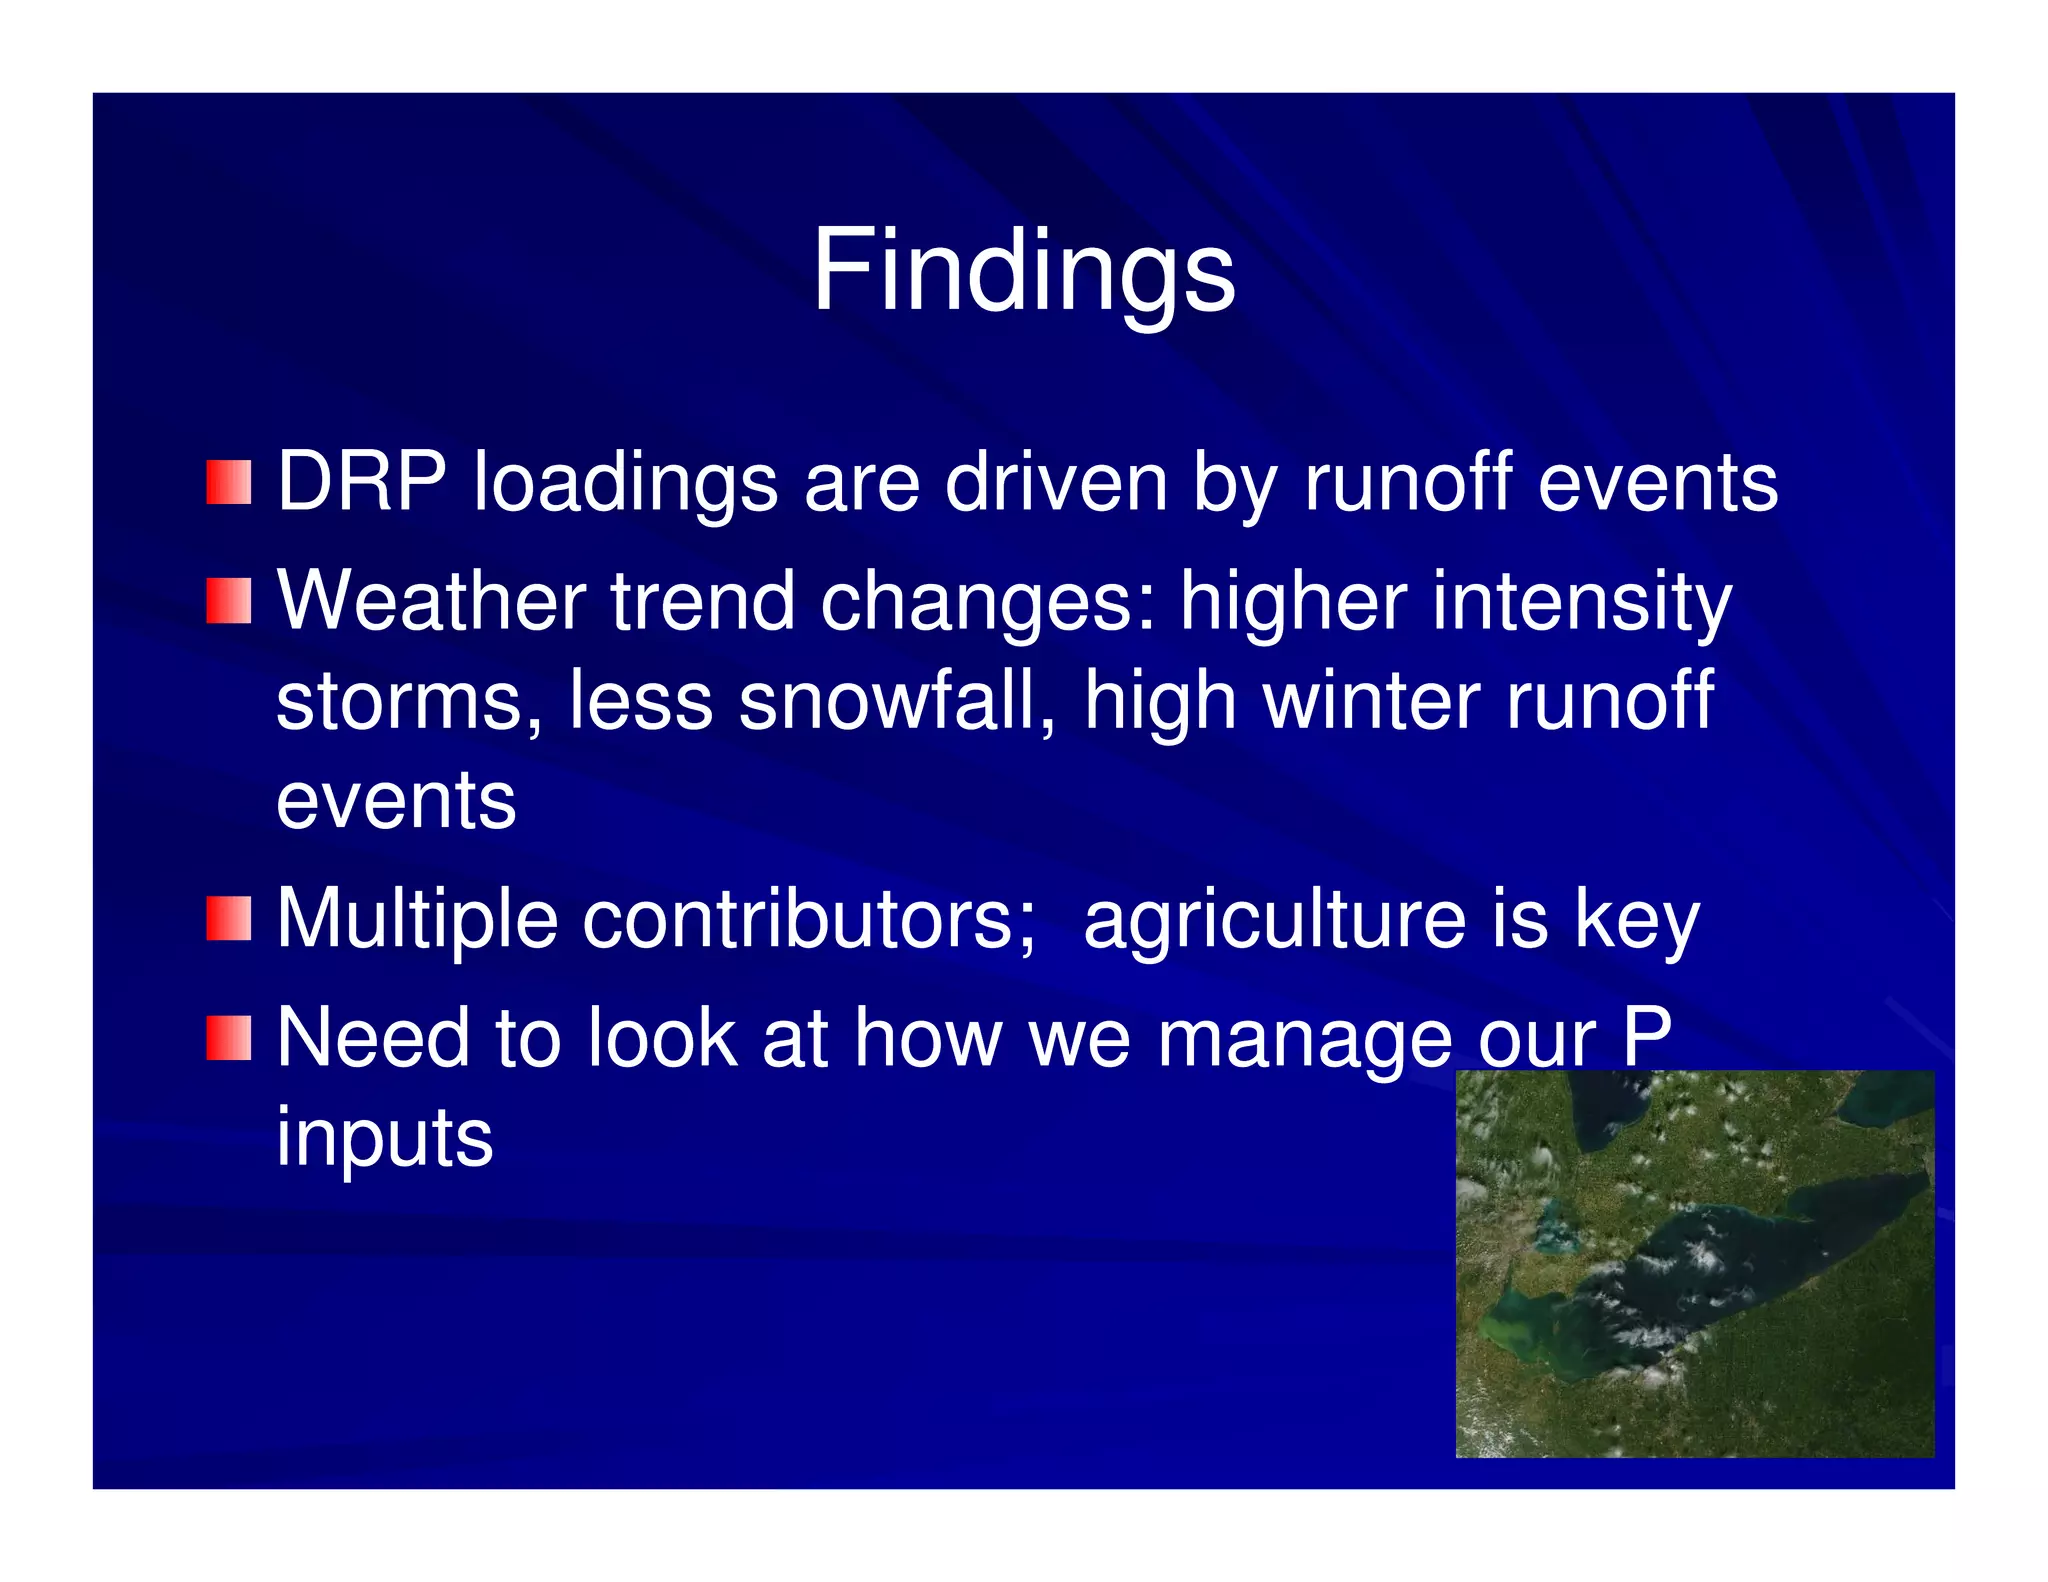
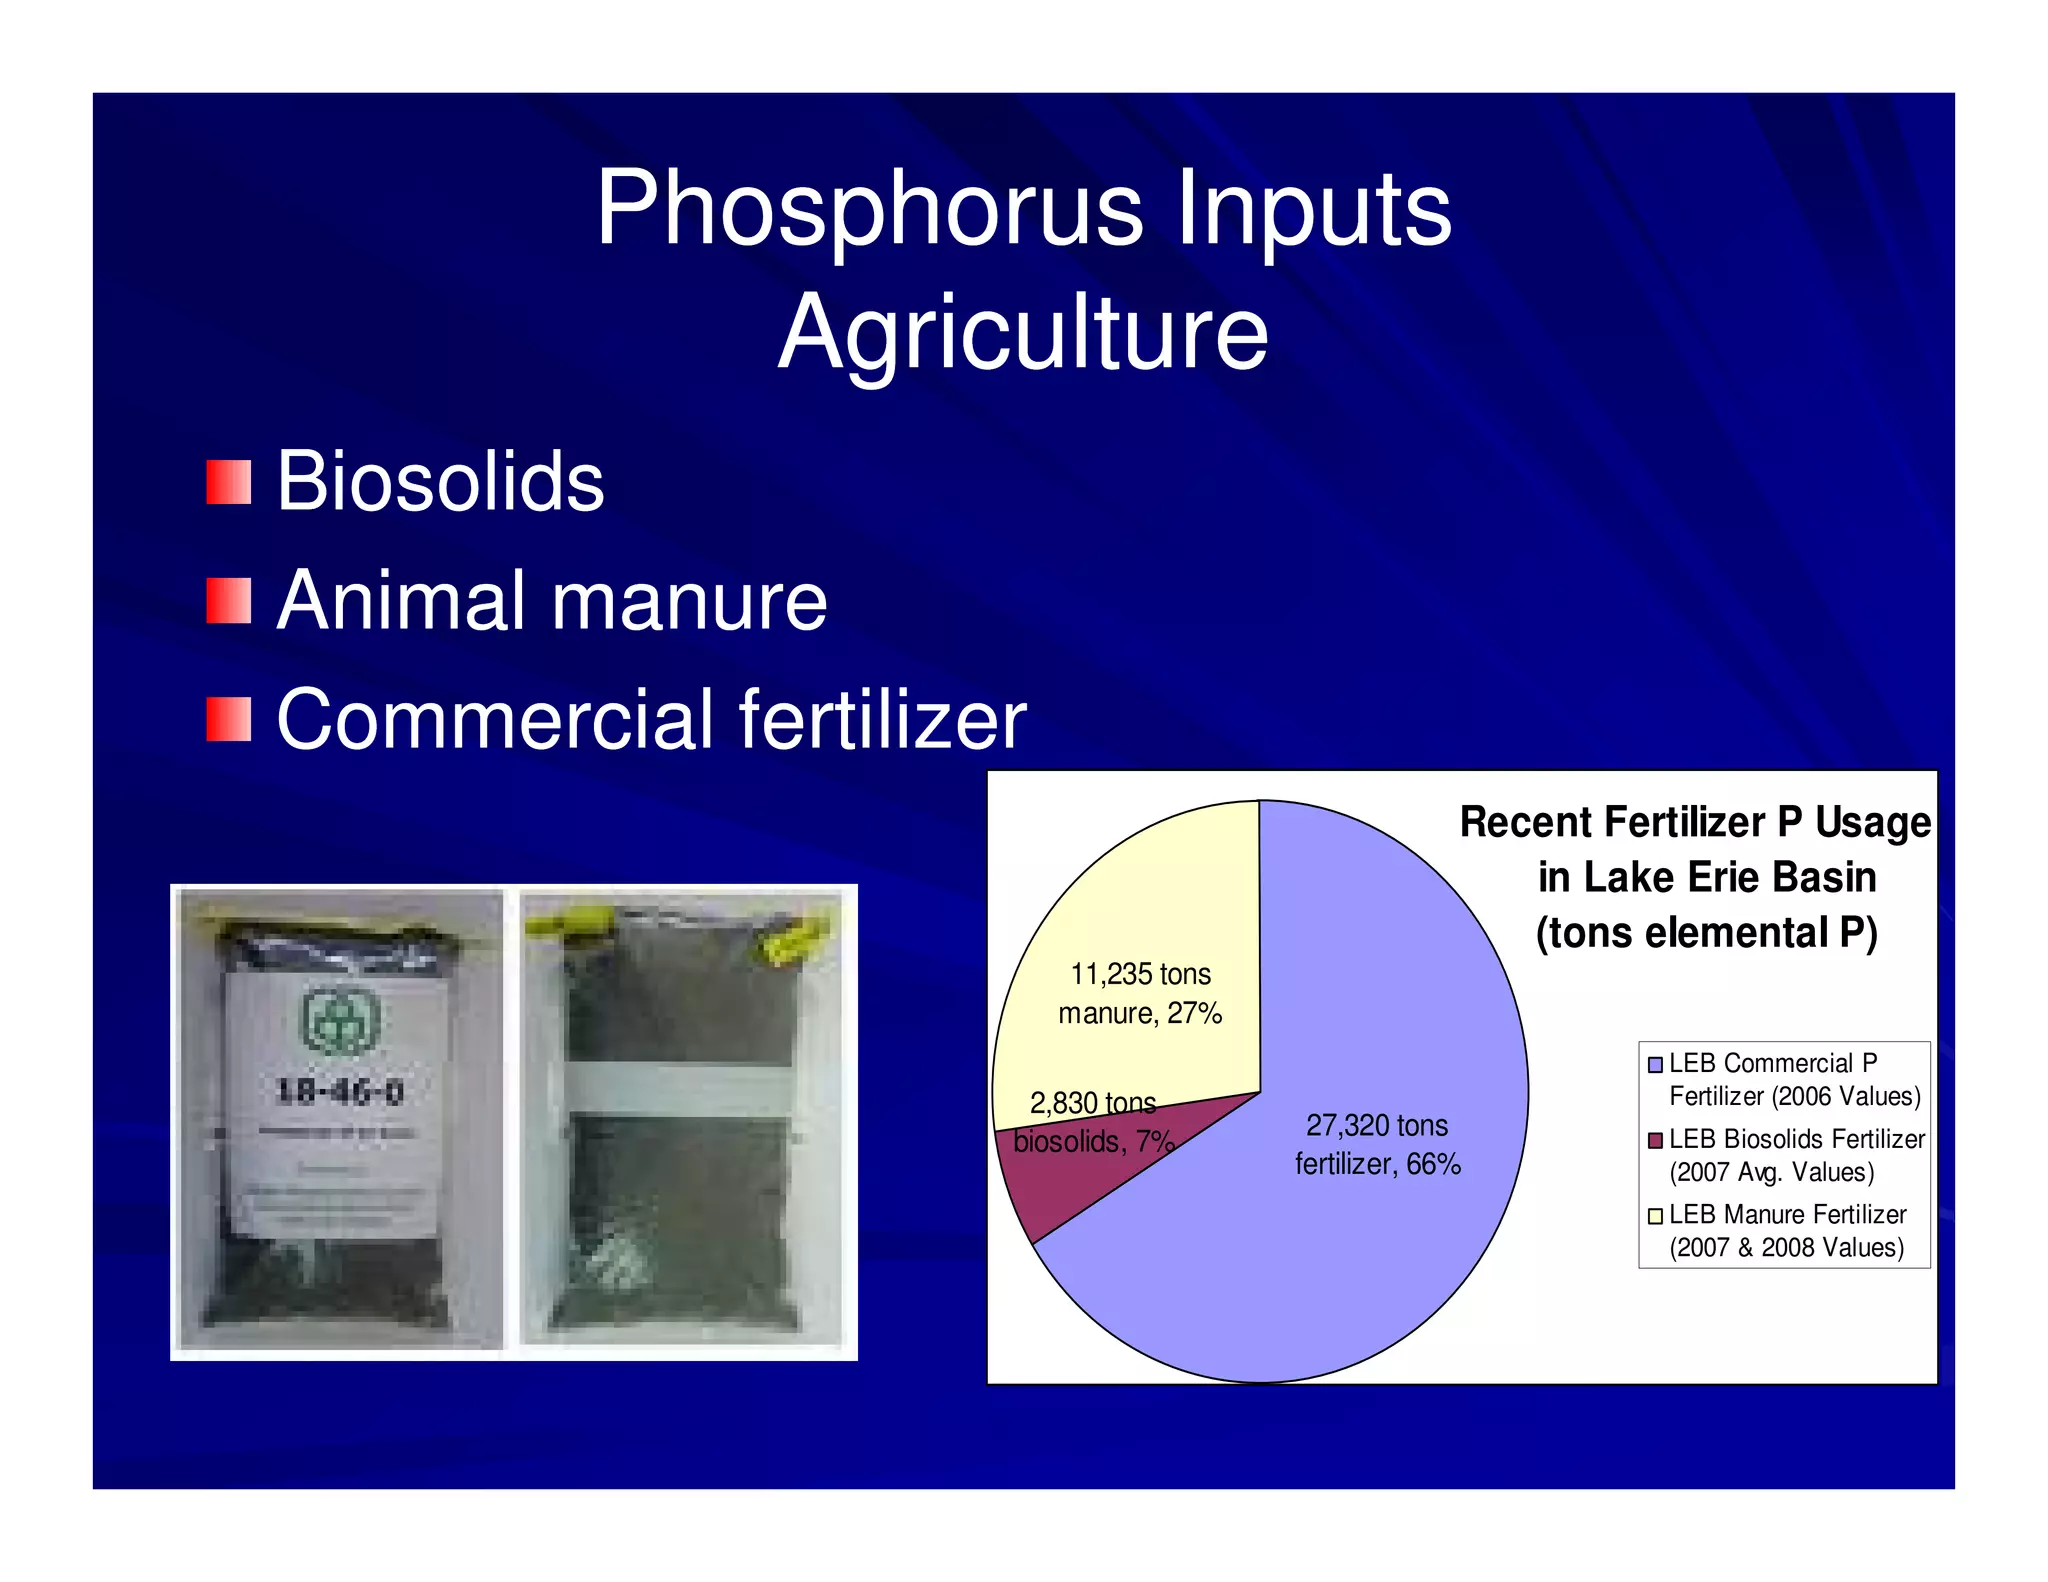
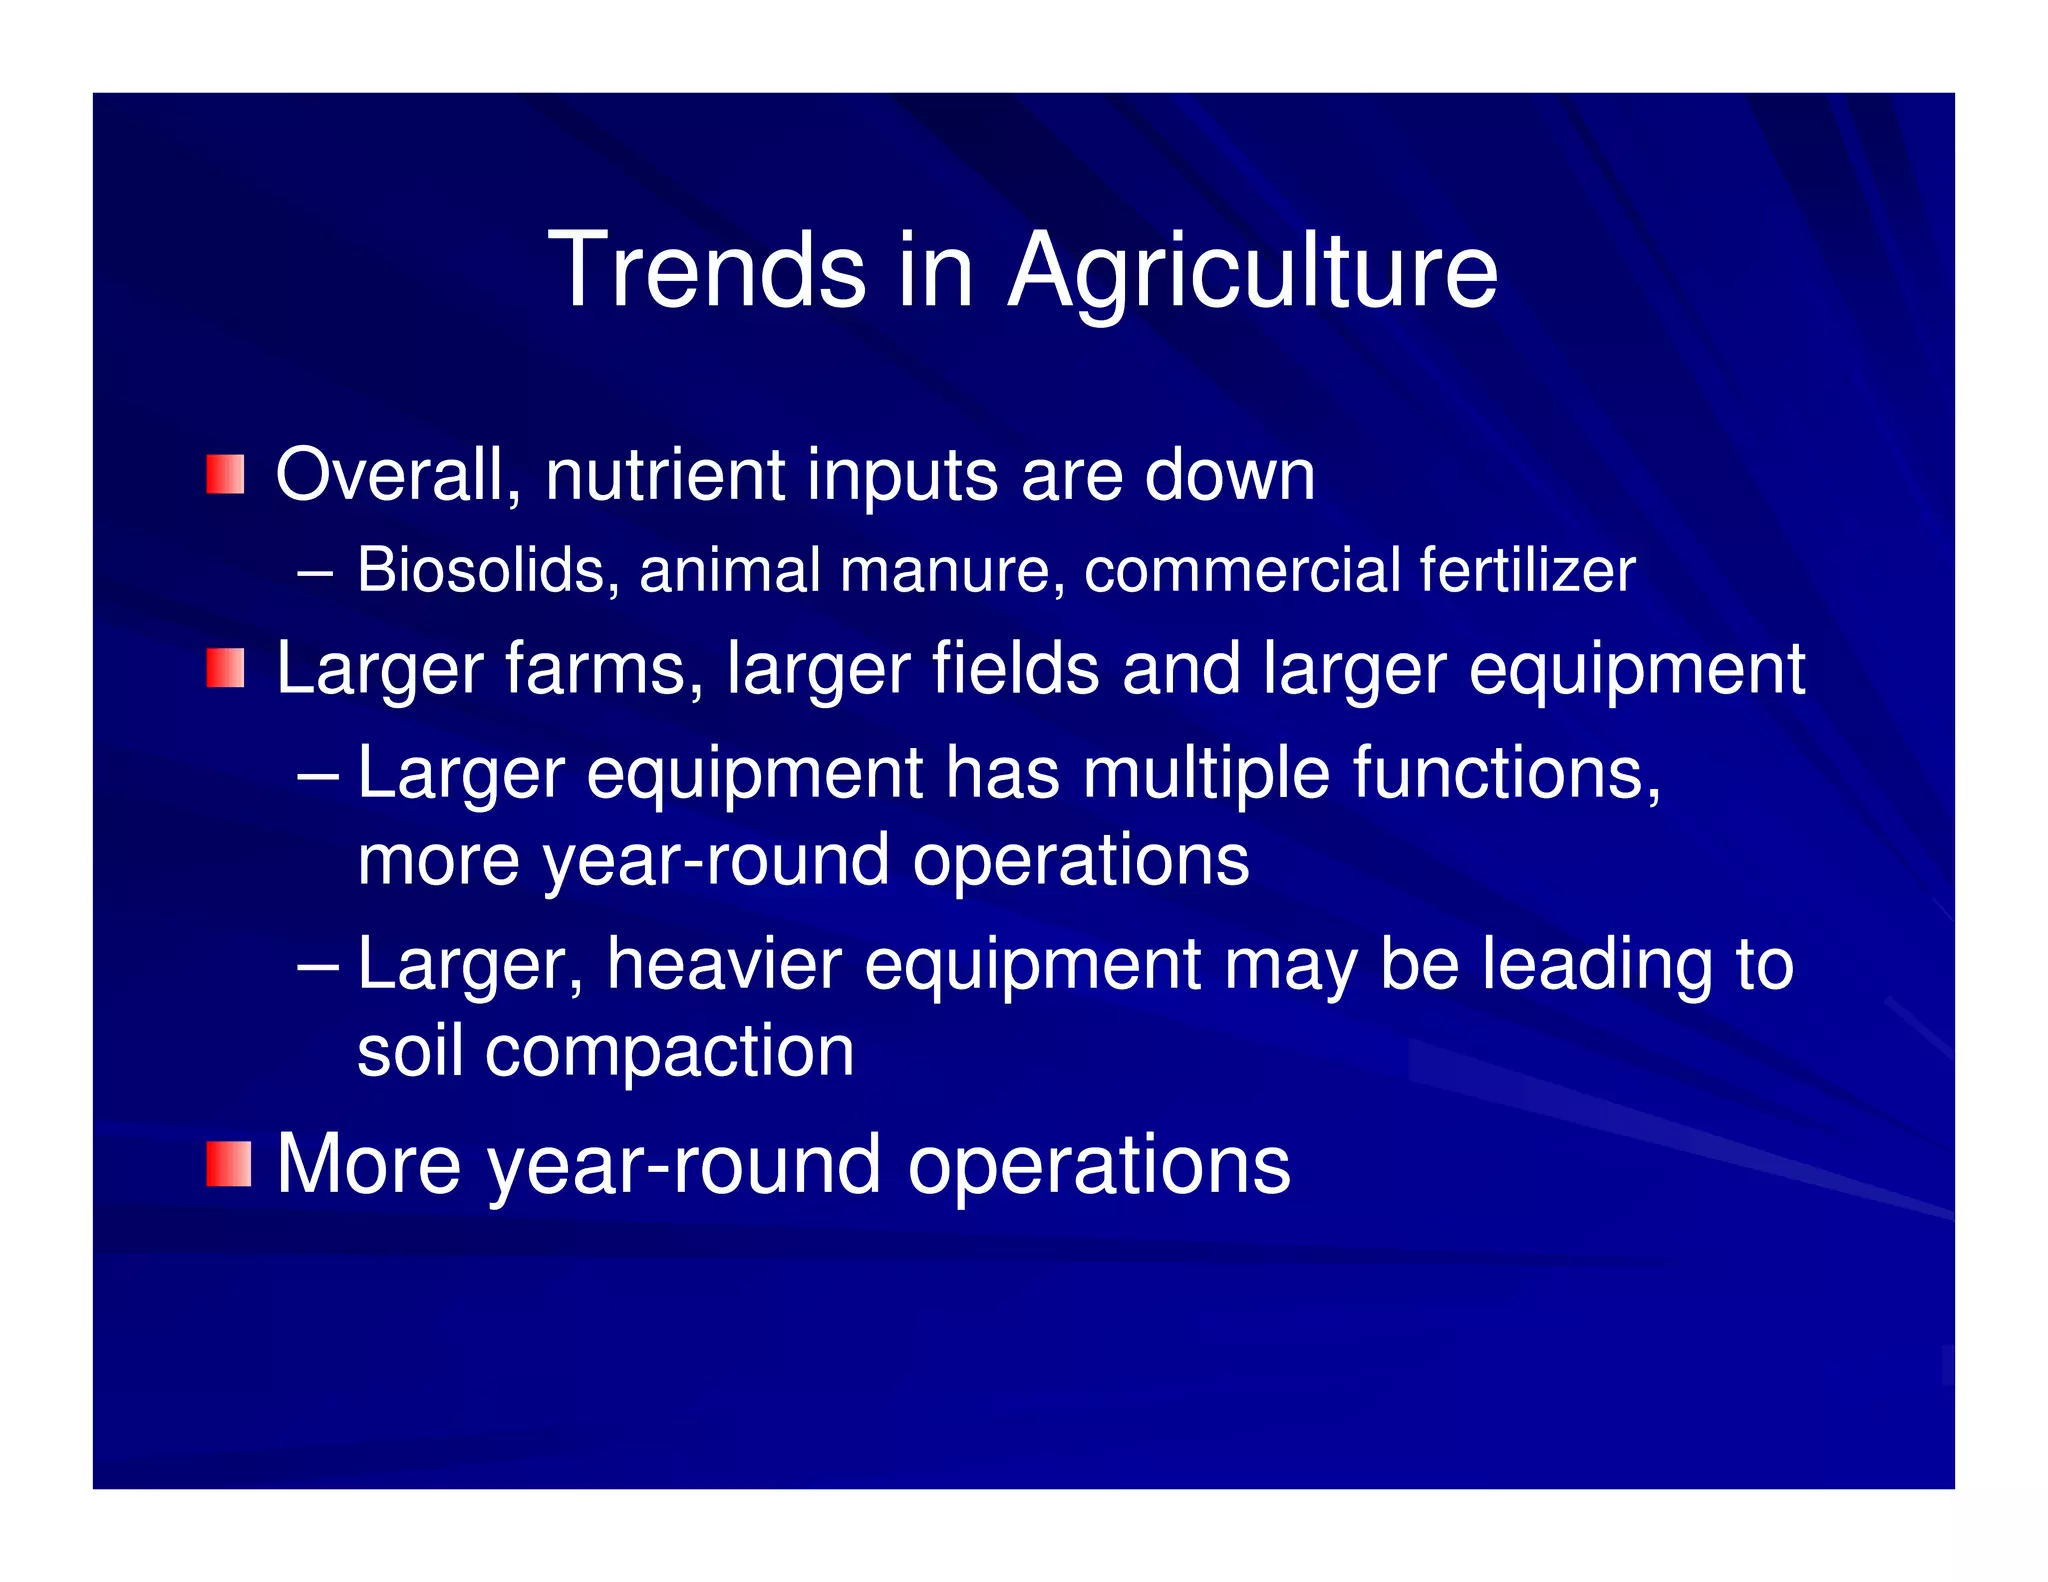
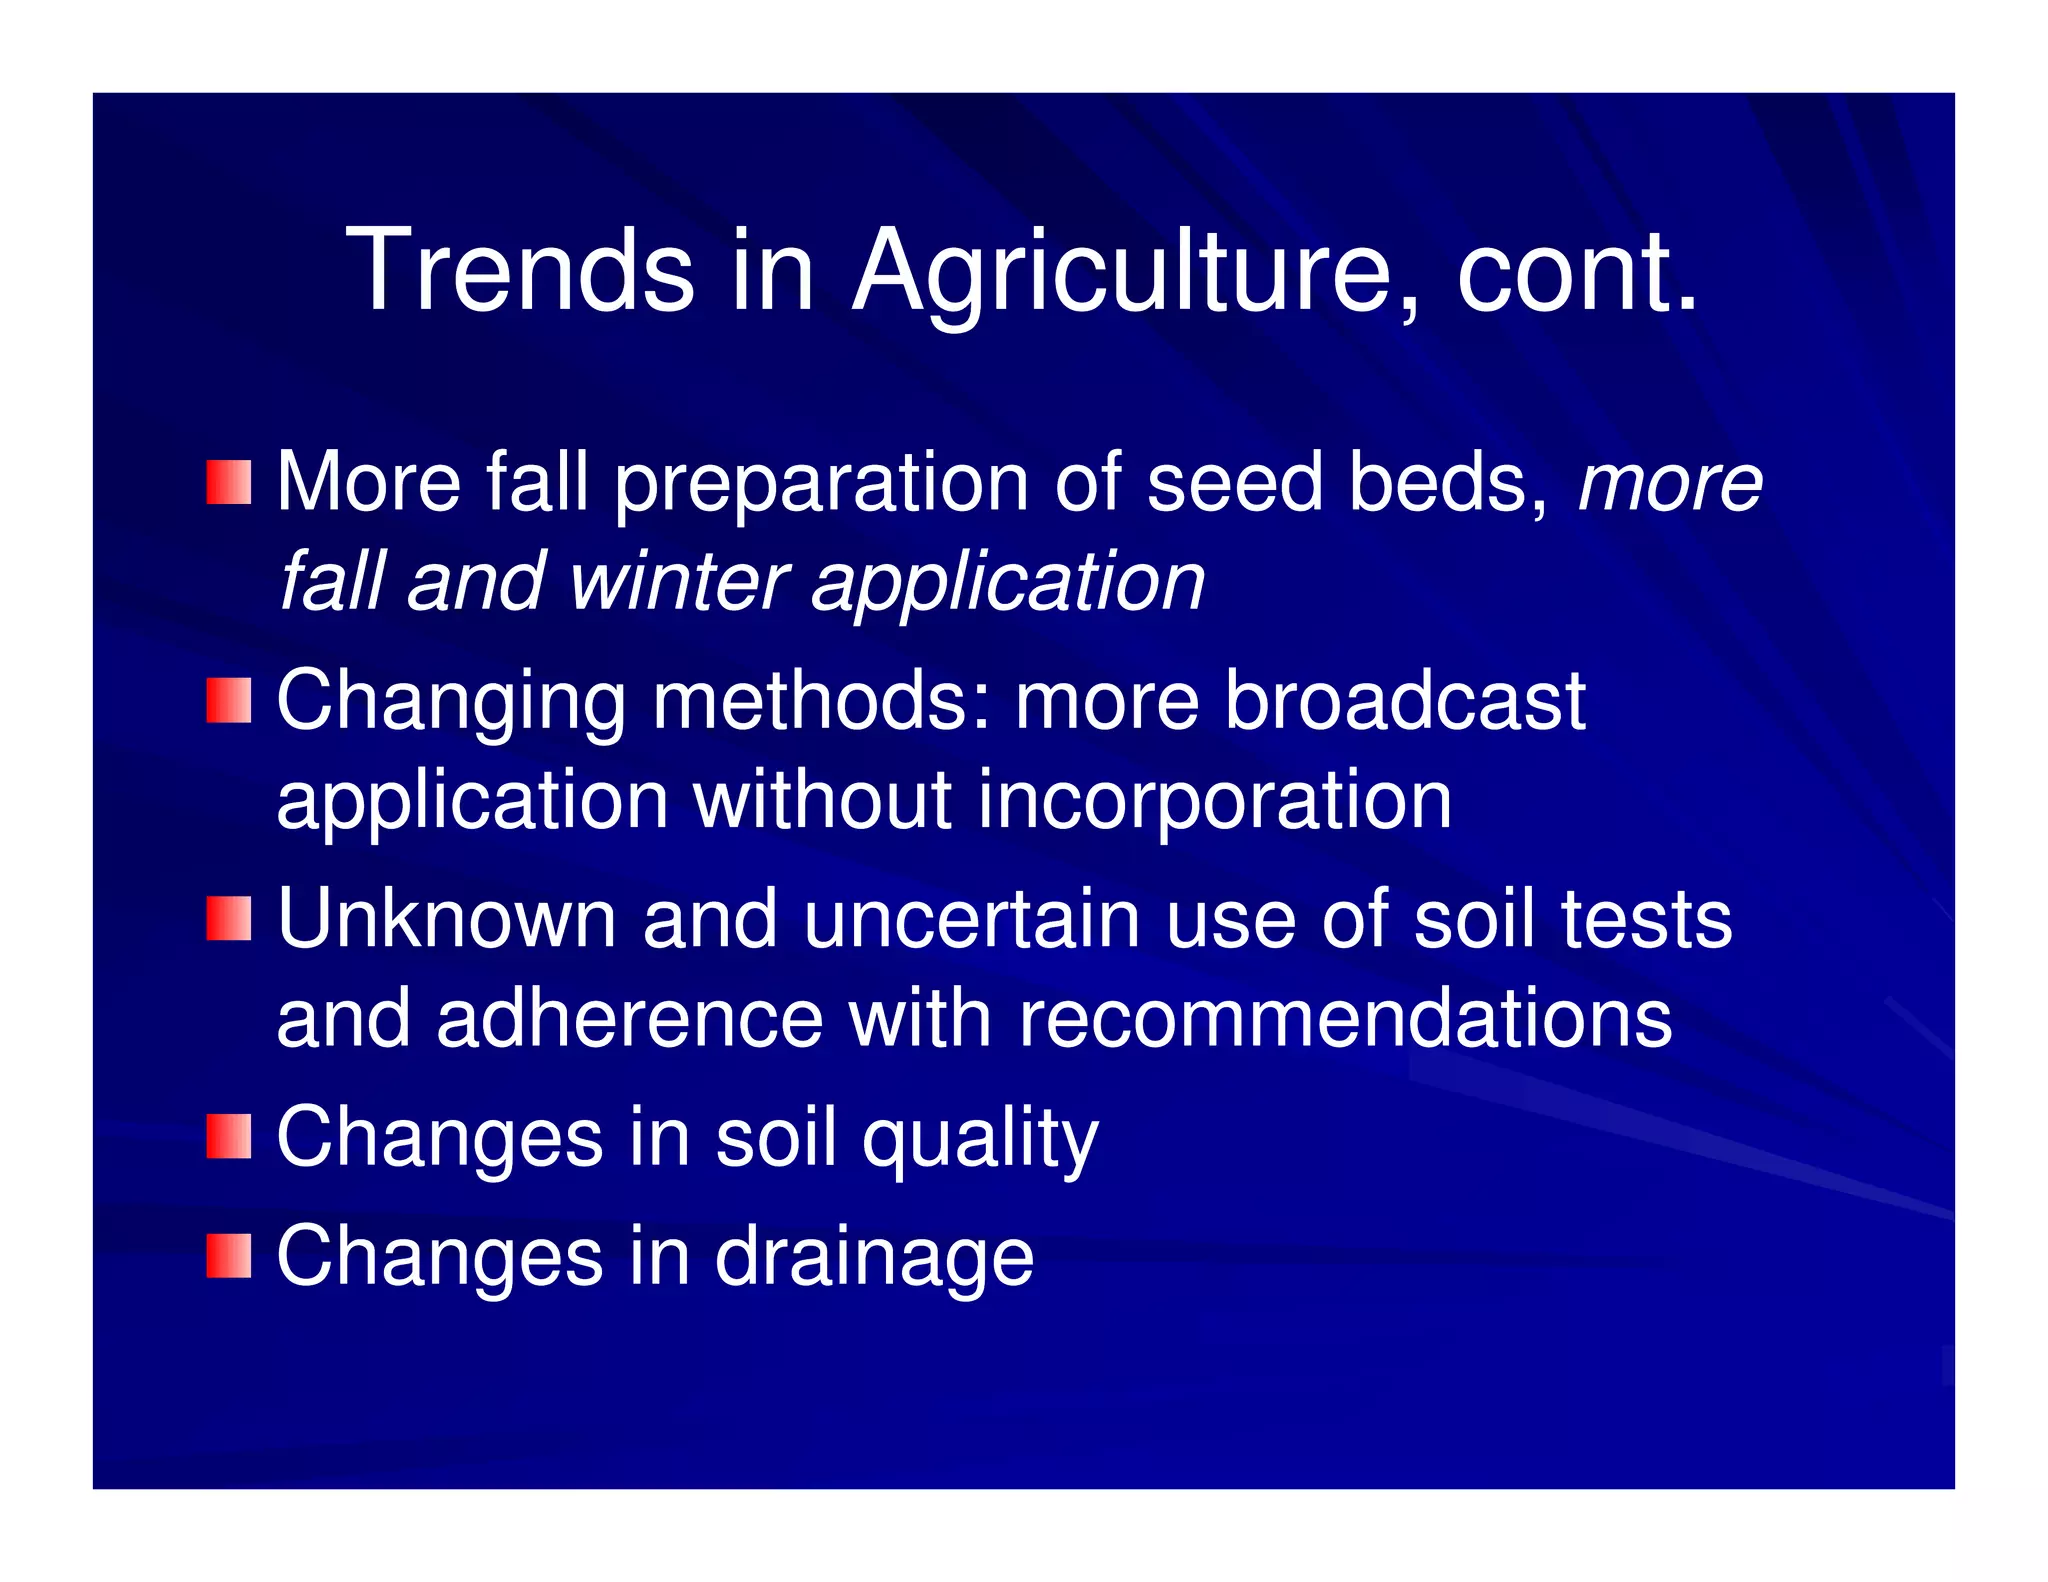
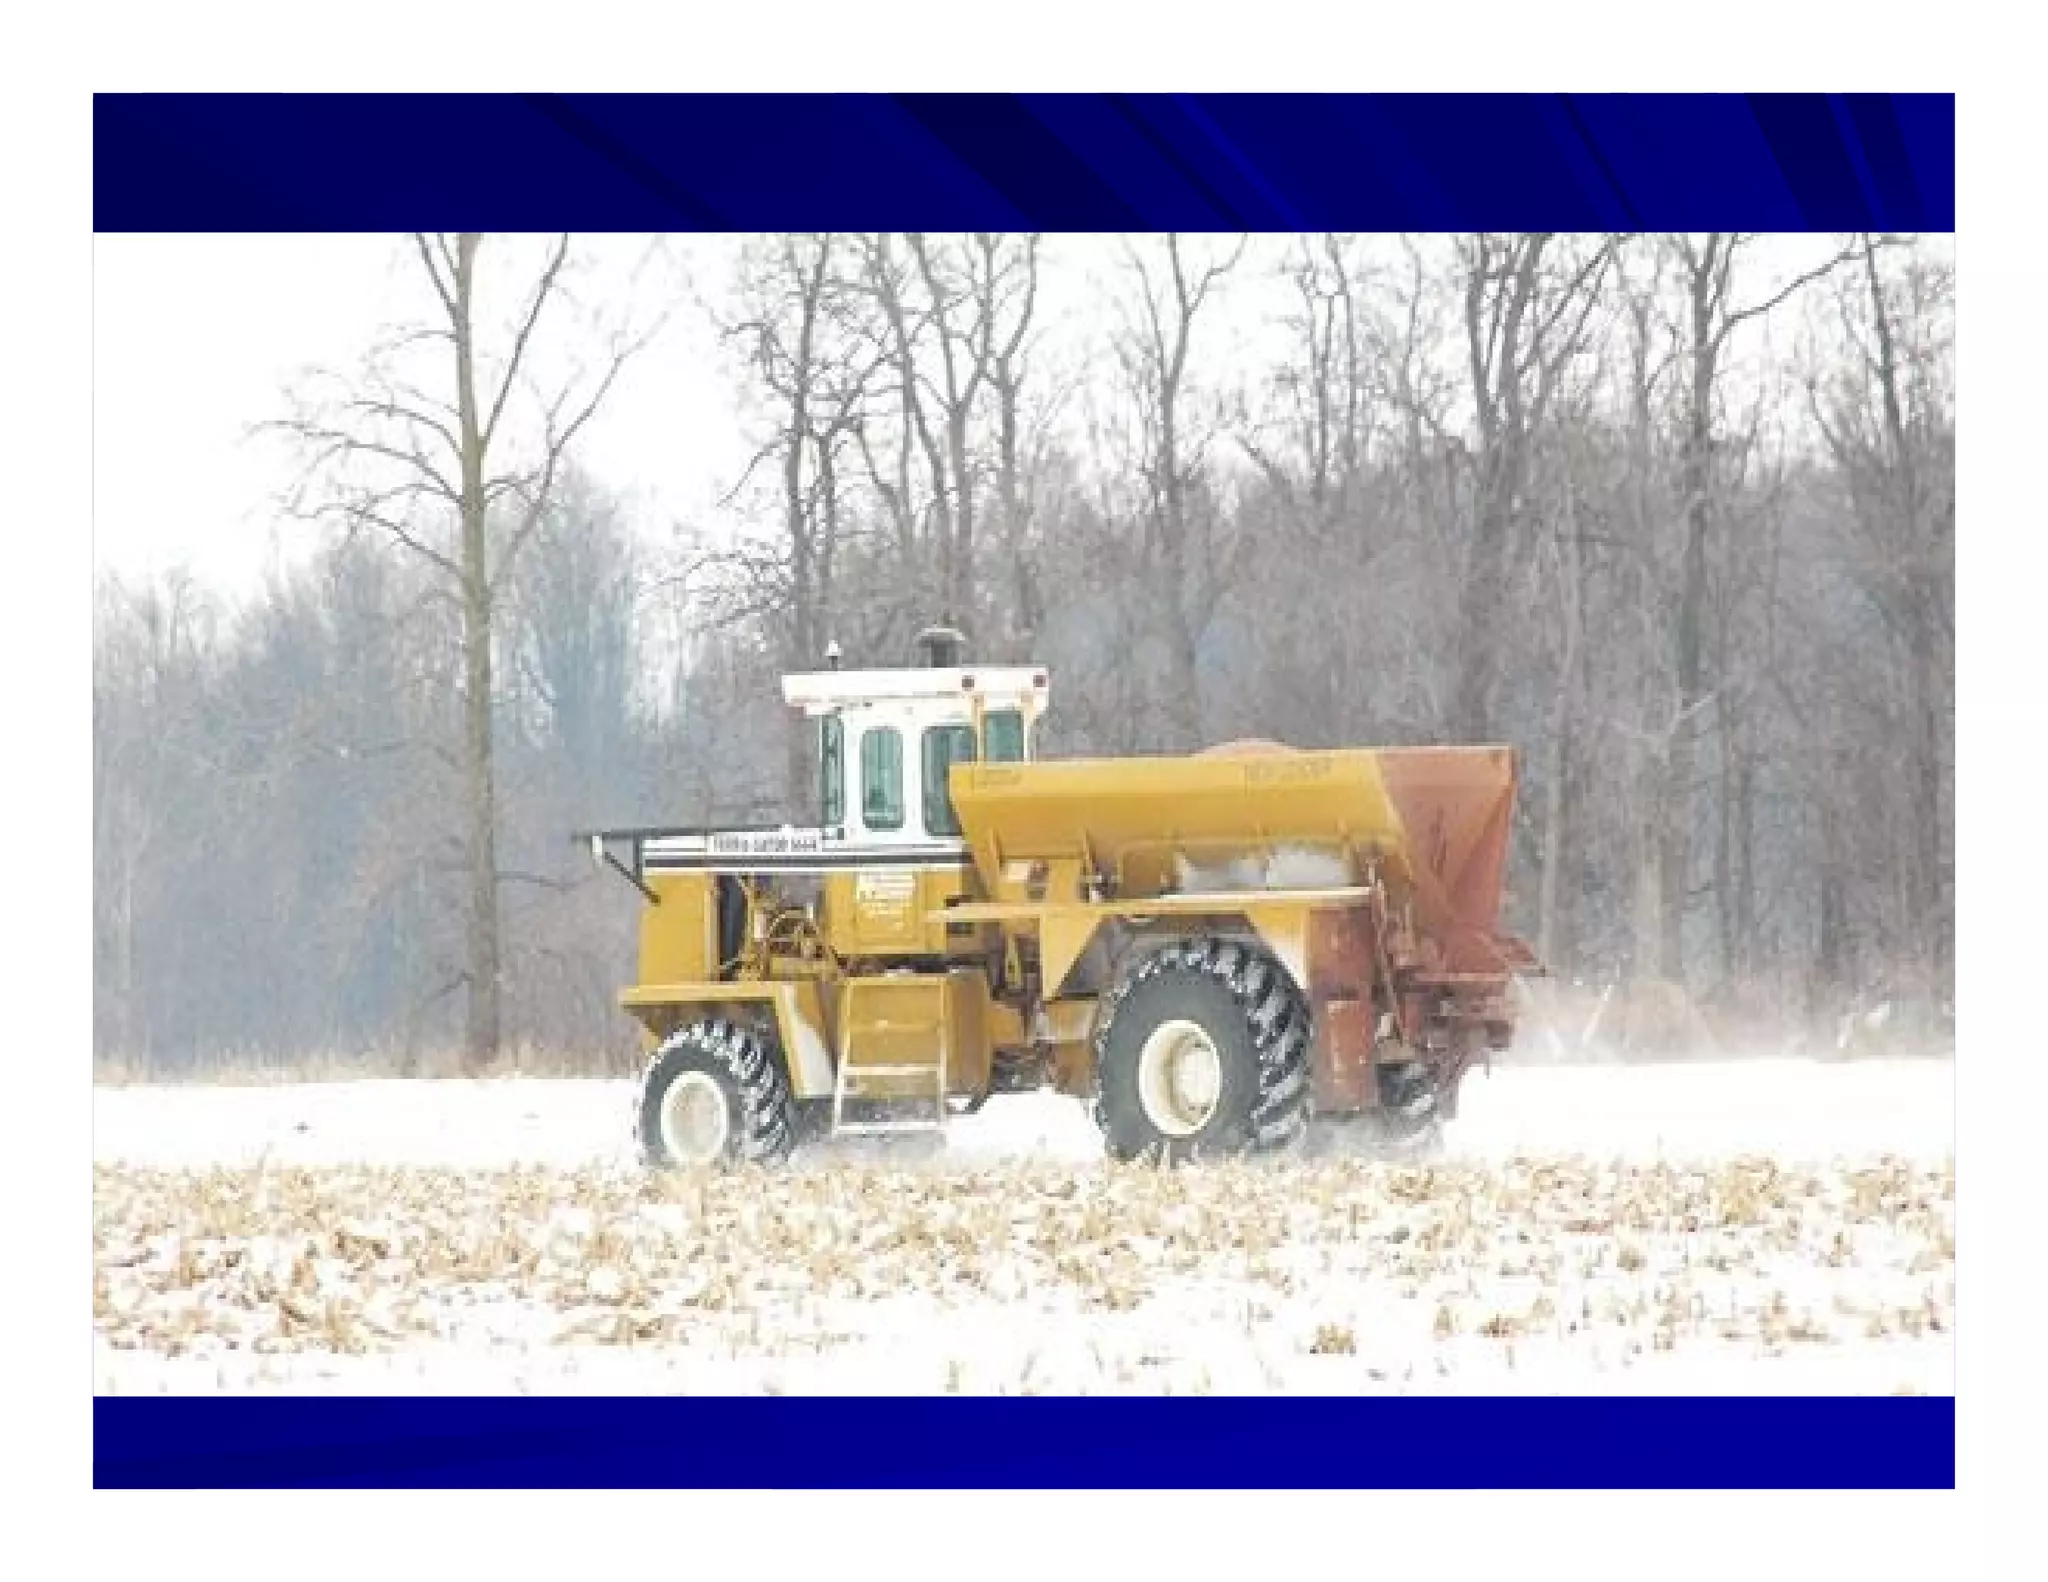
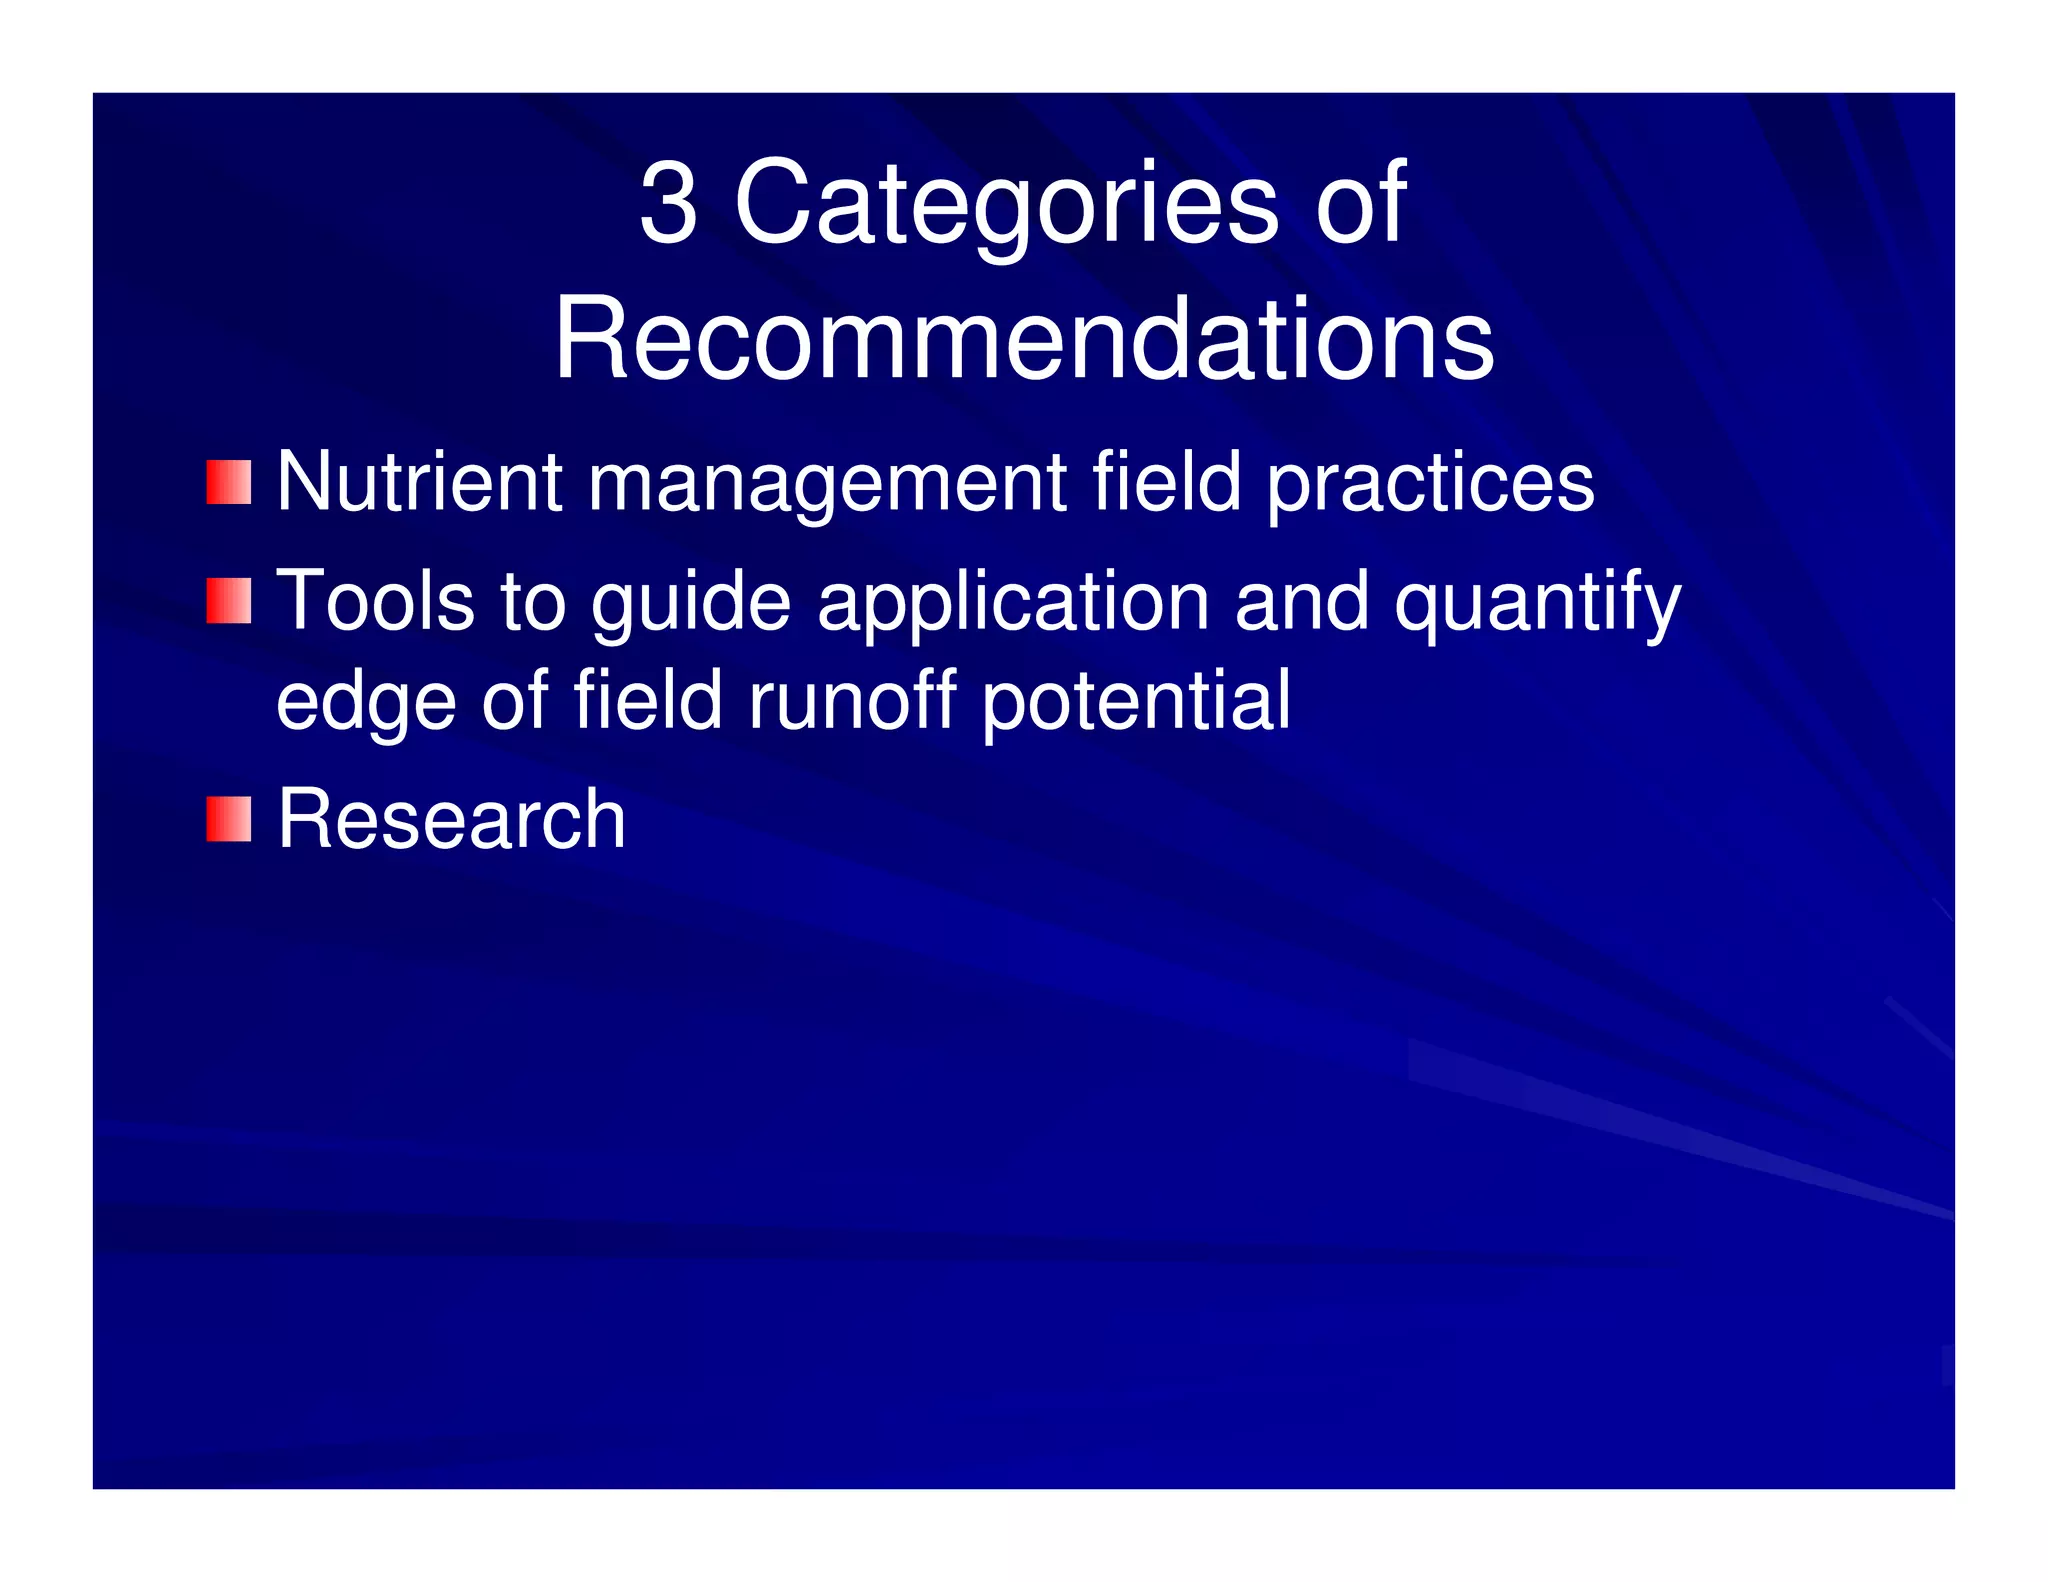
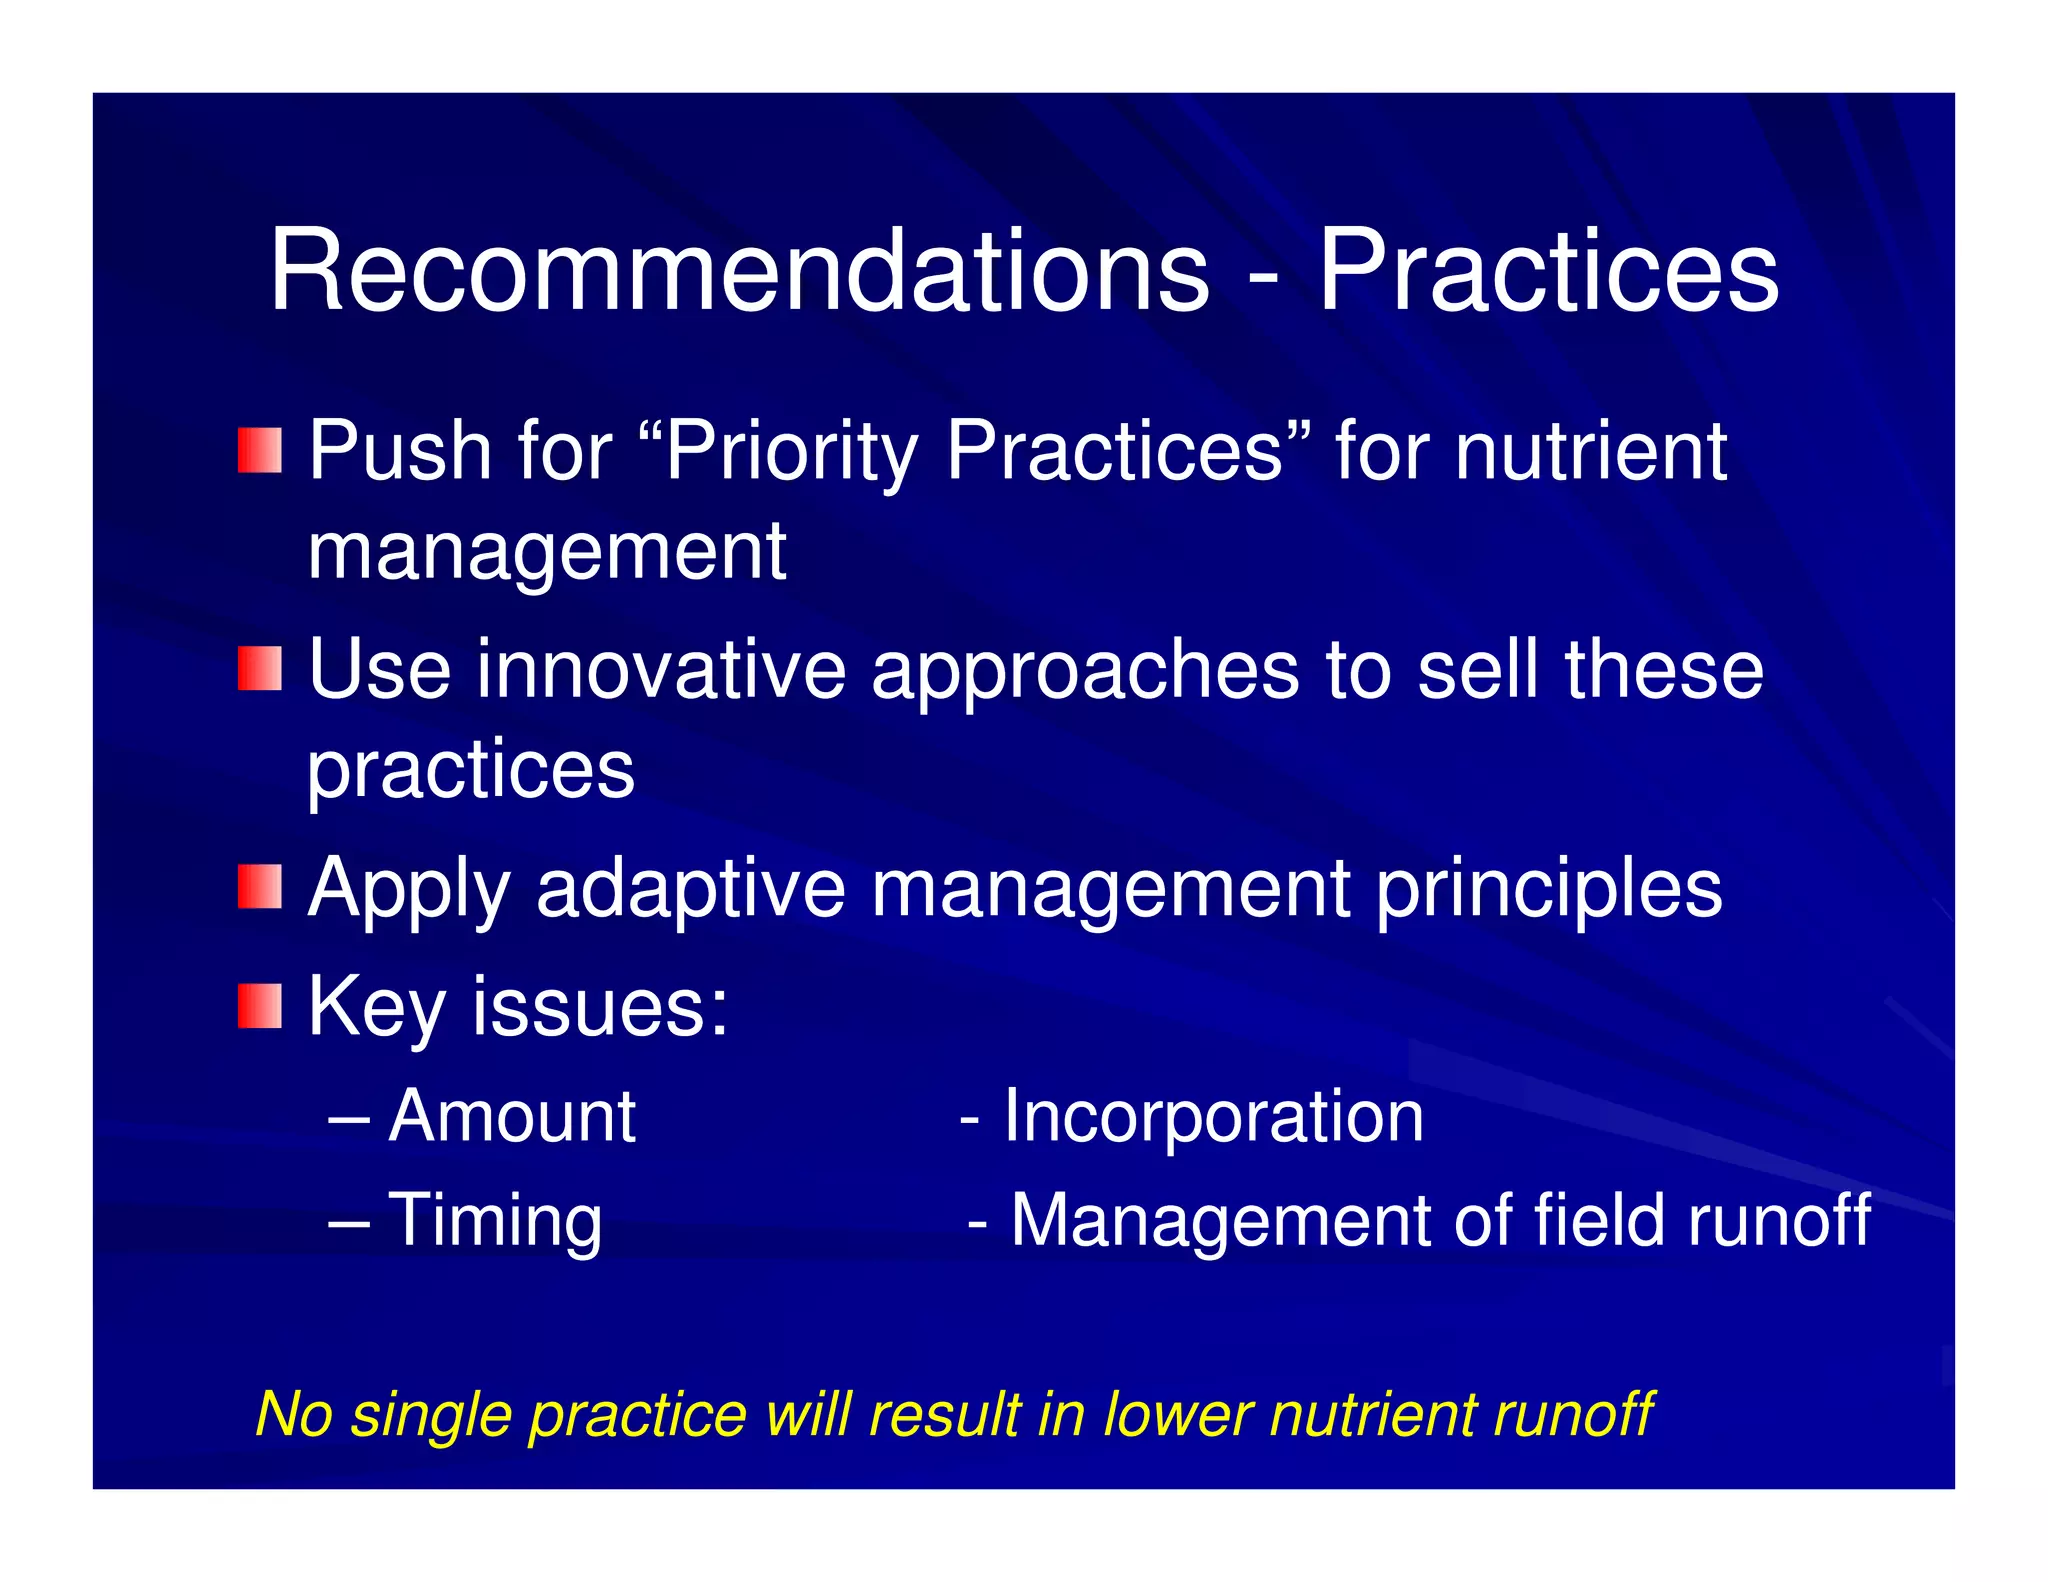
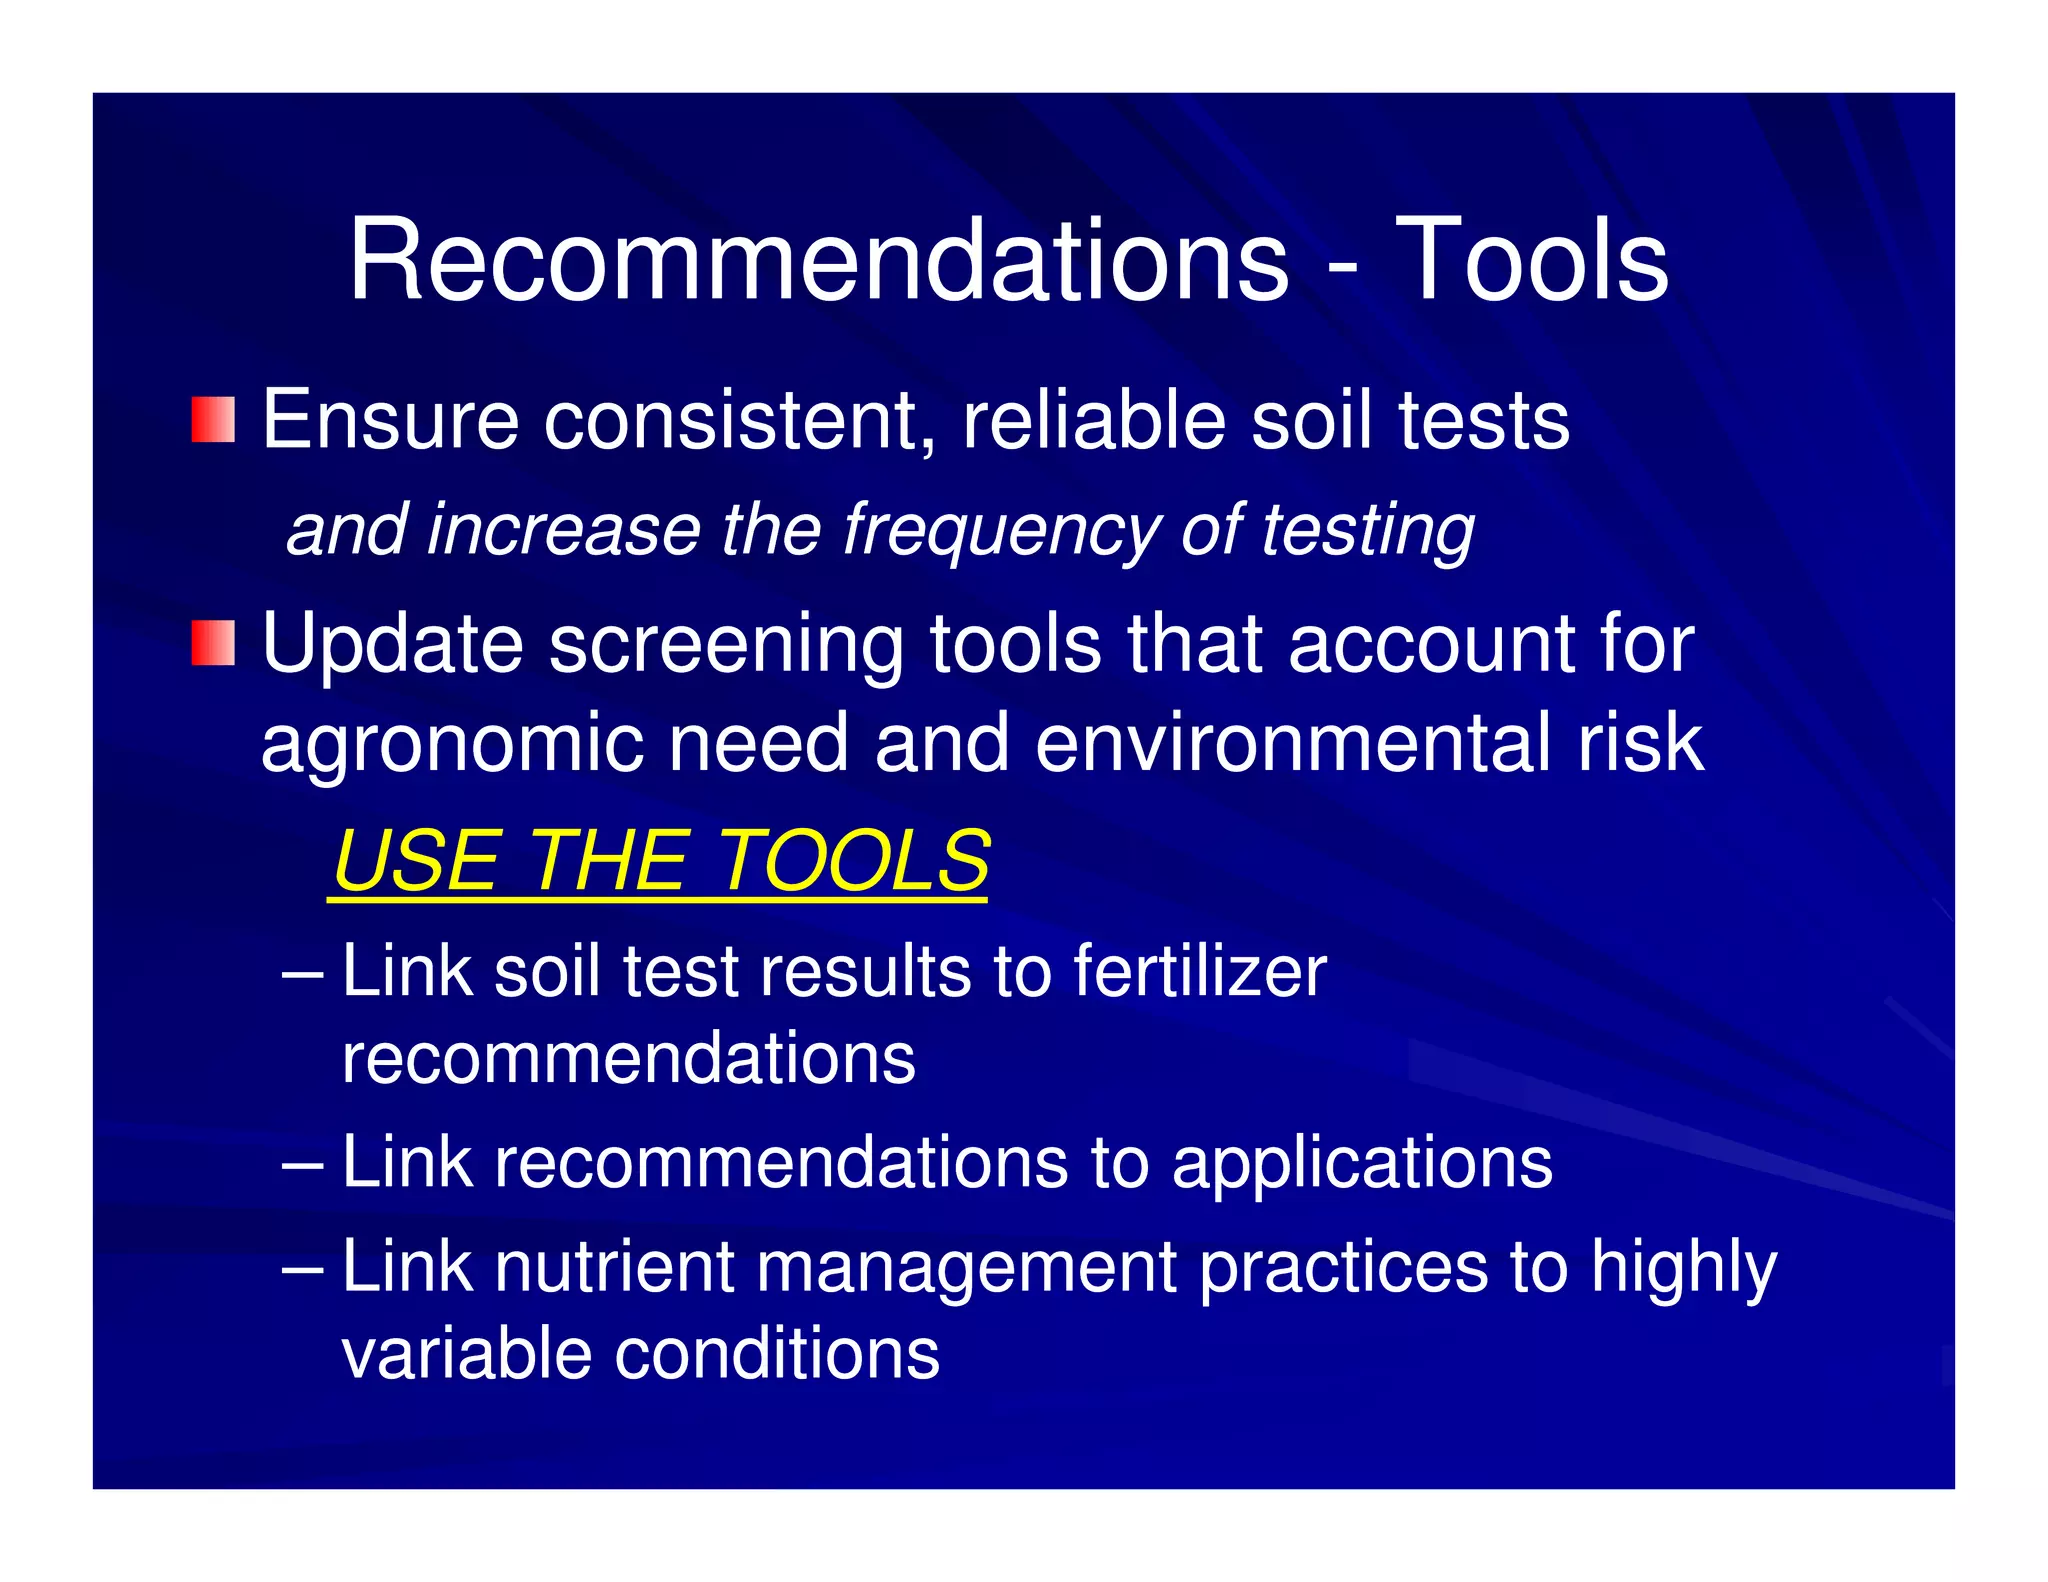
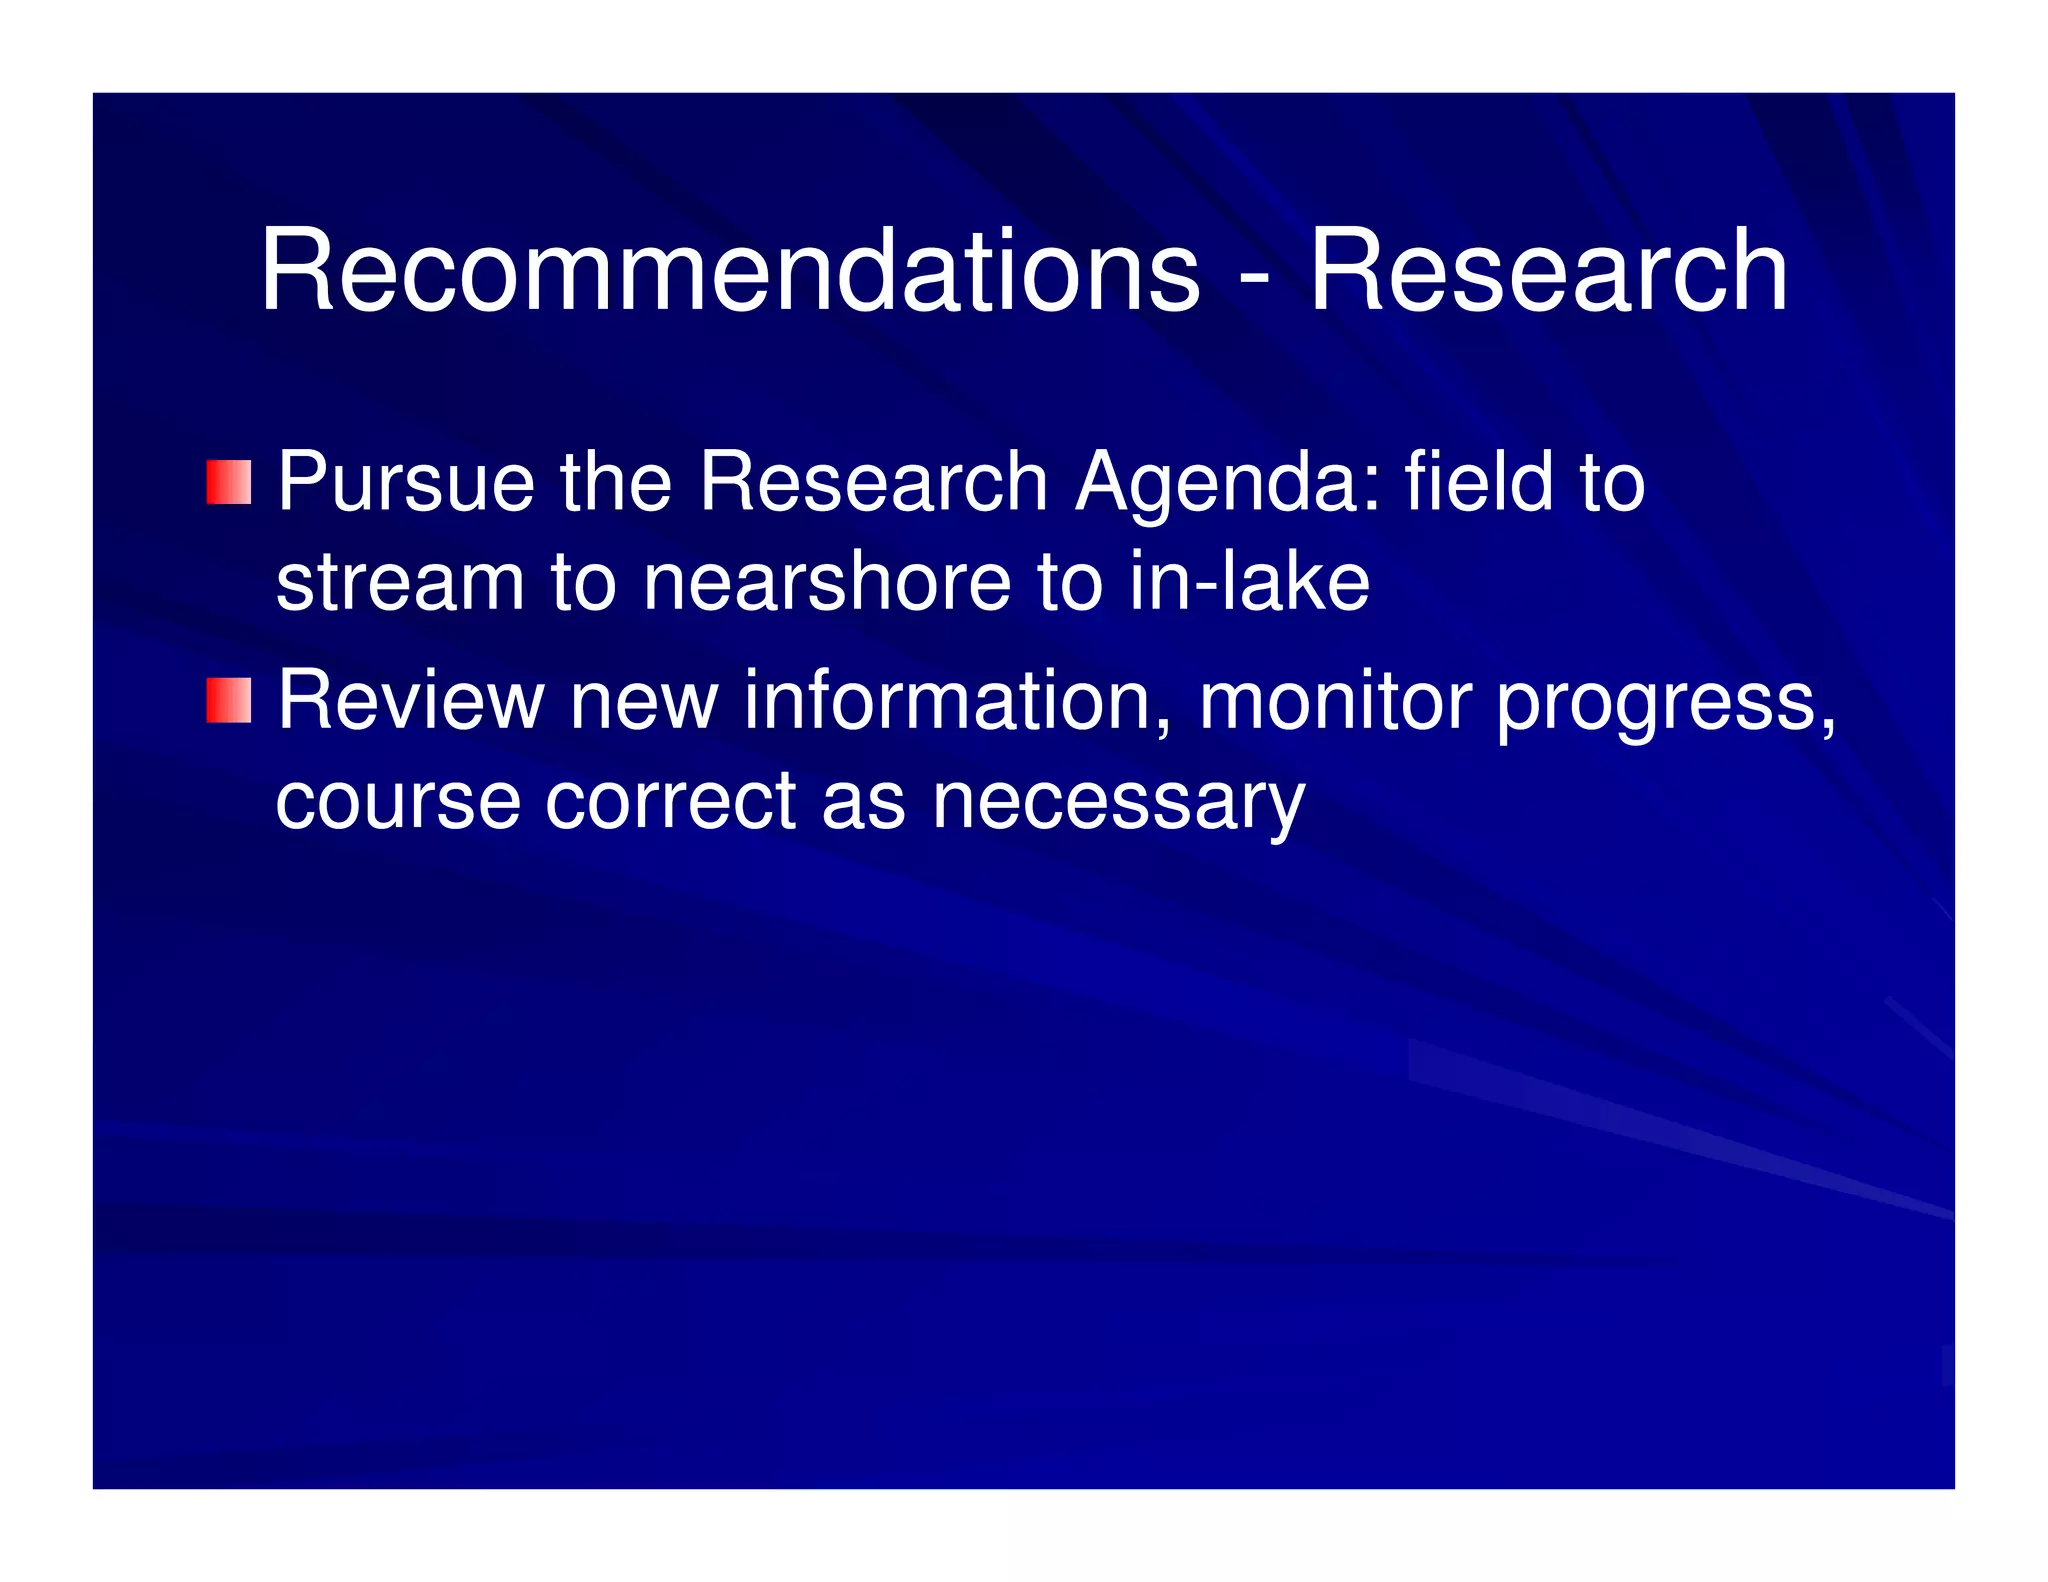
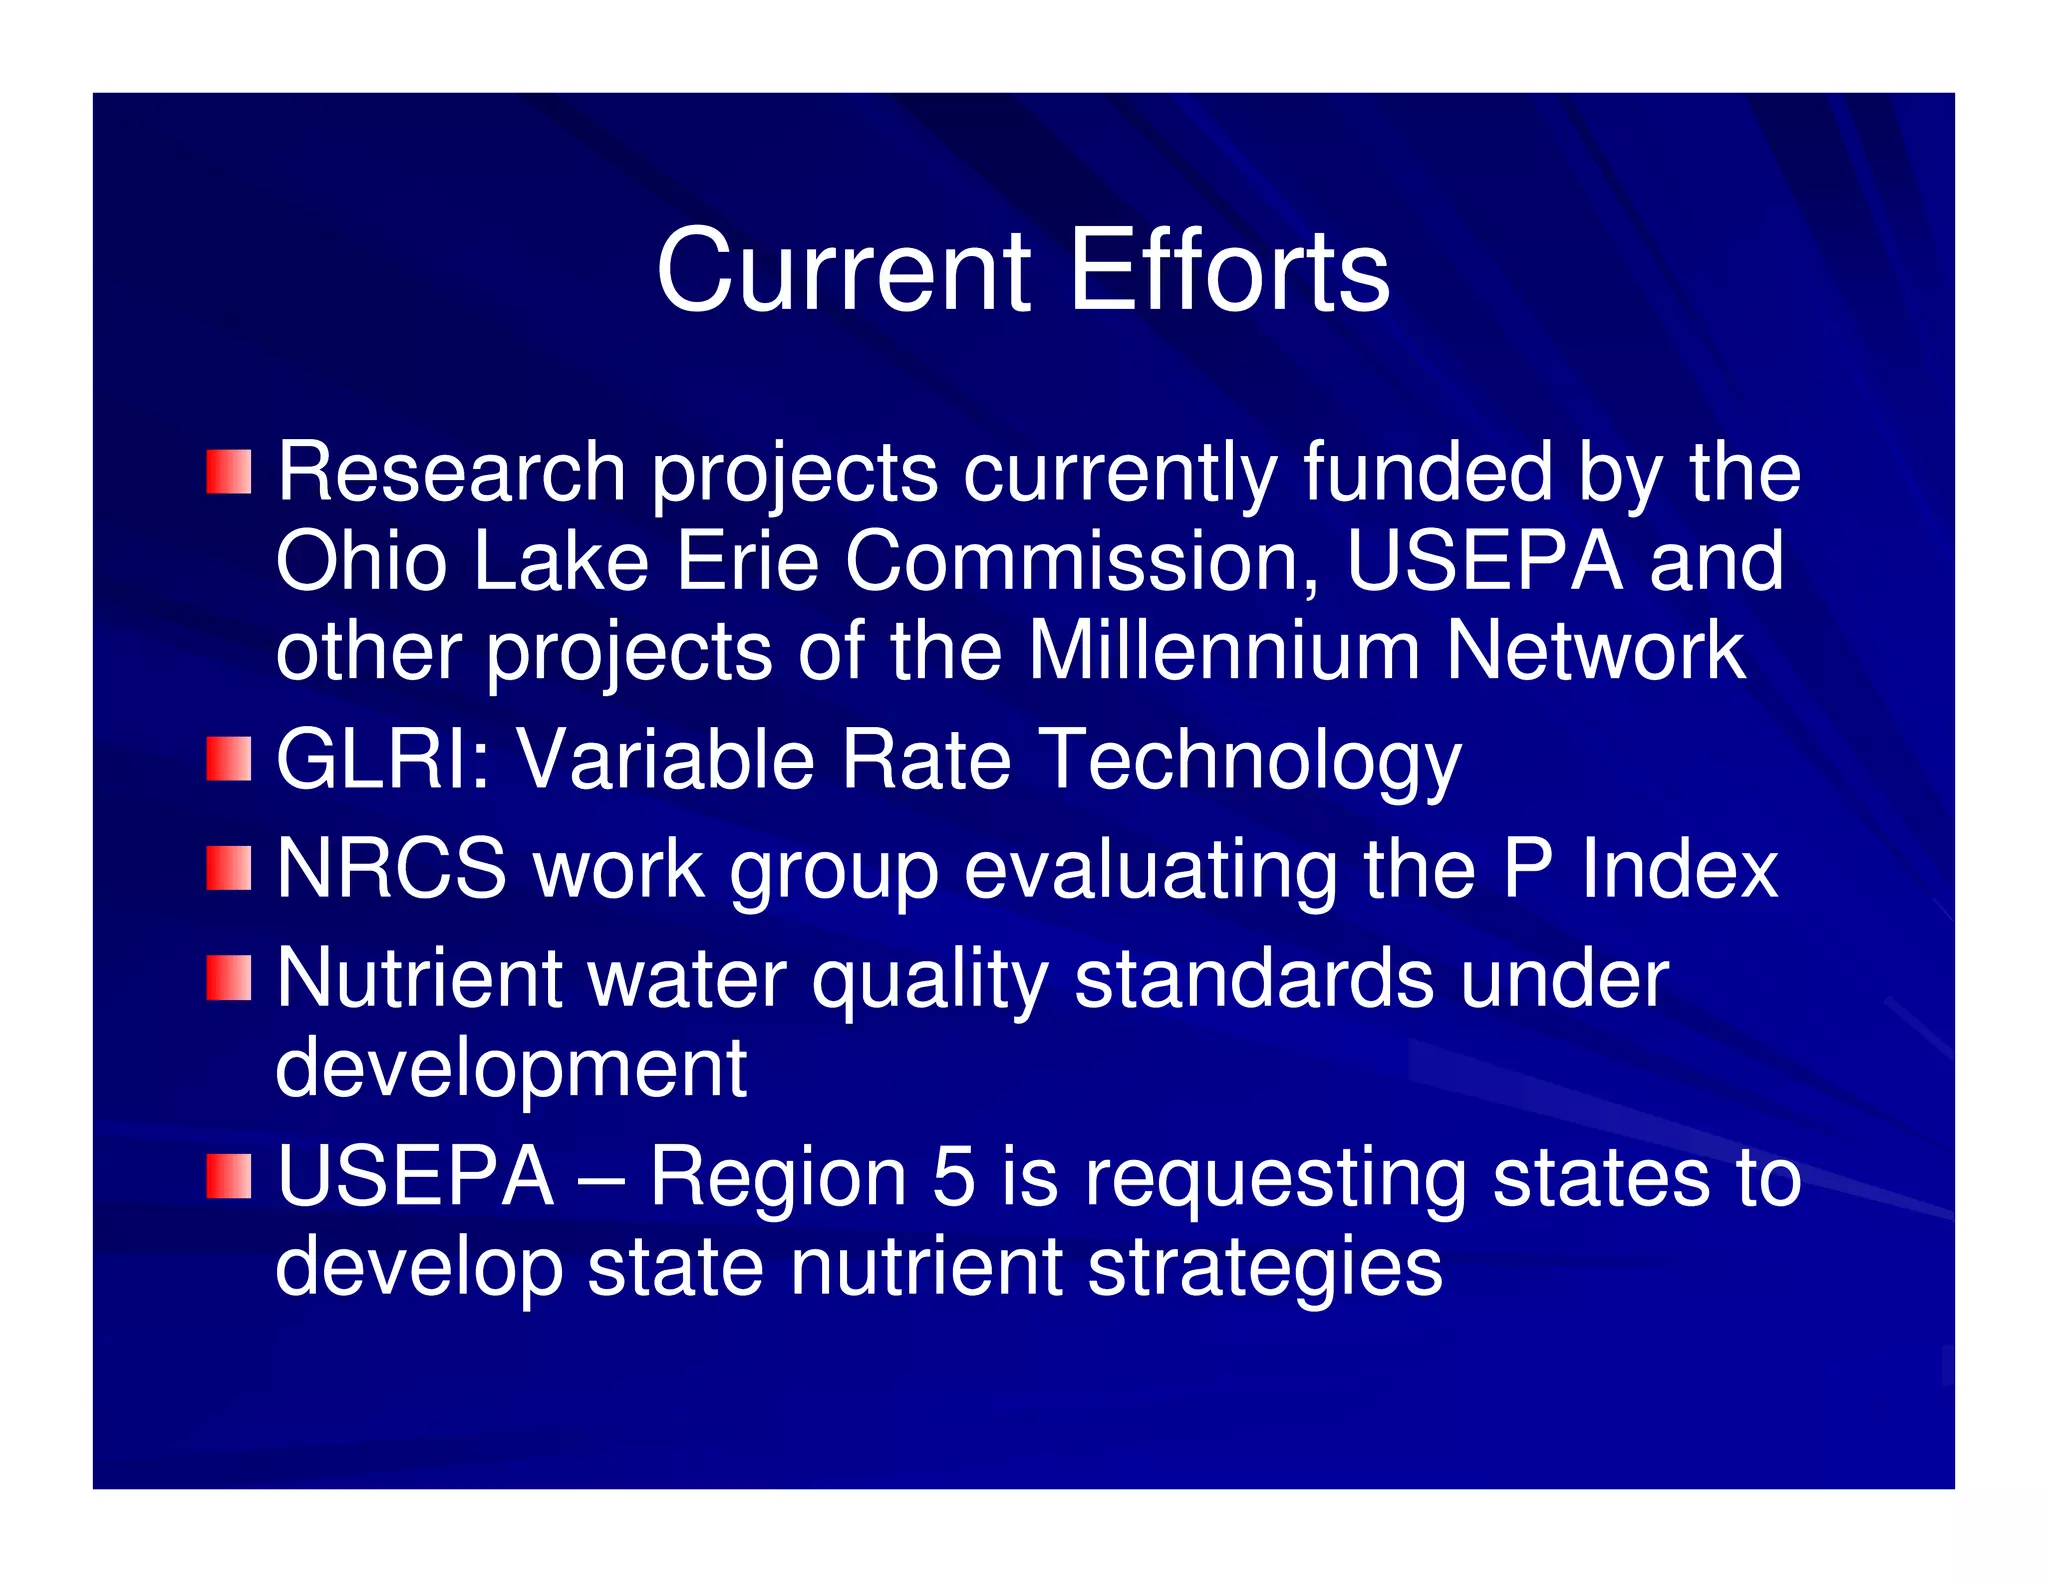
The Ohio Lake Erie Phosphorus
 Task Force: Moving Towards
       Implementation
       Gail Hesse, Ohio EPA
        September 10, 2010
Topics
Background
Findings
Recommendations
Current Efforts
Microcystis bloom
  August 2003


    Toledo Water Intake
P Task Force Approach
Identify all possible sources of DRP
Quantify what we can with existing data
sources
Consult with topical experts
Consult peer-reviewed publications
         peer-
Compare relative contributions from
possible sources
Develop recommendations
Findings
Point sources have remained relatively
consistent
Lawn care – can have localized impact
Mussels have altered P cycling
– Extent unknown
– Processing external sources
Transport mechanisms – surface and
subsurface drainage
– Relative contribution unknown
Sub-
Sub-Surface Drainage
Findings
Soil nutrient interactions are key to
understanding nutrient movement
Soil P naturally fluctuates between
dissolved and solid forms
Soil mineralogy influences solubility
Other factors, including nitrogen, may be
affecting algal blooms
Findings
DRP loadings are driven by runoff events
Weather trend changes: higher intensity
storms, less snowfall, high winter runoff
events
Multiple contributors; agriculture is key
Need to look at how we manage our P
inputs
Phosphorus Inputs
           Agriculture
Biosolids
Animal manure
Commercial fertilizer
                                                    Recent Fertilizer P Usage
                                                       in Lake Erie Basin
                                                       (tons elemental P)
                        11,235 tons
                        manure, 27%
                                                               LEB Commercial P
                     2,830 tons                                Fertilizer (2006 Values)
                                       27,320 tons             LEB Biosolids Fertilizer
                    biosolids, 7%
                                      fertilizer, 66%          (2007 Avg. Values)
                                                               LEB Manure Fertilizer
                                                               (2007 & 2008 Values)
Trends in Agriculture
Overall, nutrient inputs are down
– Biosolids, animal manure, commercial fertilizer
Larger farms, larger fields and larger equipment
 – Larger equipment has multiple functions,
   more year-round operations
         year-
 – Larger, heavier equipment may be leading to
   soil compaction
More year-round operations
     year-
Trends in Agriculture, cont.
More fall preparation of seed beds, more
fall and winter application
Changing methods: more broadcast
application without incorporation
Unknown and uncertain use of soil tests
and adherence with recommendations
Changes in soil quality
Changes in drainage
3 Categories of
       Recommendations
Nutrient management field practices
Tools to guide application and quantify
edge of field runoff potential
Research
Recommendations - Practices
  Push for “Priority Practices” for nutrient
  management
  Use innovative approaches to sell these
  practices
  Apply adaptive management principles
  Key issues:
   – Amount                - Incorporation
   – Timing                - Management of field runoff

No single practice will result in lower nutrient runoff
Recommendations - Tools
Ensure consistent, reliable soil tests
and increase the frequency of testing
Update screening tools that account for
agronomic need and environmental risk
 USE THE TOOLS
– Link soil test results to fertilizer
  recommendations
– Link recommendations to applications
– Link nutrient management practices to highly
  variable conditions
Recommendations - Research
Pursue the Research Agenda: field to
stream to nearshore to in-lake
                       in-
Review new information, monitor progress,
course correct as necessary
Current Efforts
Research projects currently funded by the
Ohio Lake Erie Commission, USEPA and
other projects of the Millennium Network
GLRI: Variable Rate Technology
NRCS work group evaluating the P Index
Nutrient water quality standards under
development
USEPA – Region 5 is requesting states to
develop state nutrient strategies
Factors for Consideration
Understand relative contributions for major
river basins
Focus on any reduction….or the major
contributors?
Focus on geographic areas….or the major
contributors?
Strategies need to fit the issues in any
given basin
www.epa.state.oh.us/dsw
Click: Phosphorus Task Force

www.epa.state.oh.us
Click: Grand Lake St. Marys
Algal Bloom Update

The Ohio Lake Erie Phosphorus Task Force

  • 1.
    The Ohio LakeErie Phosphorus Task Force: Moving Towards Implementation Gail Hesse, Ohio EPA September 10, 2010
  • 2.
  • 3.
    Microcystis bloom August 2003 Toledo Water Intake
  • 7.
    P Task ForceApproach Identify all possible sources of DRP Quantify what we can with existing data sources Consult with topical experts Consult peer-reviewed publications peer- Compare relative contributions from possible sources Develop recommendations
  • 8.
    Findings Point sources haveremained relatively consistent Lawn care – can have localized impact Mussels have altered P cycling – Extent unknown – Processing external sources Transport mechanisms – surface and subsurface drainage – Relative contribution unknown
  • 9.
  • 10.
    Findings Soil nutrient interactionsare key to understanding nutrient movement Soil P naturally fluctuates between dissolved and solid forms Soil mineralogy influences solubility Other factors, including nitrogen, may be affecting algal blooms
  • 11.
    Findings DRP loadings aredriven by runoff events Weather trend changes: higher intensity storms, less snowfall, high winter runoff events Multiple contributors; agriculture is key Need to look at how we manage our P inputs
  • 12.
    Phosphorus Inputs Agriculture Biosolids Animal manure Commercial fertilizer Recent Fertilizer P Usage in Lake Erie Basin (tons elemental P) 11,235 tons manure, 27% LEB Commercial P 2,830 tons Fertilizer (2006 Values) 27,320 tons LEB Biosolids Fertilizer biosolids, 7% fertilizer, 66% (2007 Avg. Values) LEB Manure Fertilizer (2007 & 2008 Values)
  • 13.
    Trends in Agriculture Overall,nutrient inputs are down – Biosolids, animal manure, commercial fertilizer Larger farms, larger fields and larger equipment – Larger equipment has multiple functions, more year-round operations year- – Larger, heavier equipment may be leading to soil compaction More year-round operations year-
  • 14.
    Trends in Agriculture,cont. More fall preparation of seed beds, more fall and winter application Changing methods: more broadcast application without incorporation Unknown and uncertain use of soil tests and adherence with recommendations Changes in soil quality Changes in drainage
  • 16.
    3 Categories of Recommendations Nutrient management field practices Tools to guide application and quantify edge of field runoff potential Research
  • 17.
    Recommendations - Practices Push for “Priority Practices” for nutrient management Use innovative approaches to sell these practices Apply adaptive management principles Key issues: – Amount - Incorporation – Timing - Management of field runoff No single practice will result in lower nutrient runoff
  • 18.
    Recommendations - Tools Ensureconsistent, reliable soil tests and increase the frequency of testing Update screening tools that account for agronomic need and environmental risk USE THE TOOLS – Link soil test results to fertilizer recommendations – Link recommendations to applications – Link nutrient management practices to highly variable conditions
  • 19.
    Recommendations - Research Pursuethe Research Agenda: field to stream to nearshore to in-lake in- Review new information, monitor progress, course correct as necessary
  • 20.
    Current Efforts Research projectscurrently funded by the Ohio Lake Erie Commission, USEPA and other projects of the Millennium Network GLRI: Variable Rate Technology NRCS work group evaluating the P Index Nutrient water quality standards under development USEPA – Region 5 is requesting states to develop state nutrient strategies
  • 25.
    Factors for Consideration Understandrelative contributions for major river basins Focus on any reduction….or the major contributors? Focus on geographic areas….or the major contributors? Strategies need to fit the issues in any given basin
  • 26.
    www.epa.state.oh.us/dsw Click: Phosphorus TaskForce www.epa.state.oh.us Click: Grand Lake St. Marys Algal Bloom Update