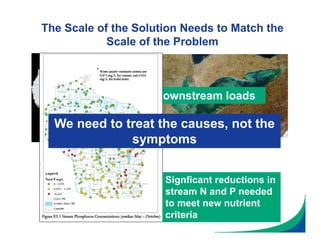
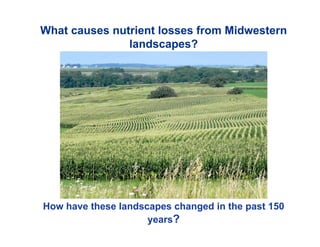
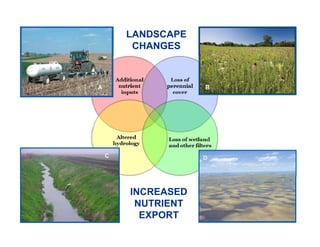
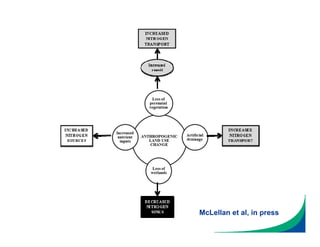
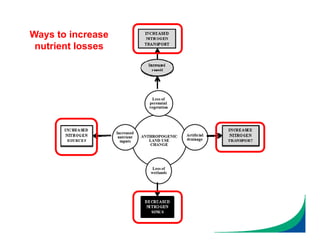
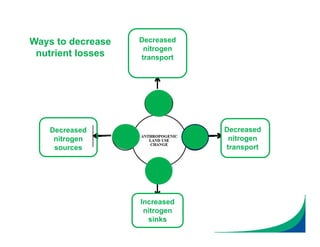
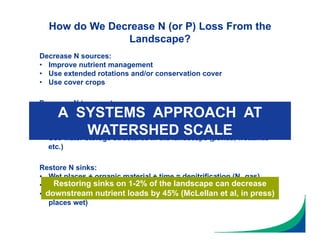
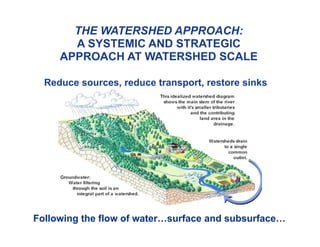
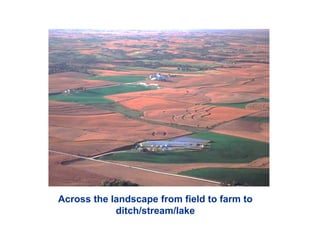
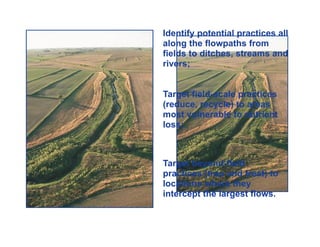
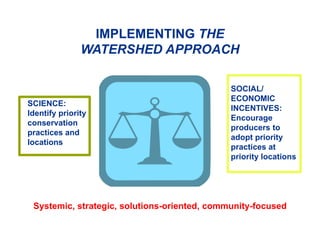
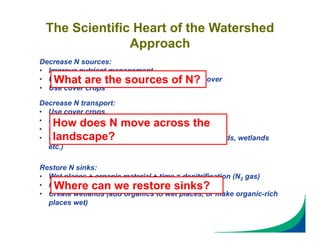
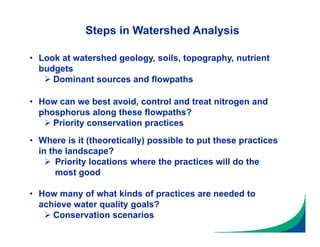
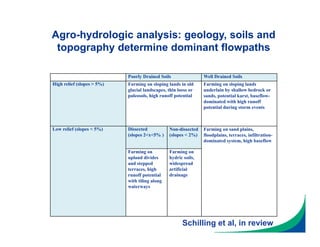
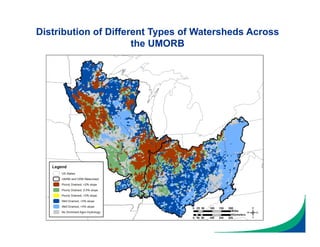
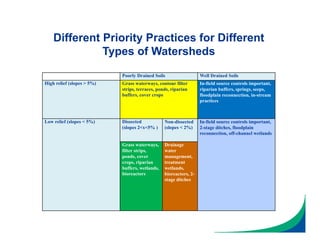
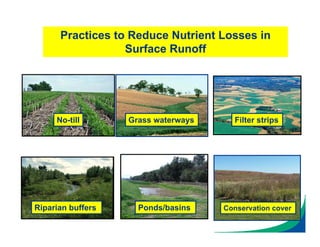
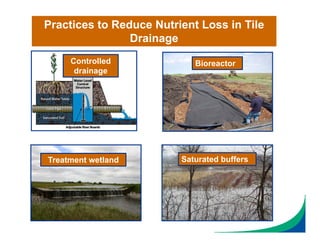
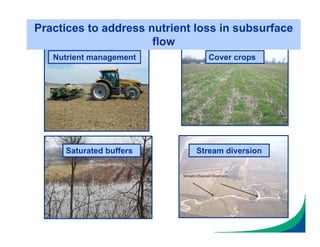
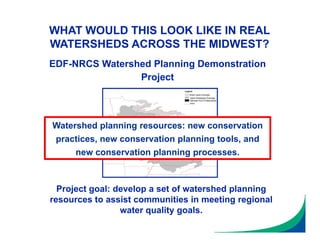
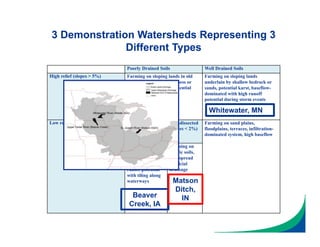
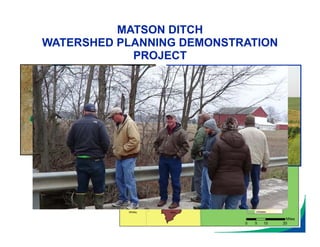
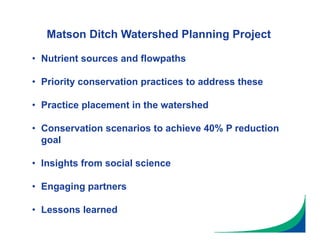
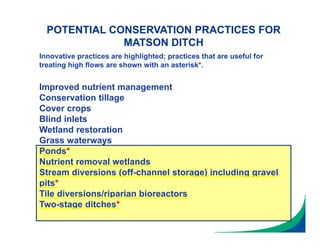
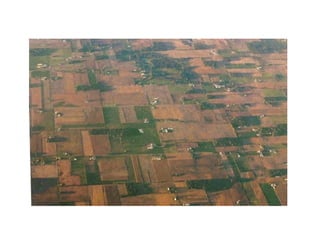
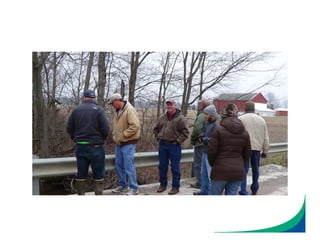
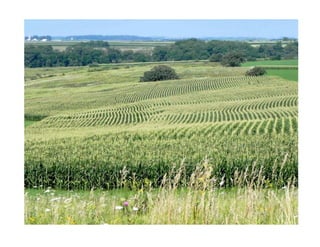
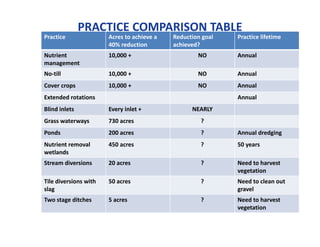
AN INNOVATIVE APPROACH TO
REDUCING NUTRIENT LOSSES FROM
AGRICULTURAL LANDSCAPES
THE WATERSHED APPROACH
The need for a new approach to agricultural
conservation
What is the watershed approach?
How do we implement the watershed
approach on the ground?
Case study: Matson Ditch, St. Joseph
River, IN
Lessons learned and transferability
SYMPOSIUM OUTLINE
Why Do We Need a New Approach to
Conservation?
• Growing awareness of problems associated with nitrogen
losses from agricultural landscapes.
• Reducing nitrogen losses requires a different approach to
agricultural conservation.
• Nitrogen moves primarily with subsurface flows
• Nitrogen-related water quality problems are invisible on
the farm but affect downstream communities at a regional
scale
• Past conservation efforts have been very successful in
reducing soil erosion (and phosphorus losses).
• But much more needs to be done to reduce phosphorus
losses from agricultural landscapes.
The Scale of the Solution Needs to Match the
Scale of the Problem
45% reduction in downstream loads
Signficant reductions in
stream N and P needed
to meet new nutrient
criteria
We need to treat the causes, not the
symptoms
How have these landscapes changed in the past 150
years?
What causes nutrient losses from Midwestern
landscapes?
LANDSCAPE
CHANGES
INCREASED
NUTRIENT
EXPORT
McLellan et al, in press
Ways to increase
nutrient losses
Decreased
nitrogen
transport
Decreased
nitrogen
transport
Decreased
nitrogen
sources
Increased
nitrogen
sinks
Ways to decrease
nutrient losses
Decrease N sources:
• Improve nutrient management
• Use extended rotations and/or conservation cover
• Use cover crops
Decrease N transport:
• Use cover crops
• Use conservation tillage (soil water storage)
• Use controlled drainage
• Use water storage structures in the landscape (ponds, wetlands
etc.)
Restore N sinks:
• Wet places + organic material + time = denitrification (N2 gas)
• Restore wetlands
• Create wetlands (add organics to wet places, or make organic-rich
places wet)
How do We Decrease N (or P) Loss From the
Landscape?
A SYSTEMS APPROACH AT
WATERSHED SCALE
Restoring sinks on 1-2% of the landscape can decrease
downstream nutrient loads by 45% (McLellan et al, in press)
THE WATERSHED APPROACH:
A SYSTEMIC AND STRATEGIC
APPROACH AT WATERSHED SCALE
Following the flow of water…surface and subsurface…
Reduce sources, reduce transport, restore sinks
Across the landscape from field to farm to
ditch/stream/lake
Use practices to reduce
and recycle nutrient
inputs within fields
Use practices within
and at the edge of
fields to capture flows
and prevent nutrient
losses
Use practices in riparian
areas, ditches and
streams to intercept and
treat nutrients lost from
fields
Identify potential practices all
along the flowpaths from
fields to ditches, streams and
rivers;
Target field-scale practices
(reduce, recycle) to areas
most vulnerable to nutrient
loss;
Target beyond-field
practices (trap and treat) to
locations where they
intercept the largest flows.
IMPLEMENTING THE
WATERSHED APPROACH
SCIENCE:
Identify priority
conservation
practices and
locations
SOCIAL/
ECONOMIC
INCENTIVES:
Encourage
producers to
adopt priority
practices at
priority locations
Systemic, strategic, solutions-oriented, community-focused
Decrease N sources:
• Improve nutrient management
• Use extended rotations and/or conservation cover
• Use cover crops
Decrease N transport:
• Use cover crops
• Use erosion control practices
• Use conservation tillage (soil water storage)
• Use water storage structures in the landscape (ponds, wetlands
etc.)
Restore N sinks:
• Wet places + organic material + time = denitrification (N2 gas)
• Restore wetlands
• Create wetlands (add organics to wet places, or make organic-rich
places wet)
The Scientific Heart of the Watershed
Approach
What are the sources of N?
How does N move across the
landscape?
Where can we restore sinks?
Steps in Watershed Analysis
• Look at watershed geology, soils, topography, nutrient
budgets
 Dominant sources and flowpaths
• How can we best avoid, control and treat nitrogen and
phosphorus along these flowpaths?
 Priority conservation practices
• Where is it (theoretically) possible to put these practices
in the landscape?
 Priority locations where the practices will do the
most good
• How many of what kinds of practices are needed to
achieve water quality goals?
 Conservation scenarios
Poorly Drained Soils Well Drained Soils
High relief (slopes > 5%) Farming on sloping lands in old
glacial landscapes, thin loess or
paleosols, high runoff potential
Farming on sloping lands
underlain by shallow bedrock or
sands, potential karst, baseflow-
dominated with high runoff
potential during storm events
Low relief (slopes < 5%) Dissected
(slopes 2<x<5% )
Non-dissected
(slopes < 2%)
Farming on sand plains,
floodplains, terraces, infiltration-
dominated system, high baseflow
Farming on
upland divides
and stepped
terraces, high
runoff potential
with tiling along
waterways
Farming on
hydric soils,
widespread
artificial
drainage
Agro-hydrologic analysis: geology, soils and
topography determine dominant flowpaths
Schilling et al, in review
Distribution of Different Types of Watersheds Across
the UMORB
Poorly Drained Soils Well Drained Soils
High relief (slopes > 5%) Grass waterways, contour filter
strips, terraces, ponds, riparian
buffers, cover crops
In-field source controls important,
riparian buffers, springs, seeps,
floodplain reconnection, in-stream
practices
Low relief (slopes < 5%) Dissected
(slopes 2<x<5% )
Non-dissected
(slopes < 2%)
In-field source controls important,
2-stage ditches, floodplain
reconnection, off-channel wetlands
Grass waterways,
filter strips,
ponds, cover
crops, riparian
buffers, wetlands,
bioreactors
Drainage
water
management,
treatment
wetlands,
bioreactors, 2-
stage ditches
Different Priority Practices for Different
Types of Watersheds
Practices to Reduce Nutrient Losses in
Surface Runoff
No-till Grass waterways Filter strips
Riparian buffers Ponds/basins Conservation cover
Controlled
drainage
Bioreactor
Treatment wetland Saturated buffers
Practices to Reduce Nutrient Loss in Tile
Drainage
Saturated buffers Stream diversion
Cover cropsNutrient management
Practices to address nutrient loss in subsurface
flow
WHAT WOULD THIS LOOK LIKE IN REAL
WATERSHEDS ACROSS THE MIDWEST?
Project goal: develop a set of watershed planning
resources to assist communities in meeting regional
water quality goals.
EDF-NRCS Watershed Planning Demonstration
Project
Watershed planning resources: new conservation
practices, new conservation planning tools, and
new conservation planning processes.
EDF PowerPoint Template
Title Slide
Project Collaborators
Toby Dogwiler, Winona State University
Adam Kiel and Keegan Kult, Iowa Soybean Association
Joe Magner, University of Minnesota
Linda Prokopy and Nick Babin, Purdue University
Keith Schilling and Calvin Wolter, IA-DNR
Doug Smith, USDA-ARS-NSERL
Mark Tomer and Sarah Porter, USDA-ARS-NLAE
The staffs of Dekalb SWCD (IN) and Winona SWCD (MN) and of NRCS
Field Offices in Dekalb County, IN, Floyd/Chickasaw Counties (IA) and
Olmsted/Winona Counties (MN).
Numerous producers in Beaver Creek (IA), Matson Ditch (IN) and Middle
Fork Whitewater (MN)
Funding Support
EDF gratefully acknowledges support provided through a Contribution
Agreement from NRCS, and grants from the Joyce Foundation and the
Walton Family Foundation.
Poorly Drained Soils Well Drained Soils
High relief (slopes > 5%) Farming on sloping lands in old
glacial landscapes, thin loess or
paleosols, high runoff potential
Farming on sloping lands
underlain by shallow bedrock or
sands, potential karst, baseflow-
dominated with high runoff
potential during storm events
Low relief (slopes < 5%) Dissected
(slopes 2<x<5% )
Non-dissected
(slopes < 2%)
Farming on sand plains,
floodplains, terraces, infiltration-
dominated system, high baseflow
Farming on
upland divides
and stepped
terraces, high
runoff potential
with tiling along
waterways
Farming on
hydric soils,
widespread
artificial
drainage
3 Demonstration Watersheds Representing 3
Different Types
Whitewater, MN
Beaver
Creek, IA
Matson
Ditch,
IN
MATSON DITCH
WATERSHED PLANNING DEMONSTRATION
PROJECT
Matson Ditch Watershed Planning Project
• Nutrient sources and flowpaths
• Priority conservation practices to address these
• Practice placement in the watershed
• Conservation scenarios to achieve 40% P reduction
goal
• Insights from social science
• Engaging partners
• Lessons learned
QUESTIONS?
POTENTIAL CONSERVATION PRACTICES FOR
MATSON DITCH
Innovative practices are highlighted; practices that are useful for
treating high flows are shown with an asterisk*.
Improved nutrient management
Conservation tillage
Cover crops
Blind inlets
Wetland restoration
Grass waterways
Ponds*
Nutrient removal wetlands
Stream diversions (off-channel storage) including gravel
pits*
Tile diversions/riparian bioreactors
Two-stage ditches*
PRACTICE COMPARISON TABLE
Practice Acres to achieve a 
40% reduction
Reduction goal 
achieved?
Practice lifetime 
Nutrient
management
10,000 + NO Annual
No‐till 10,000 + NO Annual
Cover crops 10,000 + NO Annual
Extended rotations Annual
Blind inlets Every inlet +  NEARLY
Grass waterways 730 acres ?
Ponds 200 acres ? Annual dredging
Nutrient removal 
wetlands
450 acres ? 50 years
Stream diversions 20 acres ? Need to harvest
vegetation
Tile diversions with 
slag
50 acres ? Need to clean out 
gravel
Two stage ditches 5 acres ? Need to harvest 
vegetation

McLellan - The Watershed Approach

  • 1.
    AN INNOVATIVE APPROACHTO REDUCING NUTRIENT LOSSES FROM AGRICULTURAL LANDSCAPES THE WATERSHED APPROACH
  • 2.
    The need fora new approach to agricultural conservation What is the watershed approach? How do we implement the watershed approach on the ground? Case study: Matson Ditch, St. Joseph River, IN Lessons learned and transferability SYMPOSIUM OUTLINE
  • 3.
    Why Do WeNeed a New Approach to Conservation? • Growing awareness of problems associated with nitrogen losses from agricultural landscapes. • Reducing nitrogen losses requires a different approach to agricultural conservation. • Nitrogen moves primarily with subsurface flows • Nitrogen-related water quality problems are invisible on the farm but affect downstream communities at a regional scale • Past conservation efforts have been very successful in reducing soil erosion (and phosphorus losses). • But much more needs to be done to reduce phosphorus losses from agricultural landscapes.
  • 4.
    The Scale ofthe Solution Needs to Match the Scale of the Problem 45% reduction in downstream loads Signficant reductions in stream N and P needed to meet new nutrient criteria We need to treat the causes, not the symptoms
  • 5.
    How have theselandscapes changed in the past 150 years? What causes nutrient losses from Midwestern landscapes?
  • 6.
  • 7.
  • 8.
  • 9.
  • 10.
    Decrease N sources: •Improve nutrient management • Use extended rotations and/or conservation cover • Use cover crops Decrease N transport: • Use cover crops • Use conservation tillage (soil water storage) • Use controlled drainage • Use water storage structures in the landscape (ponds, wetlands etc.) Restore N sinks: • Wet places + organic material + time = denitrification (N2 gas) • Restore wetlands • Create wetlands (add organics to wet places, or make organic-rich places wet) How do We Decrease N (or P) Loss From the Landscape? A SYSTEMS APPROACH AT WATERSHED SCALE Restoring sinks on 1-2% of the landscape can decrease downstream nutrient loads by 45% (McLellan et al, in press)
  • 11.
    THE WATERSHED APPROACH: ASYSTEMIC AND STRATEGIC APPROACH AT WATERSHED SCALE Following the flow of water…surface and subsurface… Reduce sources, reduce transport, restore sinks
  • 12.
    Across the landscapefrom field to farm to ditch/stream/lake
  • 13.
    Use practices toreduce and recycle nutrient inputs within fields Use practices within and at the edge of fields to capture flows and prevent nutrient losses Use practices in riparian areas, ditches and streams to intercept and treat nutrients lost from fields Identify potential practices all along the flowpaths from fields to ditches, streams and rivers; Target field-scale practices (reduce, recycle) to areas most vulnerable to nutrient loss; Target beyond-field practices (trap and treat) to locations where they intercept the largest flows.
  • 14.
    IMPLEMENTING THE WATERSHED APPROACH SCIENCE: Identifypriority conservation practices and locations SOCIAL/ ECONOMIC INCENTIVES: Encourage producers to adopt priority practices at priority locations Systemic, strategic, solutions-oriented, community-focused
  • 15.
    Decrease N sources: •Improve nutrient management • Use extended rotations and/or conservation cover • Use cover crops Decrease N transport: • Use cover crops • Use erosion control practices • Use conservation tillage (soil water storage) • Use water storage structures in the landscape (ponds, wetlands etc.) Restore N sinks: • Wet places + organic material + time = denitrification (N2 gas) • Restore wetlands • Create wetlands (add organics to wet places, or make organic-rich places wet) The Scientific Heart of the Watershed Approach What are the sources of N? How does N move across the landscape? Where can we restore sinks?
  • 16.
    Steps in WatershedAnalysis • Look at watershed geology, soils, topography, nutrient budgets  Dominant sources and flowpaths • How can we best avoid, control and treat nitrogen and phosphorus along these flowpaths?  Priority conservation practices • Where is it (theoretically) possible to put these practices in the landscape?  Priority locations where the practices will do the most good • How many of what kinds of practices are needed to achieve water quality goals?  Conservation scenarios
  • 17.
    Poorly Drained SoilsWell Drained Soils High relief (slopes > 5%) Farming on sloping lands in old glacial landscapes, thin loess or paleosols, high runoff potential Farming on sloping lands underlain by shallow bedrock or sands, potential karst, baseflow- dominated with high runoff potential during storm events Low relief (slopes < 5%) Dissected (slopes 2<x<5% ) Non-dissected (slopes < 2%) Farming on sand plains, floodplains, terraces, infiltration- dominated system, high baseflow Farming on upland divides and stepped terraces, high runoff potential with tiling along waterways Farming on hydric soils, widespread artificial drainage Agro-hydrologic analysis: geology, soils and topography determine dominant flowpaths Schilling et al, in review
  • 18.
    Distribution of DifferentTypes of Watersheds Across the UMORB
  • 19.
    Poorly Drained SoilsWell Drained Soils High relief (slopes > 5%) Grass waterways, contour filter strips, terraces, ponds, riparian buffers, cover crops In-field source controls important, riparian buffers, springs, seeps, floodplain reconnection, in-stream practices Low relief (slopes < 5%) Dissected (slopes 2<x<5% ) Non-dissected (slopes < 2%) In-field source controls important, 2-stage ditches, floodplain reconnection, off-channel wetlands Grass waterways, filter strips, ponds, cover crops, riparian buffers, wetlands, bioreactors Drainage water management, treatment wetlands, bioreactors, 2- stage ditches Different Priority Practices for Different Types of Watersheds
  • 20.
    Practices to ReduceNutrient Losses in Surface Runoff No-till Grass waterways Filter strips Riparian buffers Ponds/basins Conservation cover
  • 21.
    Controlled drainage Bioreactor Treatment wetland Saturatedbuffers Practices to Reduce Nutrient Loss in Tile Drainage
  • 22.
    Saturated buffers Streamdiversion Cover cropsNutrient management Practices to address nutrient loss in subsurface flow
  • 23.
    WHAT WOULD THISLOOK LIKE IN REAL WATERSHEDS ACROSS THE MIDWEST? Project goal: develop a set of watershed planning resources to assist communities in meeting regional water quality goals. EDF-NRCS Watershed Planning Demonstration Project Watershed planning resources: new conservation practices, new conservation planning tools, and new conservation planning processes.
  • 24.
    EDF PowerPoint Template TitleSlide Project Collaborators Toby Dogwiler, Winona State University Adam Kiel and Keegan Kult, Iowa Soybean Association Joe Magner, University of Minnesota Linda Prokopy and Nick Babin, Purdue University Keith Schilling and Calvin Wolter, IA-DNR Doug Smith, USDA-ARS-NSERL Mark Tomer and Sarah Porter, USDA-ARS-NLAE The staffs of Dekalb SWCD (IN) and Winona SWCD (MN) and of NRCS Field Offices in Dekalb County, IN, Floyd/Chickasaw Counties (IA) and Olmsted/Winona Counties (MN). Numerous producers in Beaver Creek (IA), Matson Ditch (IN) and Middle Fork Whitewater (MN) Funding Support EDF gratefully acknowledges support provided through a Contribution Agreement from NRCS, and grants from the Joyce Foundation and the Walton Family Foundation.
  • 25.
    Poorly Drained SoilsWell Drained Soils High relief (slopes > 5%) Farming on sloping lands in old glacial landscapes, thin loess or paleosols, high runoff potential Farming on sloping lands underlain by shallow bedrock or sands, potential karst, baseflow- dominated with high runoff potential during storm events Low relief (slopes < 5%) Dissected (slopes 2<x<5% ) Non-dissected (slopes < 2%) Farming on sand plains, floodplains, terraces, infiltration- dominated system, high baseflow Farming on upland divides and stepped terraces, high runoff potential with tiling along waterways Farming on hydric soils, widespread artificial drainage 3 Demonstration Watersheds Representing 3 Different Types Whitewater, MN Beaver Creek, IA Matson Ditch, IN
  • 26.
    MATSON DITCH WATERSHED PLANNINGDEMONSTRATION PROJECT
  • 27.
    Matson Ditch WatershedPlanning Project • Nutrient sources and flowpaths • Priority conservation practices to address these • Practice placement in the watershed • Conservation scenarios to achieve 40% P reduction goal • Insights from social science • Engaging partners • Lessons learned
  • 28.
  • 29.
    POTENTIAL CONSERVATION PRACTICESFOR MATSON DITCH Innovative practices are highlighted; practices that are useful for treating high flows are shown with an asterisk*. Improved nutrient management Conservation tillage Cover crops Blind inlets Wetland restoration Grass waterways Ponds* Nutrient removal wetlands Stream diversions (off-channel storage) including gravel pits* Tile diversions/riparian bioreactors Two-stage ditches*
  • 33.
    PRACTICE COMPARISON TABLE Practice Acres to achieve a  40% reduction Reduction goal  achieved? Practice lifetime  Nutrient management 10,000 + NOAnnual No‐till 10,000 + NO Annual Cover crops 10,000 + NO Annual Extended rotations Annual Blind inlets Every inlet +  NEARLY Grass waterways 730 acres ? Ponds 200 acres ? Annual dredging Nutrient removal  wetlands 450 acres ? 50 years Stream diversions 20 acres ? Need to harvest vegetation Tile diversions with  slag 50 acres ? Need to clean out  gravel Two stage ditches 5 acres ? Need to harvest  vegetation