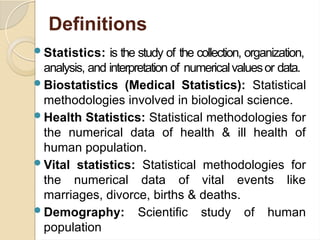
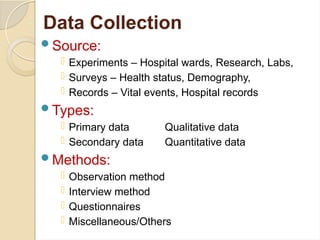
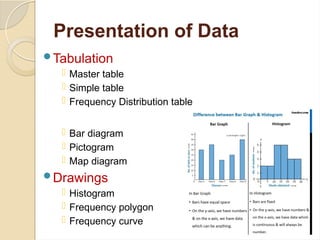
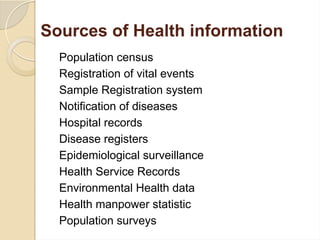
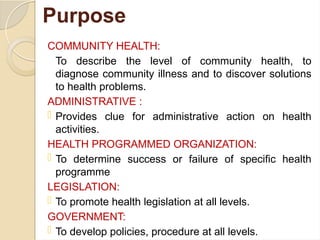
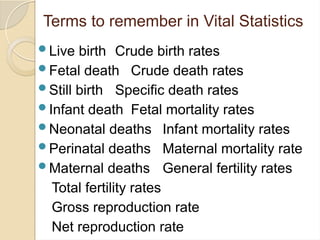
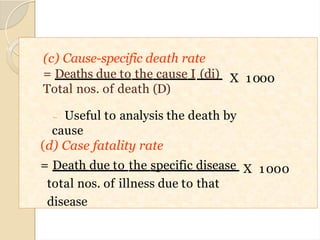
HEALTH
STATISTICS
Dr. PRABHU. C. NAGALAPUR M.D (AYU)
ASSOCIATE PROFESSOR
DEPT OF SWASTHAVRITTA & YOGA
S.J.G. AYURVEDIC MEDICAL COLLEGE & HOSPITAL, KOPPAL
MOBILE: 9886677088
EMAIL:drprabhu.ayu24@gmail.com
Importance
Integral part of national health
system
Collection, Processing, analysis &
transmission of information
required for organizing and
operating health services, for
research & training.
Definitions
Statistics: is the study of the collection, organization,
analysis, and interpretation of numericalvaluesor data.
Biostatistics (Medical Statistics): Statistical
methodologies involved in biological science.
Health Statistics: Statistical methodologies for
the numerical data of health & ill health of
human population.
Vital statistics: Statistical methodologies for
the numerical data of vital events like
marriages, divorce, births & deaths.
Demography: Scientific study of human
population
DATA : Discrete observations of
attributesorevents
INFORMATION : Data when
transformed into information by reducing,
summarizing and adjusting them for
variations.
INTELLIGENCE : Transformation of
information through integration &
processing with experience & perception
basedonsocial&politicalvalues.
Uses of Health Statistics
To measure Health status
To quantify health problems, medical &
health care needs
Planning, administration & management
of health services & programmes
To assess the effectiveness & efficiency
of health service
For research of health problems &
disease.
Data Collection
Source:
 Experiments – Hospital wards, Research, Labs,
 Surveys – Health status, Demography,
 Records – Vital events, Hospital records
Types:
 Primary data Qualitative data
 Secondary data Quantitative data
Methods:
 Observation method
 Interview method
 Questionnaires
 Miscellaneous/Others
Presentation of Data
Tabulation
 Master table
 Simple table
 Frequency Distribution table
 Bar diagram
 Pictogram
 Map diagram
Drawings
 Histogram
 Frequency polygon
 Frequency curve
Sources of Health information
Population census
Registration of vital events
Sample Registration system
Notification of diseases
Hospital records
Disease registers
Epidemiological surveillance
Health Service Records
Environmental Health data
Health manpower statistic
Population surveys
Vital Statistics
Branch of biometry deals with data
and law of human mortality, morbidity
and demography.
OR
Numerical records of marriages,
births, sickness and deaths by which
health & growth of community may be
studied.
Purpose
COMMUNITY HEALTH:
To describe the level of community health, to
diagnose community illness and to discover solutions
to health problems.
ADMINISTRATIVE :
 Provides clue for administrative action on health
activities.
HEALTH PROGRAMMED ORGANIZATION:
 To determine success or failure of specific health
programme
LEGISLATION:
 To promote health legislation at all levels.
GOVERNMENT:
 To develop policies, procedure at all levels.
Uses:
 To evaluate the impact of various National
Health programmes
 To plan for better future measures of disease
control
 To explain the hereditary nature of the
disease.
 To plan & evaluate economic, social
development
 To determine the health status of individual
 To compare health status of individual one
nation with others.
Sources of Vital Statistics
CIVIL REGISTRATION SYSTEM (CRS)
NATIONAL SAMPLE SURVEY
SAMPLE REGISTRATION SYSTEM
(SRS)
HEALTH SURVEYS
Civil Registration System
It is the continuous permanent and
compulsory recording of the occurrence
of vital events like live births, deaths,
fetal deaths, marriages, divorces,
judicial separation, adoption.
It provides legal basis to the records
and certificates made from systems.
National Sample Survey
The data collected from census is not
reliable and available only once in
10 years.
In absence of reliable data from CRS,
the need for reliable statistics at national
& state levels is being met through
Sample Surveys launched from time to
time.
Sample Registration System (SRS)
The continuous enumeration of
births and deaths in a sample of
villages / urban blocks by a resident
part time enumerator and then an
independent six monthly retrospective
survey by a full time supervisor.
Health Surveys
NFHS – National Family Health Surveys
DLHS – District Levels Health Surveys
conducted for evaluation of reproductive &
child Health programmes.
These provide estimates of fertility, child
mortality, number of fertility and number of
health parameters relating to infants and
children at state level.
Provide information on number of indicators
relating to child health & quality of services
available.
Tools of measurements
RATES
RATIOS
PROPORTIONS
RATES:
Measures the occurrence of particular event
in a population during a given time period.
No.of deaths in one year
Mid year population X 1000Death rate =
RATIO:
Measures size between two random quantities.
PROPORTION:
Indicates the relation in magnitude of a part of
the whole.
The number of children with scabies at certain time
Total number of children in a village at same time
 Sex ratio = Male population
Female population
15
X 100
X 100
Terms to remember in Vital Statistics
Live birth Crude birth rates
Fetal death Crude death rates
Still birth Specific death rates
Infant death Fetal mortality rates
Neonatal deaths Infant mortality rates
Perinatal deaths Maternal mortality rate
Maternal deaths General fertility rates
Total fertility rates
Gross reproduction rate
Net reproduction rate
Measurement of Mortality
X 1000
(a) Crude Death Rate (CDR)
= Total death in a given year
Average or mid year pop. of a
year
(b) Age-specific Death rate (ASDR)
Nos. of death at age ’a’ _X 1000
Mid-yrs pop. of a given year
at age ’a’
Crude rateis
basedon total
population whilea
specific rateis
based on thebasis
of age, sex, cause
etc
16
X 1000
(c) Cause-specific death rate
= Deaths due to the cause I (di)
Total nos. of death (D)
 Useful to analysis the death by
cause
X 1000
(d) Case fatality rate
= Death due to the specific disease
total nos. of illness due to that
disease
19
(e) Infant Mortality rate (IMR)
= Nos. of infant death in a year X 1000
Nos. of live birth in the year



Sensitive indicators
Reflect the socio-economic status of the country
Also reflect the medical and health facilities in
a population
17
f) Neonatal MortalityRate
X 1000
= Death under one
months
Nos. of live birth

It occurs basically due to the endogenous factors of
death
X 1000
g) Post-neonates MortalityRate
= Death between 1st and 1 complete
months Nos. of live birth

It is affected by the exogenous factors
(environments, sanitation, health facilities, etc)
18
(h) Maternal MortalityRate (MMR)
nos. of death of mother due to the cause
related to maternity X 1000
Total nos. of live birth
 Sensitive and important indicator of
maternal health
20
(a) Crude Birth Rate
(CBR)
X
1000
total nos. of birth in a
year Mid year pop. in
that year
X
1000
(b) General FertilityRate (GFR)
Total nos. of birth in a year
Average nos. of women
in reproductive age group
21
MEASUREMENT OF FERTILITY
(c) Age-specific fertilityRate
(ASFR)
Nos. of birth to women aged “x” X
1000 Nos. of women aged ”x”
 Useful for family planning programme point of view
(d) Age-specific Marital fertilityRate (ASMFR)
Nos.of birth to women aged ”x” X1000
Nos. of married women aged ”x”
22
(e ) Total fertilityRate
(TFR)

The physical meaning of TFR is that it is the
expected number of children that a women will
bear in her life time, passing through the
reproductive age and bearing children according
to fixed schedule of fertility
23
(f) GrossReproduction Rate
(GRR)

is a measure of population which describe the
rate of increase of population over a generation

Defined as the average number of daughter among
birth cohort of women, which they willbear in
their life time, passing through the reproductive
age and bearing children according to fixed
schedule of fertility, if they survive to the end of
child bearing period.
24
(g) Net Reproduction Rate
(NRR)
 Measure of number of daughters which a
cohort of girl infant will bear as grow to
adulthood and pass through the child period,
provided that as they pass through each age
they bear children at the rate indicated by a
current schedule of age specific fertility rates
and from birth till the end of the child
bearing period they are subjected to
mortality as per life table
25
The most successful man in life is the
man who has the best information
THANK YOU

Health statistics

  • 1.
    HEALTH STATISTICS Dr. PRABHU. C.NAGALAPUR M.D (AYU) ASSOCIATE PROFESSOR DEPT OF SWASTHAVRITTA & YOGA S.J.G. AYURVEDIC MEDICAL COLLEGE & HOSPITAL, KOPPAL MOBILE: 9886677088 EMAIL:drprabhu.ayu24@gmail.com
  • 2.
    Importance Integral part ofnational health system Collection, Processing, analysis & transmission of information required for organizing and operating health services, for research & training.
  • 3.
    Definitions Statistics: is thestudy of the collection, organization, analysis, and interpretation of numericalvaluesor data. Biostatistics (Medical Statistics): Statistical methodologies involved in biological science. Health Statistics: Statistical methodologies for the numerical data of health & ill health of human population. Vital statistics: Statistical methodologies for the numerical data of vital events like marriages, divorce, births & deaths. Demography: Scientific study of human population
  • 4.
    DATA : Discreteobservations of attributesorevents INFORMATION : Data when transformed into information by reducing, summarizing and adjusting them for variations. INTELLIGENCE : Transformation of information through integration & processing with experience & perception basedonsocial&politicalvalues.
  • 5.
    Uses of HealthStatistics To measure Health status To quantify health problems, medical & health care needs Planning, administration & management of health services & programmes To assess the effectiveness & efficiency of health service For research of health problems & disease.
  • 6.
    Data Collection Source:  Experiments– Hospital wards, Research, Labs,  Surveys – Health status, Demography,  Records – Vital events, Hospital records Types:  Primary data Qualitative data  Secondary data Quantitative data Methods:  Observation method  Interview method  Questionnaires  Miscellaneous/Others
  • 7.
    Presentation of Data Tabulation Master table  Simple table  Frequency Distribution table  Bar diagram  Pictogram  Map diagram Drawings  Histogram  Frequency polygon  Frequency curve
  • 8.
    Sources of Healthinformation Population census Registration of vital events Sample Registration system Notification of diseases Hospital records Disease registers Epidemiological surveillance Health Service Records Environmental Health data Health manpower statistic Population surveys
  • 9.
    Vital Statistics Branch ofbiometry deals with data and law of human mortality, morbidity and demography. OR Numerical records of marriages, births, sickness and deaths by which health & growth of community may be studied.
  • 10.
    Purpose COMMUNITY HEALTH: To describethe level of community health, to diagnose community illness and to discover solutions to health problems. ADMINISTRATIVE :  Provides clue for administrative action on health activities. HEALTH PROGRAMMED ORGANIZATION:  To determine success or failure of specific health programme LEGISLATION:  To promote health legislation at all levels. GOVERNMENT:  To develop policies, procedure at all levels.
  • 11.
    Uses:  To evaluatethe impact of various National Health programmes  To plan for better future measures of disease control  To explain the hereditary nature of the disease.  To plan & evaluate economic, social development  To determine the health status of individual  To compare health status of individual one nation with others.
  • 12.
    Sources of VitalStatistics CIVIL REGISTRATION SYSTEM (CRS) NATIONAL SAMPLE SURVEY SAMPLE REGISTRATION SYSTEM (SRS) HEALTH SURVEYS
  • 13.
    Civil Registration System Itis the continuous permanent and compulsory recording of the occurrence of vital events like live births, deaths, fetal deaths, marriages, divorces, judicial separation, adoption. It provides legal basis to the records and certificates made from systems.
  • 14.
    National Sample Survey Thedata collected from census is not reliable and available only once in 10 years. In absence of reliable data from CRS, the need for reliable statistics at national & state levels is being met through Sample Surveys launched from time to time.
  • 15.
    Sample Registration System(SRS) The continuous enumeration of births and deaths in a sample of villages / urban blocks by a resident part time enumerator and then an independent six monthly retrospective survey by a full time supervisor.
  • 16.
    Health Surveys NFHS –National Family Health Surveys DLHS – District Levels Health Surveys conducted for evaluation of reproductive & child Health programmes. These provide estimates of fertility, child mortality, number of fertility and number of health parameters relating to infants and children at state level. Provide information on number of indicators relating to child health & quality of services available.
  • 17.
    Tools of measurements RATES RATIOS PROPORTIONS RATES: Measuresthe occurrence of particular event in a population during a given time period. No.of deaths in one year Mid year population X 1000Death rate =
  • 18.
    RATIO: Measures size betweentwo random quantities. PROPORTION: Indicates the relation in magnitude of a part of the whole. The number of children with scabies at certain time Total number of children in a village at same time  Sex ratio = Male population Female population 15 X 100 X 100
  • 19.
    Terms to rememberin Vital Statistics Live birth Crude birth rates Fetal death Crude death rates Still birth Specific death rates Infant death Fetal mortality rates Neonatal deaths Infant mortality rates Perinatal deaths Maternal mortality rate Maternal deaths General fertility rates Total fertility rates Gross reproduction rate Net reproduction rate
  • 20.
    Measurement of Mortality X1000 (a) Crude Death Rate (CDR) = Total death in a given year Average or mid year pop. of a year (b) Age-specific Death rate (ASDR) Nos. of death at age ’a’ _X 1000 Mid-yrs pop. of a given year at age ’a’ Crude rateis basedon total population whilea specific rateis based on thebasis of age, sex, cause etc 16
  • 21.
    X 1000 (c) Cause-specificdeath rate = Deaths due to the cause I (di) Total nos. of death (D)  Useful to analysis the death by cause X 1000 (d) Case fatality rate = Death due to the specific disease total nos. of illness due to that disease 19
  • 22.
    (e) Infant Mortalityrate (IMR) = Nos. of infant death in a year X 1000 Nos. of live birth in the year    Sensitive indicators Reflect the socio-economic status of the country Also reflect the medical and health facilities in a population 17
  • 23.
    f) Neonatal MortalityRate X1000 = Death under one months Nos. of live birth  It occurs basically due to the endogenous factors of death X 1000 g) Post-neonates MortalityRate = Death between 1st and 1 complete months Nos. of live birth  It is affected by the exogenous factors (environments, sanitation, health facilities, etc) 18
  • 24.
    (h) Maternal MortalityRate(MMR) nos. of death of mother due to the cause related to maternity X 1000 Total nos. of live birth  Sensitive and important indicator of maternal health 20
  • 25.
    (a) Crude BirthRate (CBR) X 1000 total nos. of birth in a year Mid year pop. in that year X 1000 (b) General FertilityRate (GFR) Total nos. of birth in a year Average nos. of women in reproductive age group 21 MEASUREMENT OF FERTILITY
  • 26.
    (c) Age-specific fertilityRate (ASFR) Nos.of birth to women aged “x” X 1000 Nos. of women aged ”x”  Useful for family planning programme point of view (d) Age-specific Marital fertilityRate (ASMFR) Nos.of birth to women aged ”x” X1000 Nos. of married women aged ”x” 22
  • 27.
    (e ) TotalfertilityRate (TFR)  The physical meaning of TFR is that it is the expected number of children that a women will bear in her life time, passing through the reproductive age and bearing children according to fixed schedule of fertility 23
  • 28.
    (f) GrossReproduction Rate (GRR)  isa measure of population which describe the rate of increase of population over a generation  Defined as the average number of daughter among birth cohort of women, which they willbear in their life time, passing through the reproductive age and bearing children according to fixed schedule of fertility, if they survive to the end of child bearing period. 24
  • 29.
    (g) Net ReproductionRate (NRR)  Measure of number of daughters which a cohort of girl infant will bear as grow to adulthood and pass through the child period, provided that as they pass through each age they bear children at the rate indicated by a current schedule of age specific fertility rates and from birth till the end of the child bearing period they are subjected to mortality as per life table 25
  • 30.
    The most successfulman in life is the man who has the best information THANK YOU