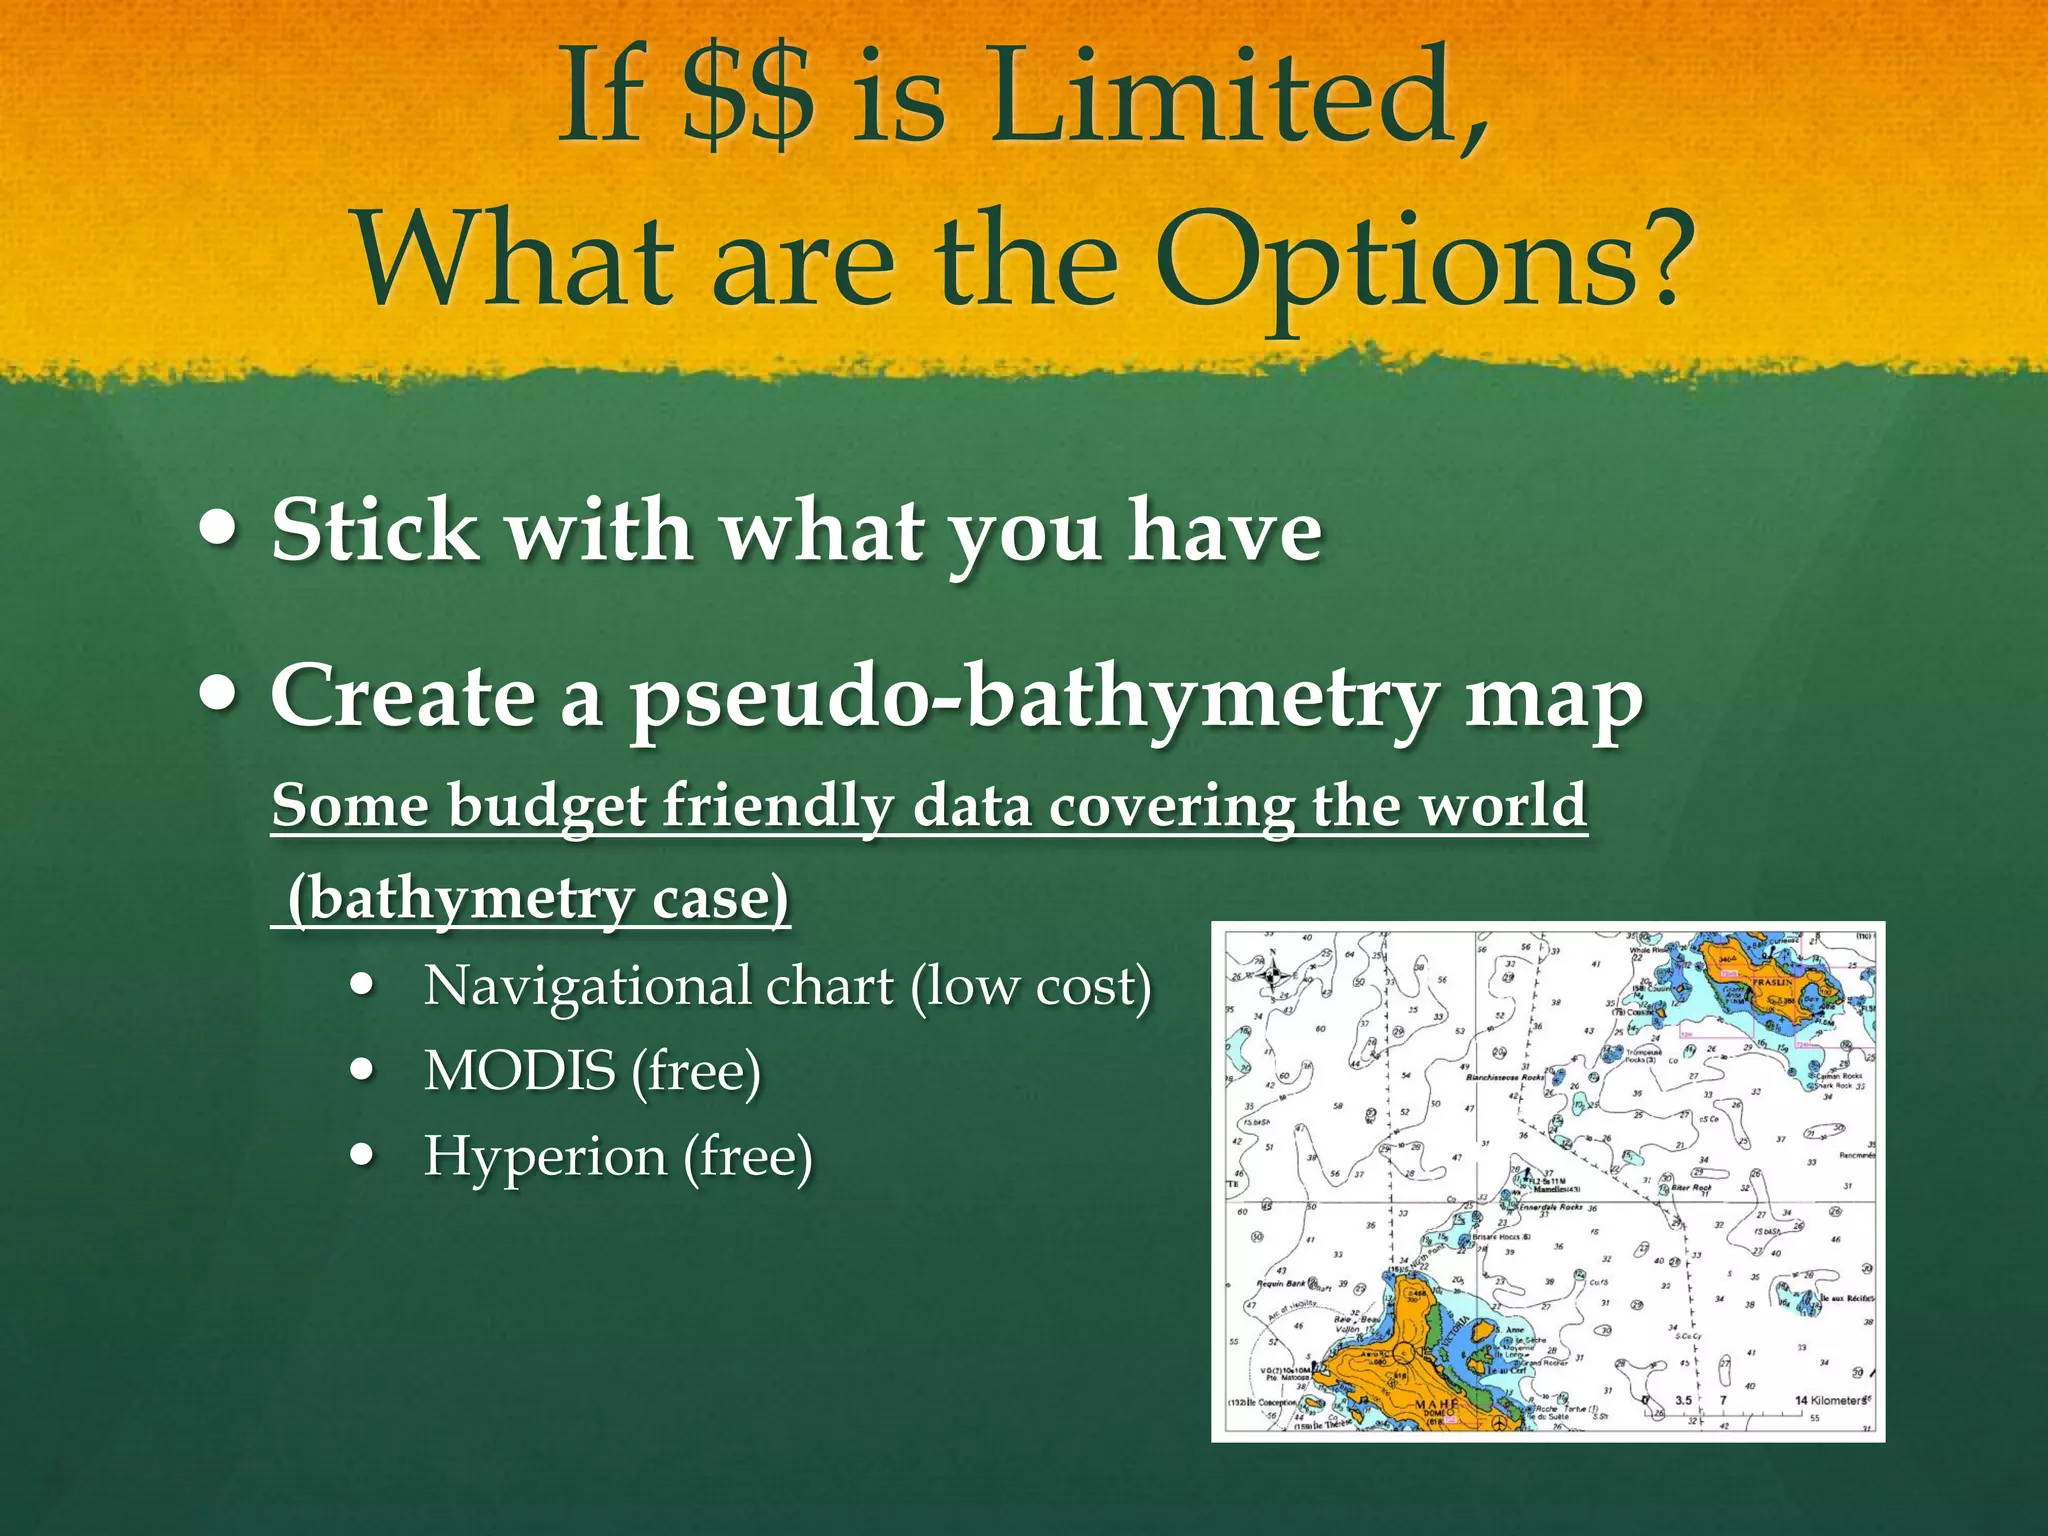
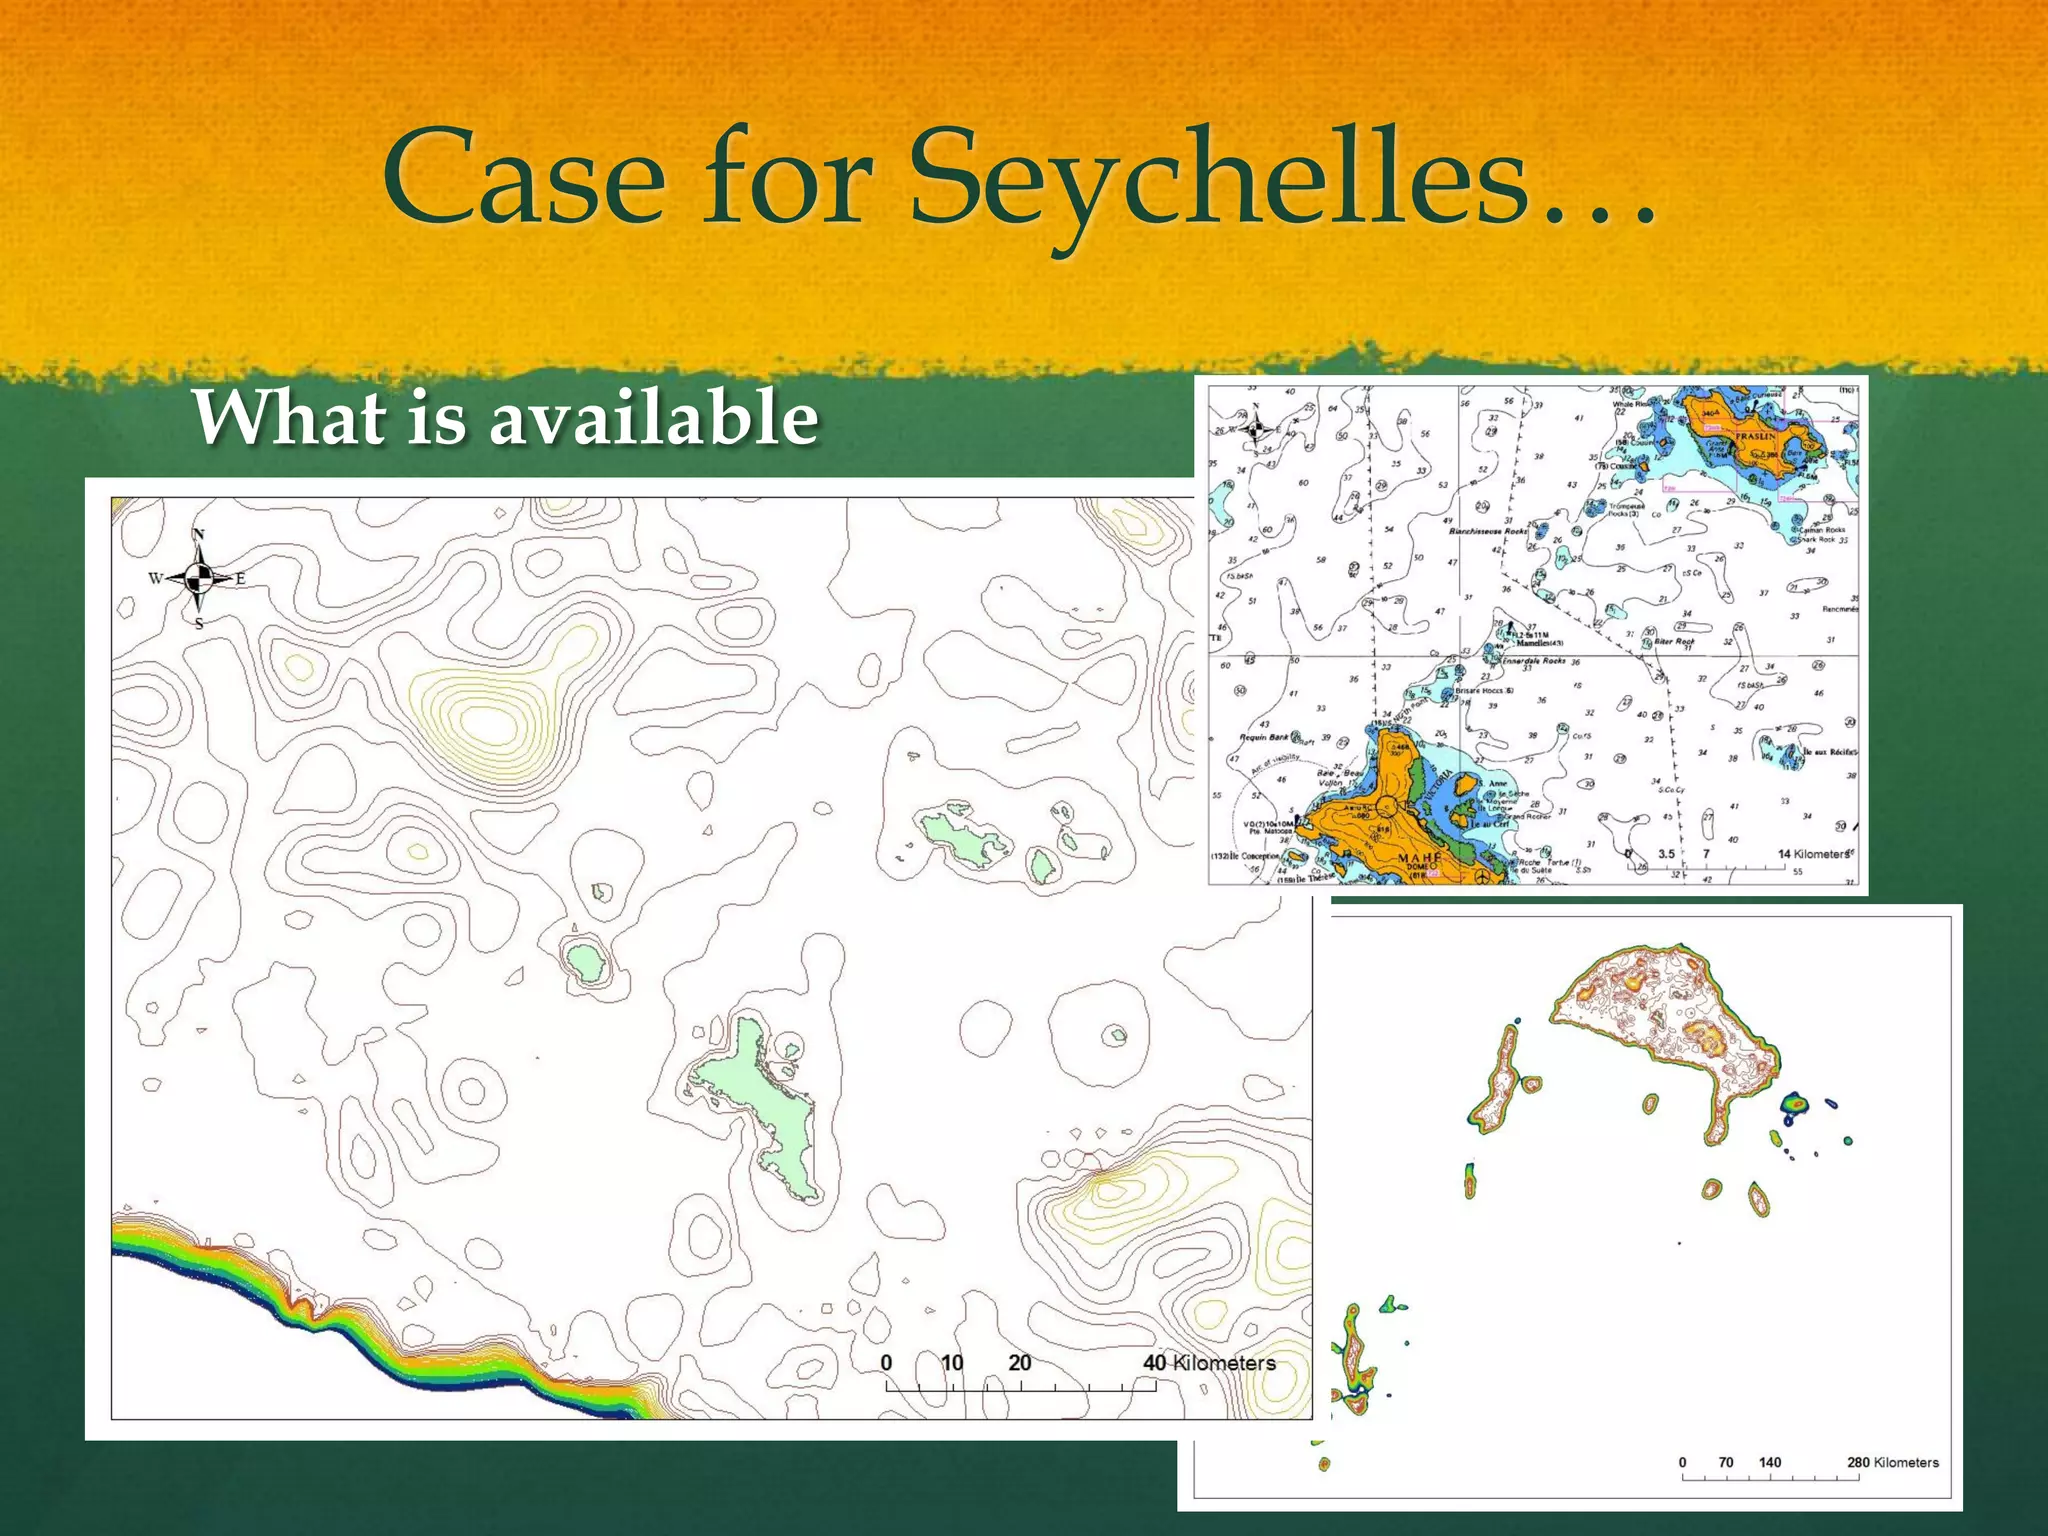
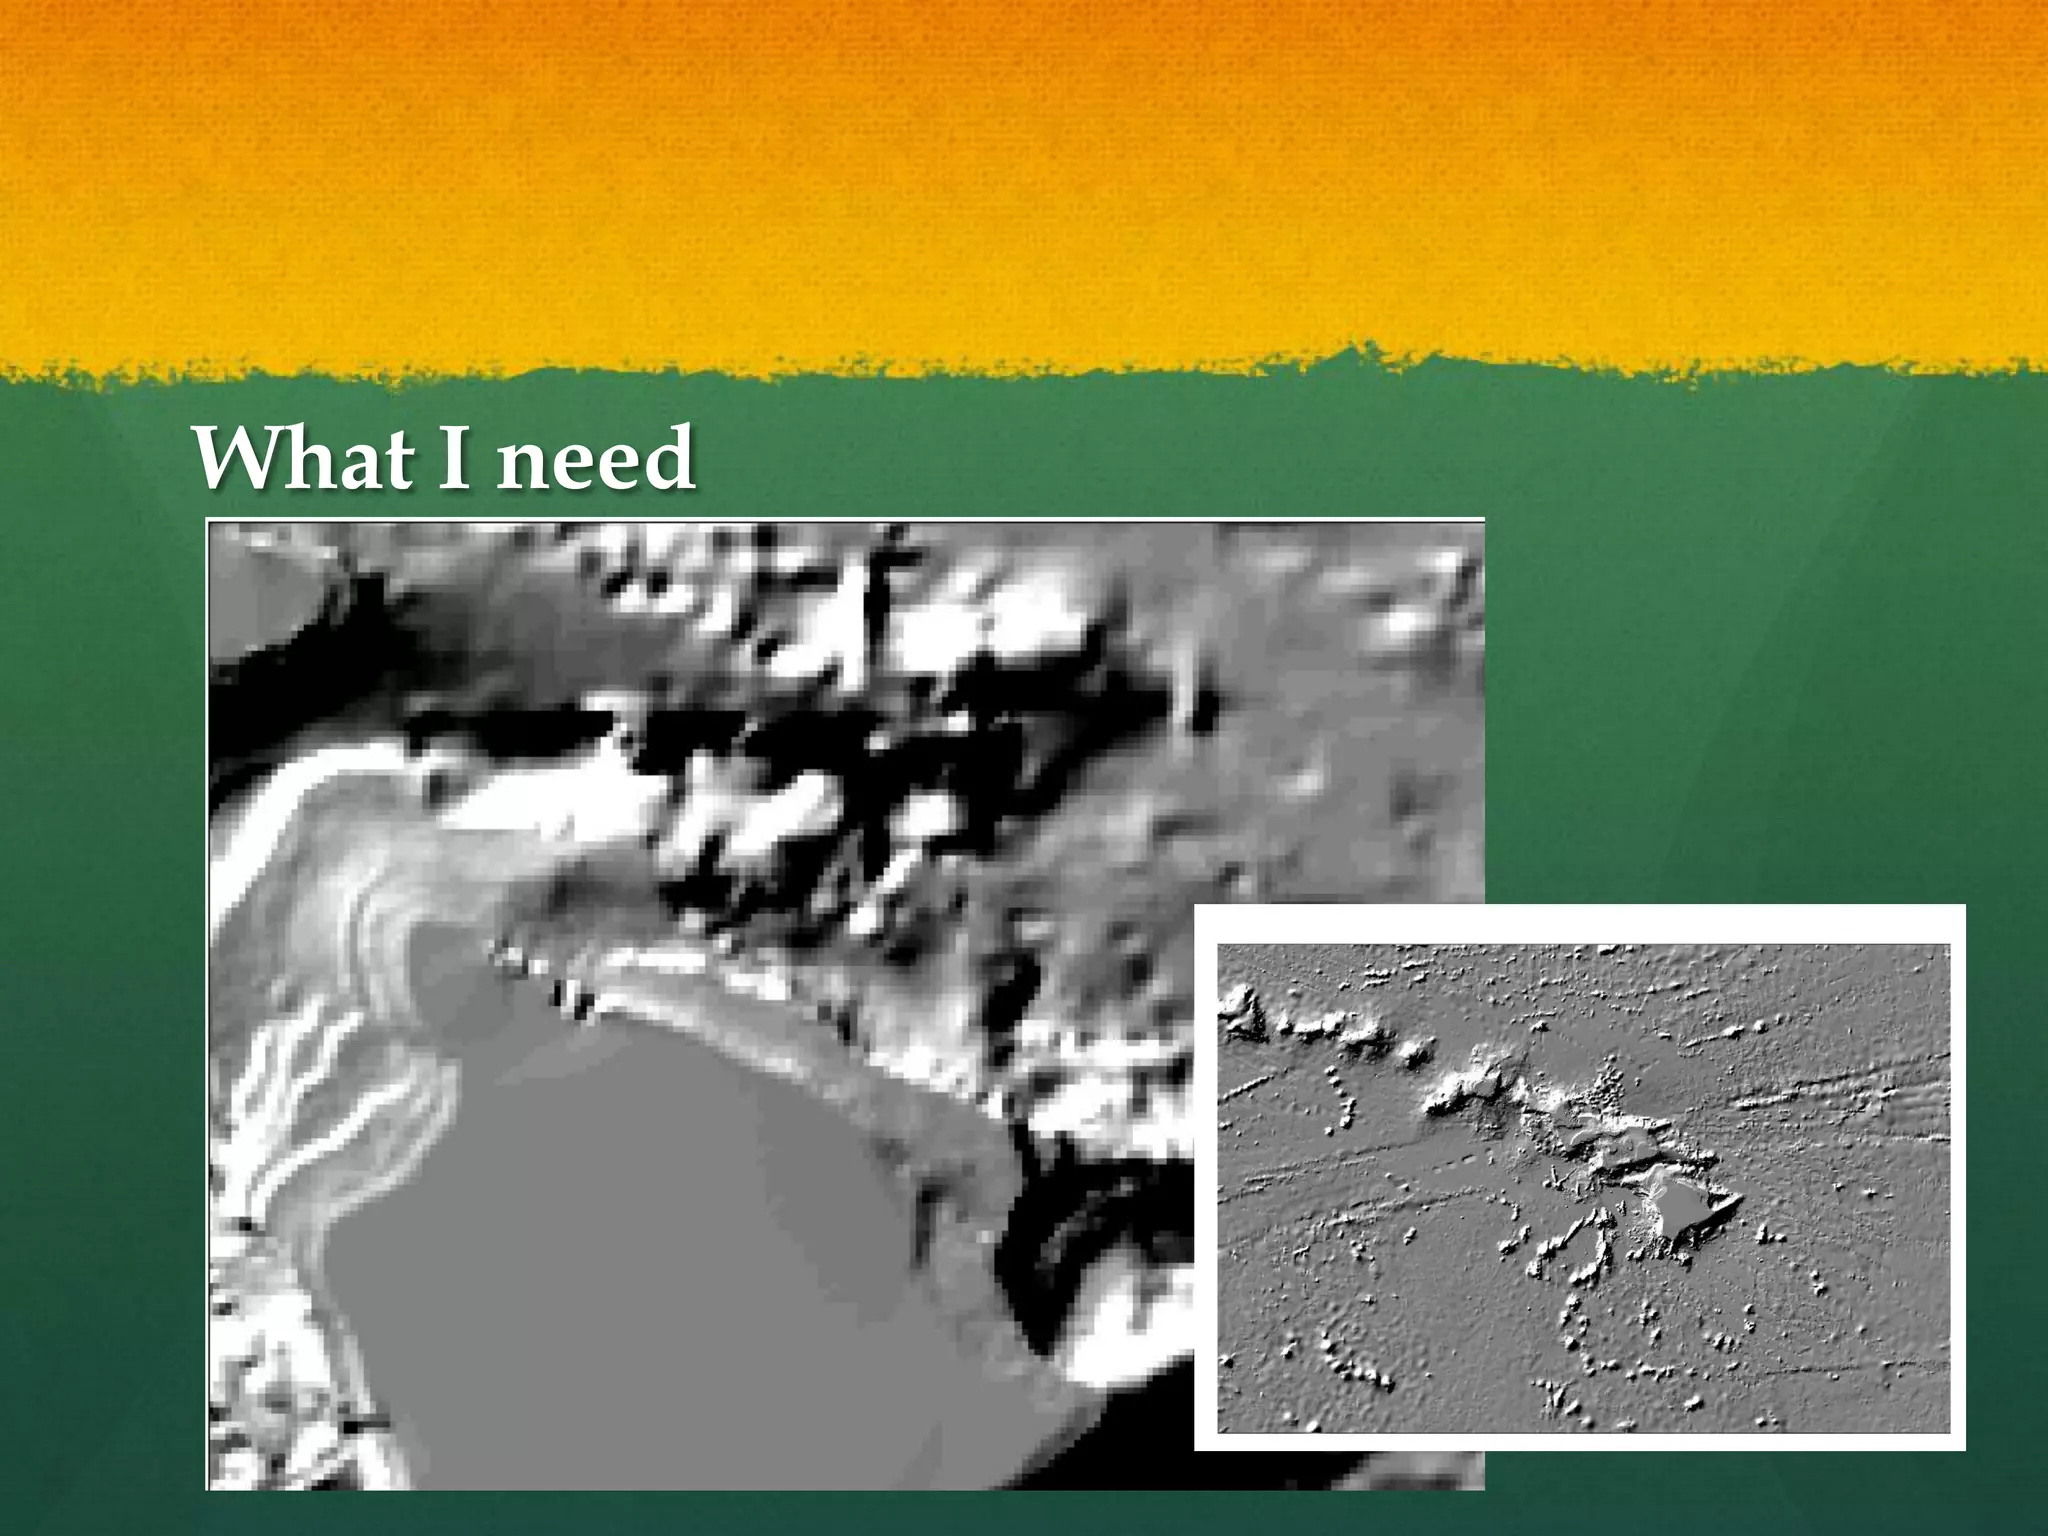
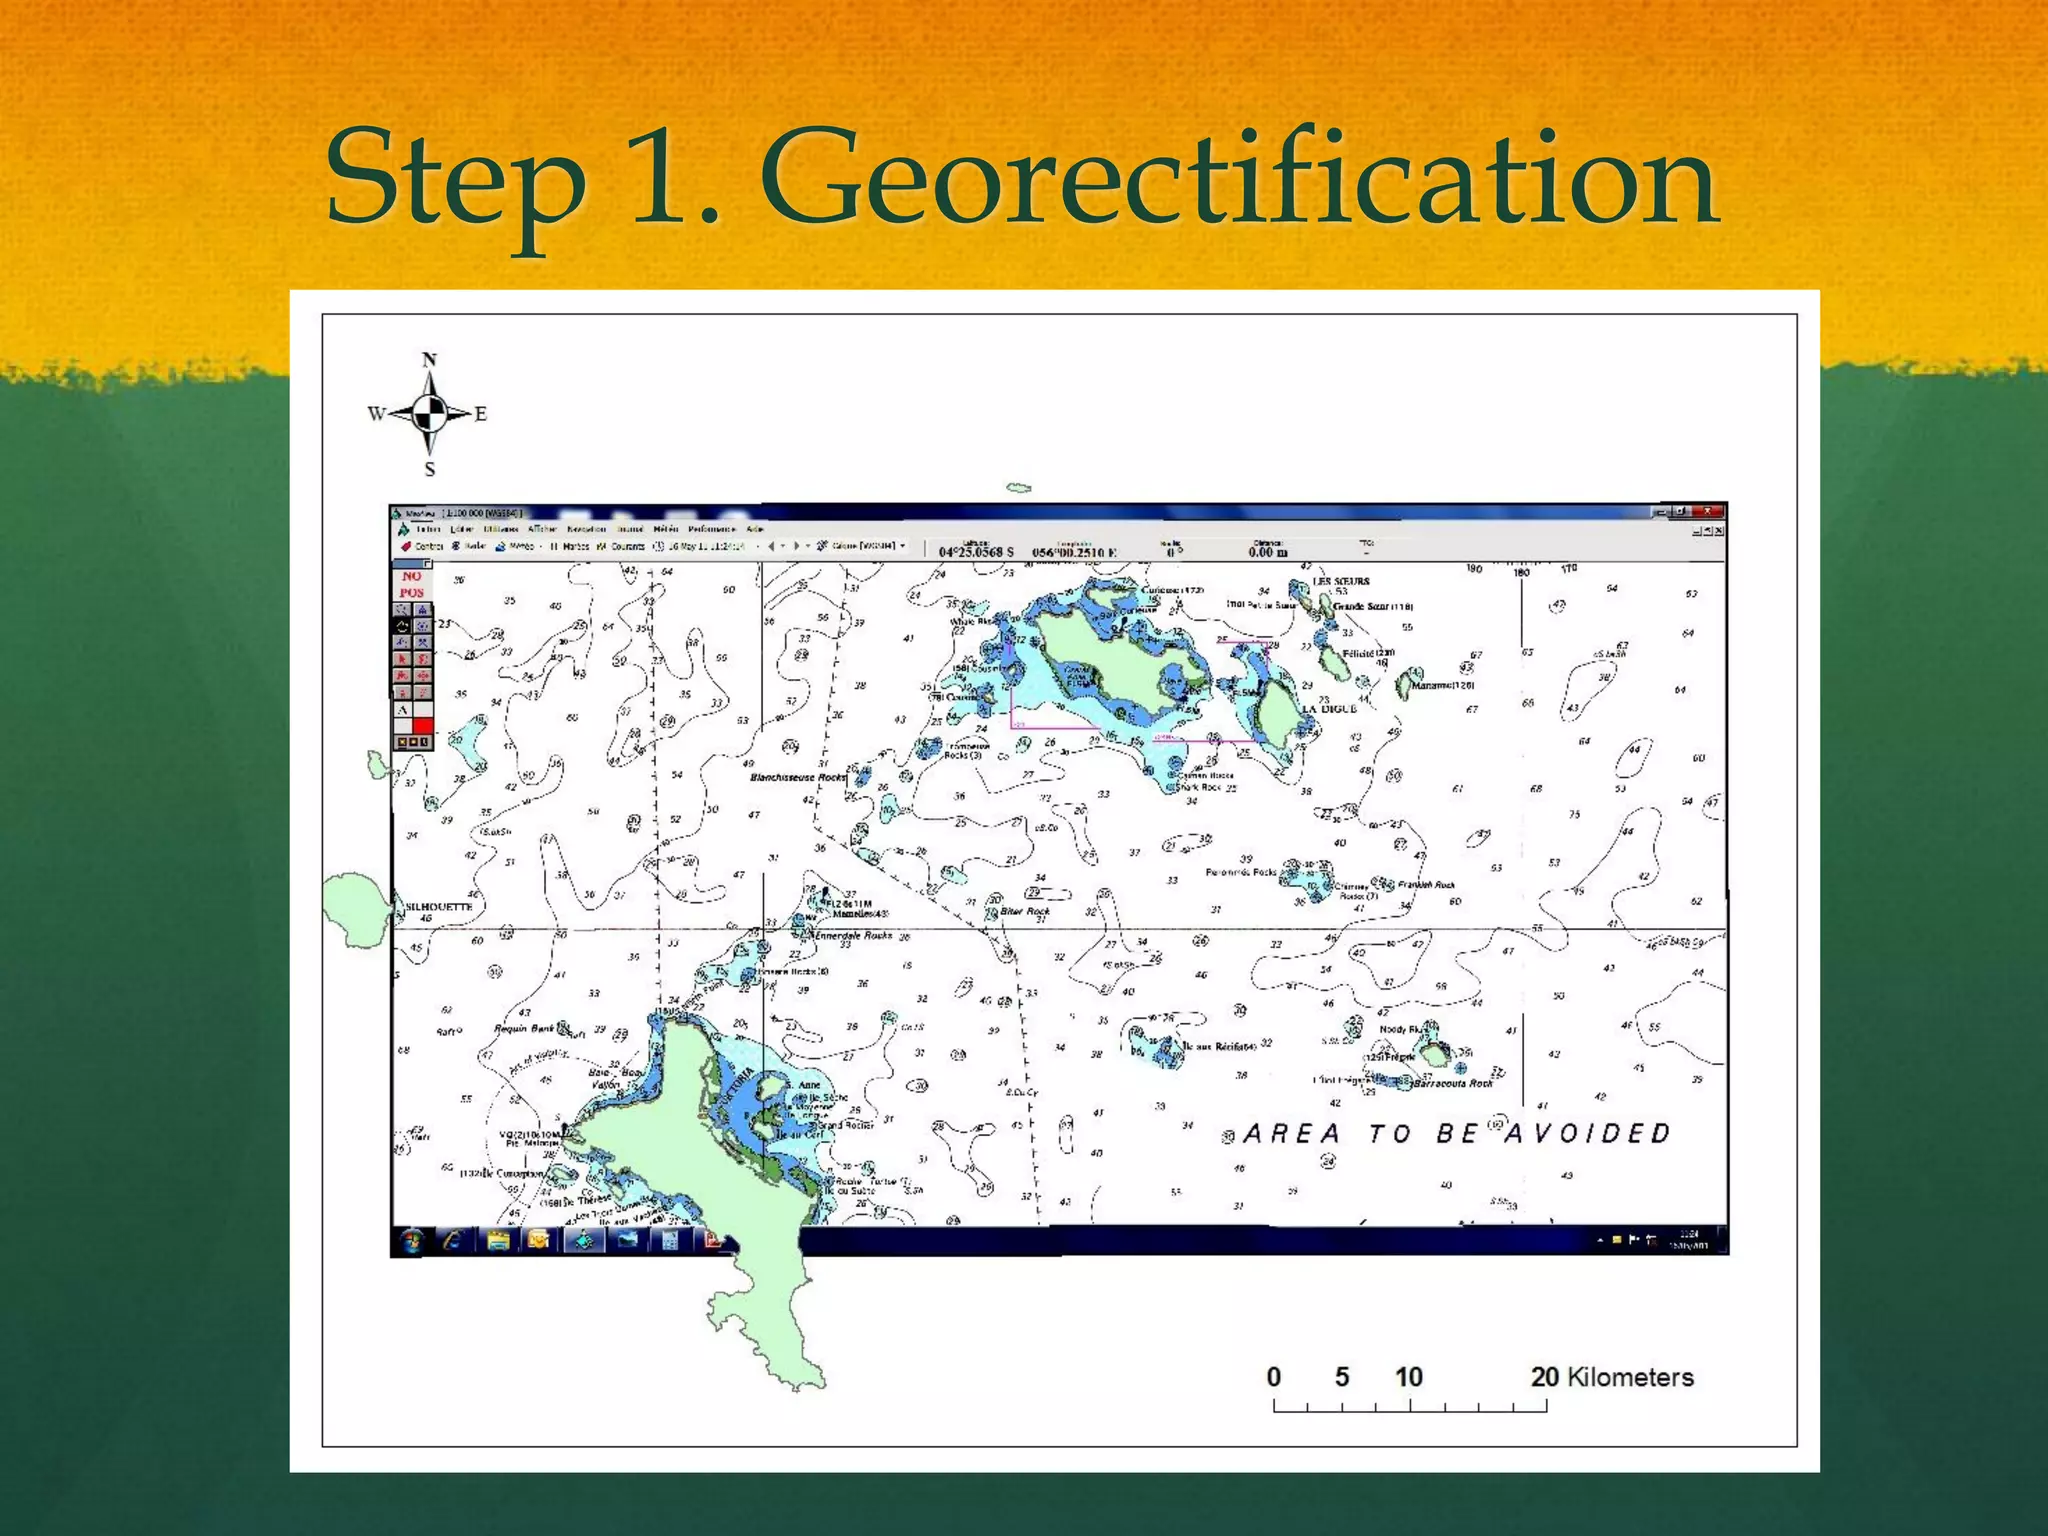
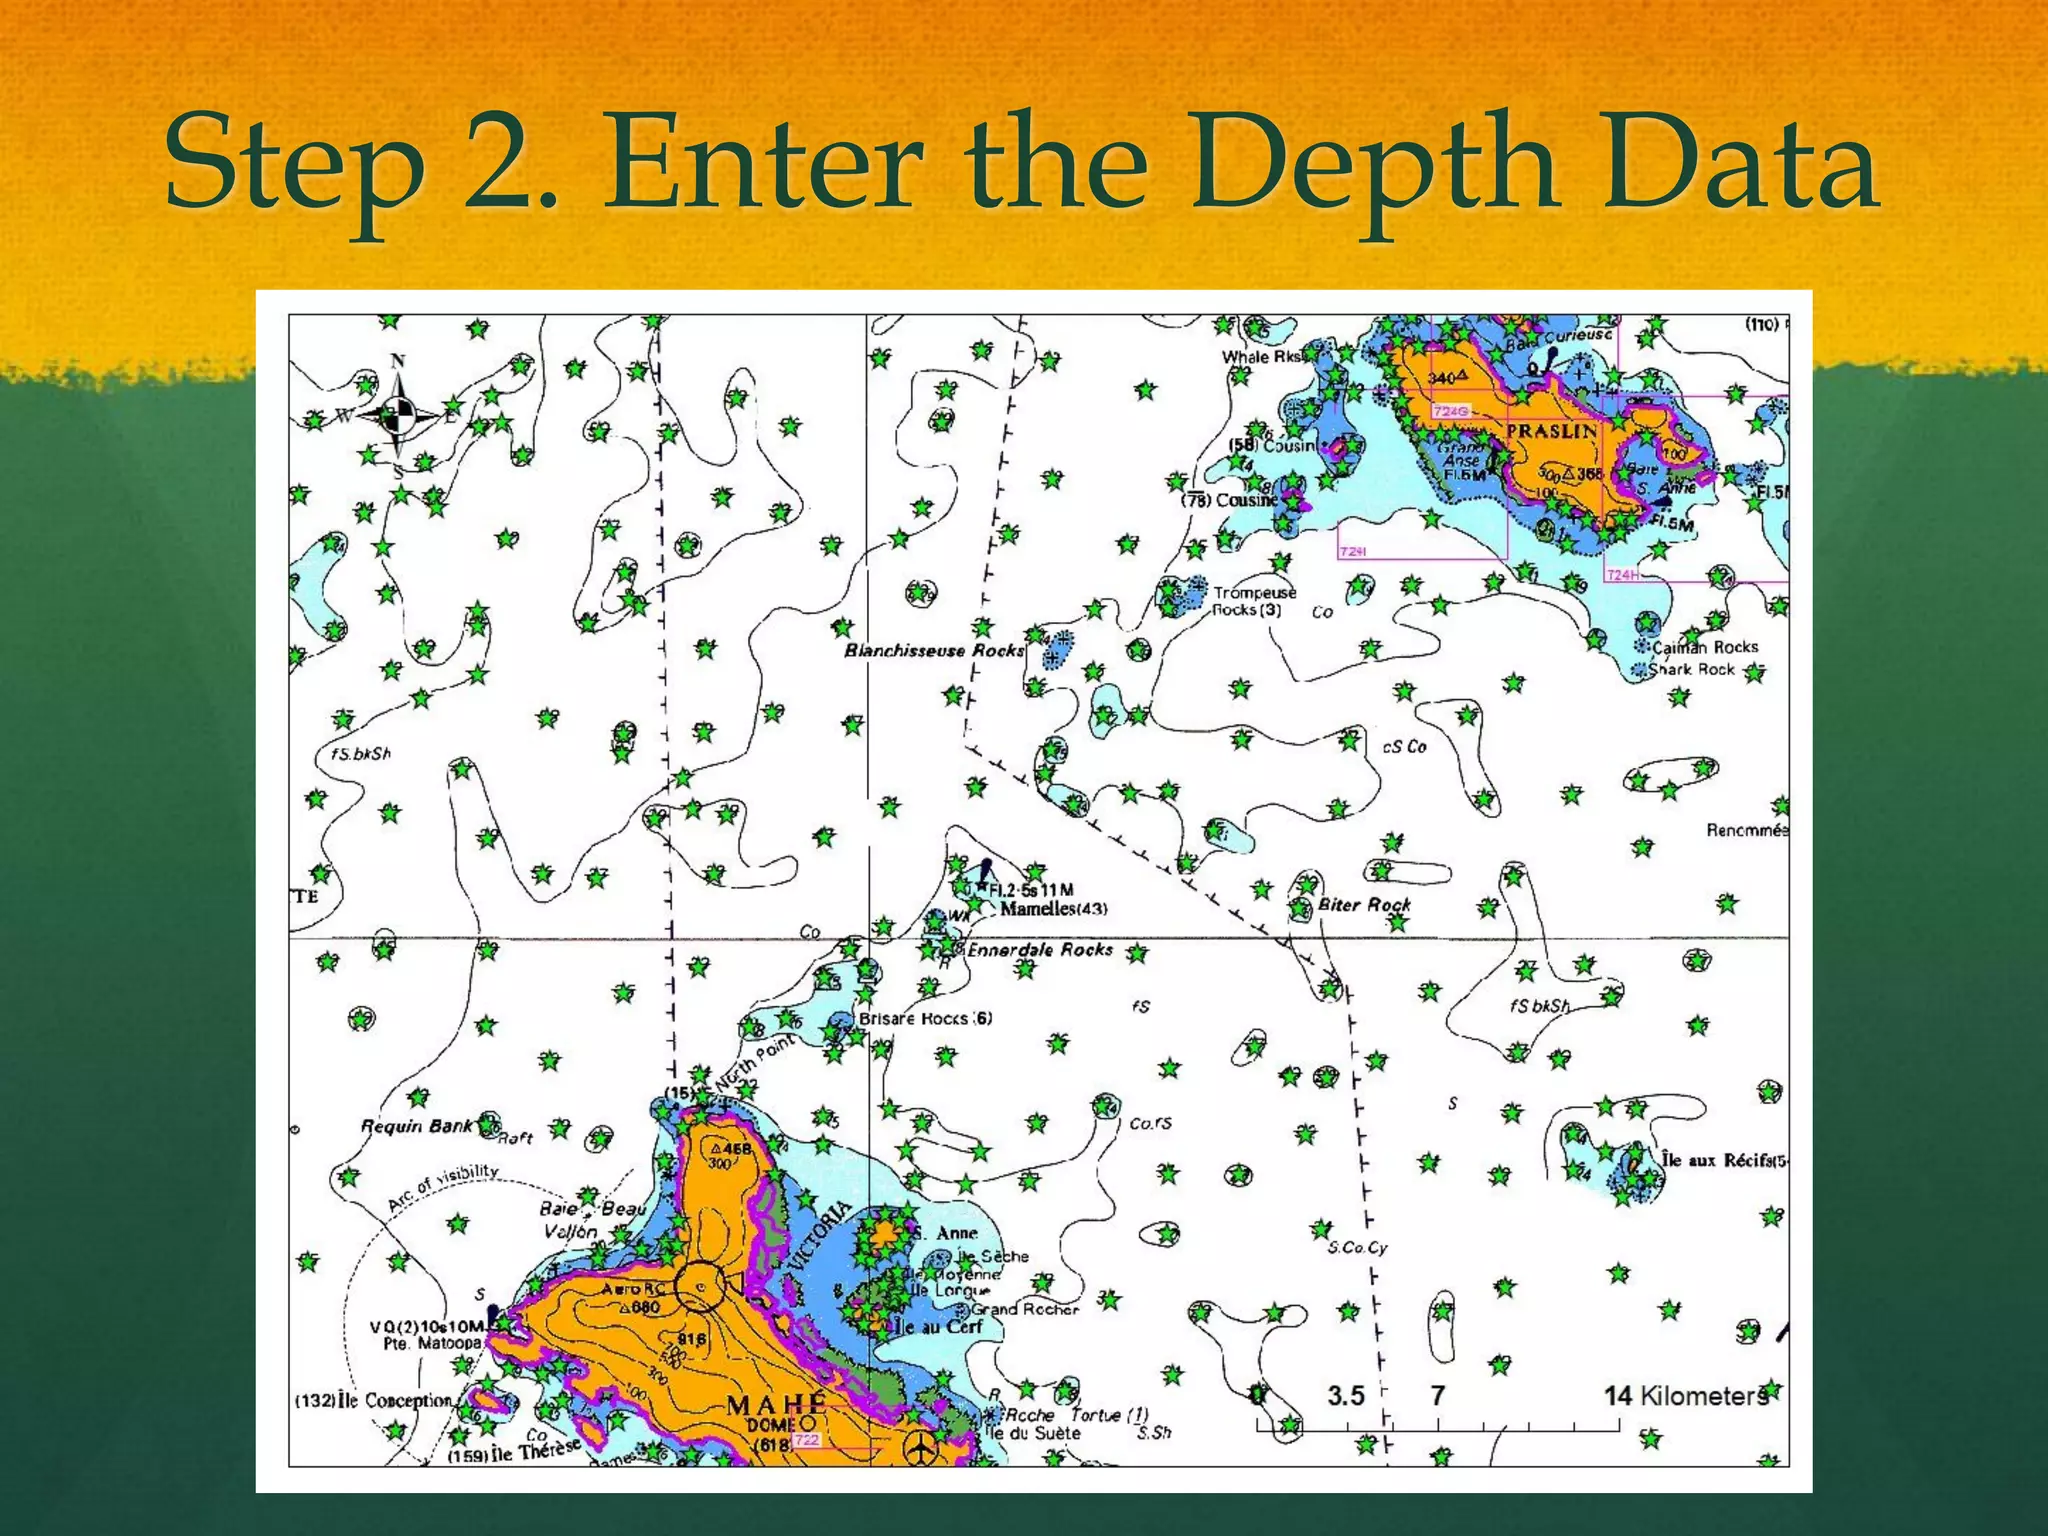
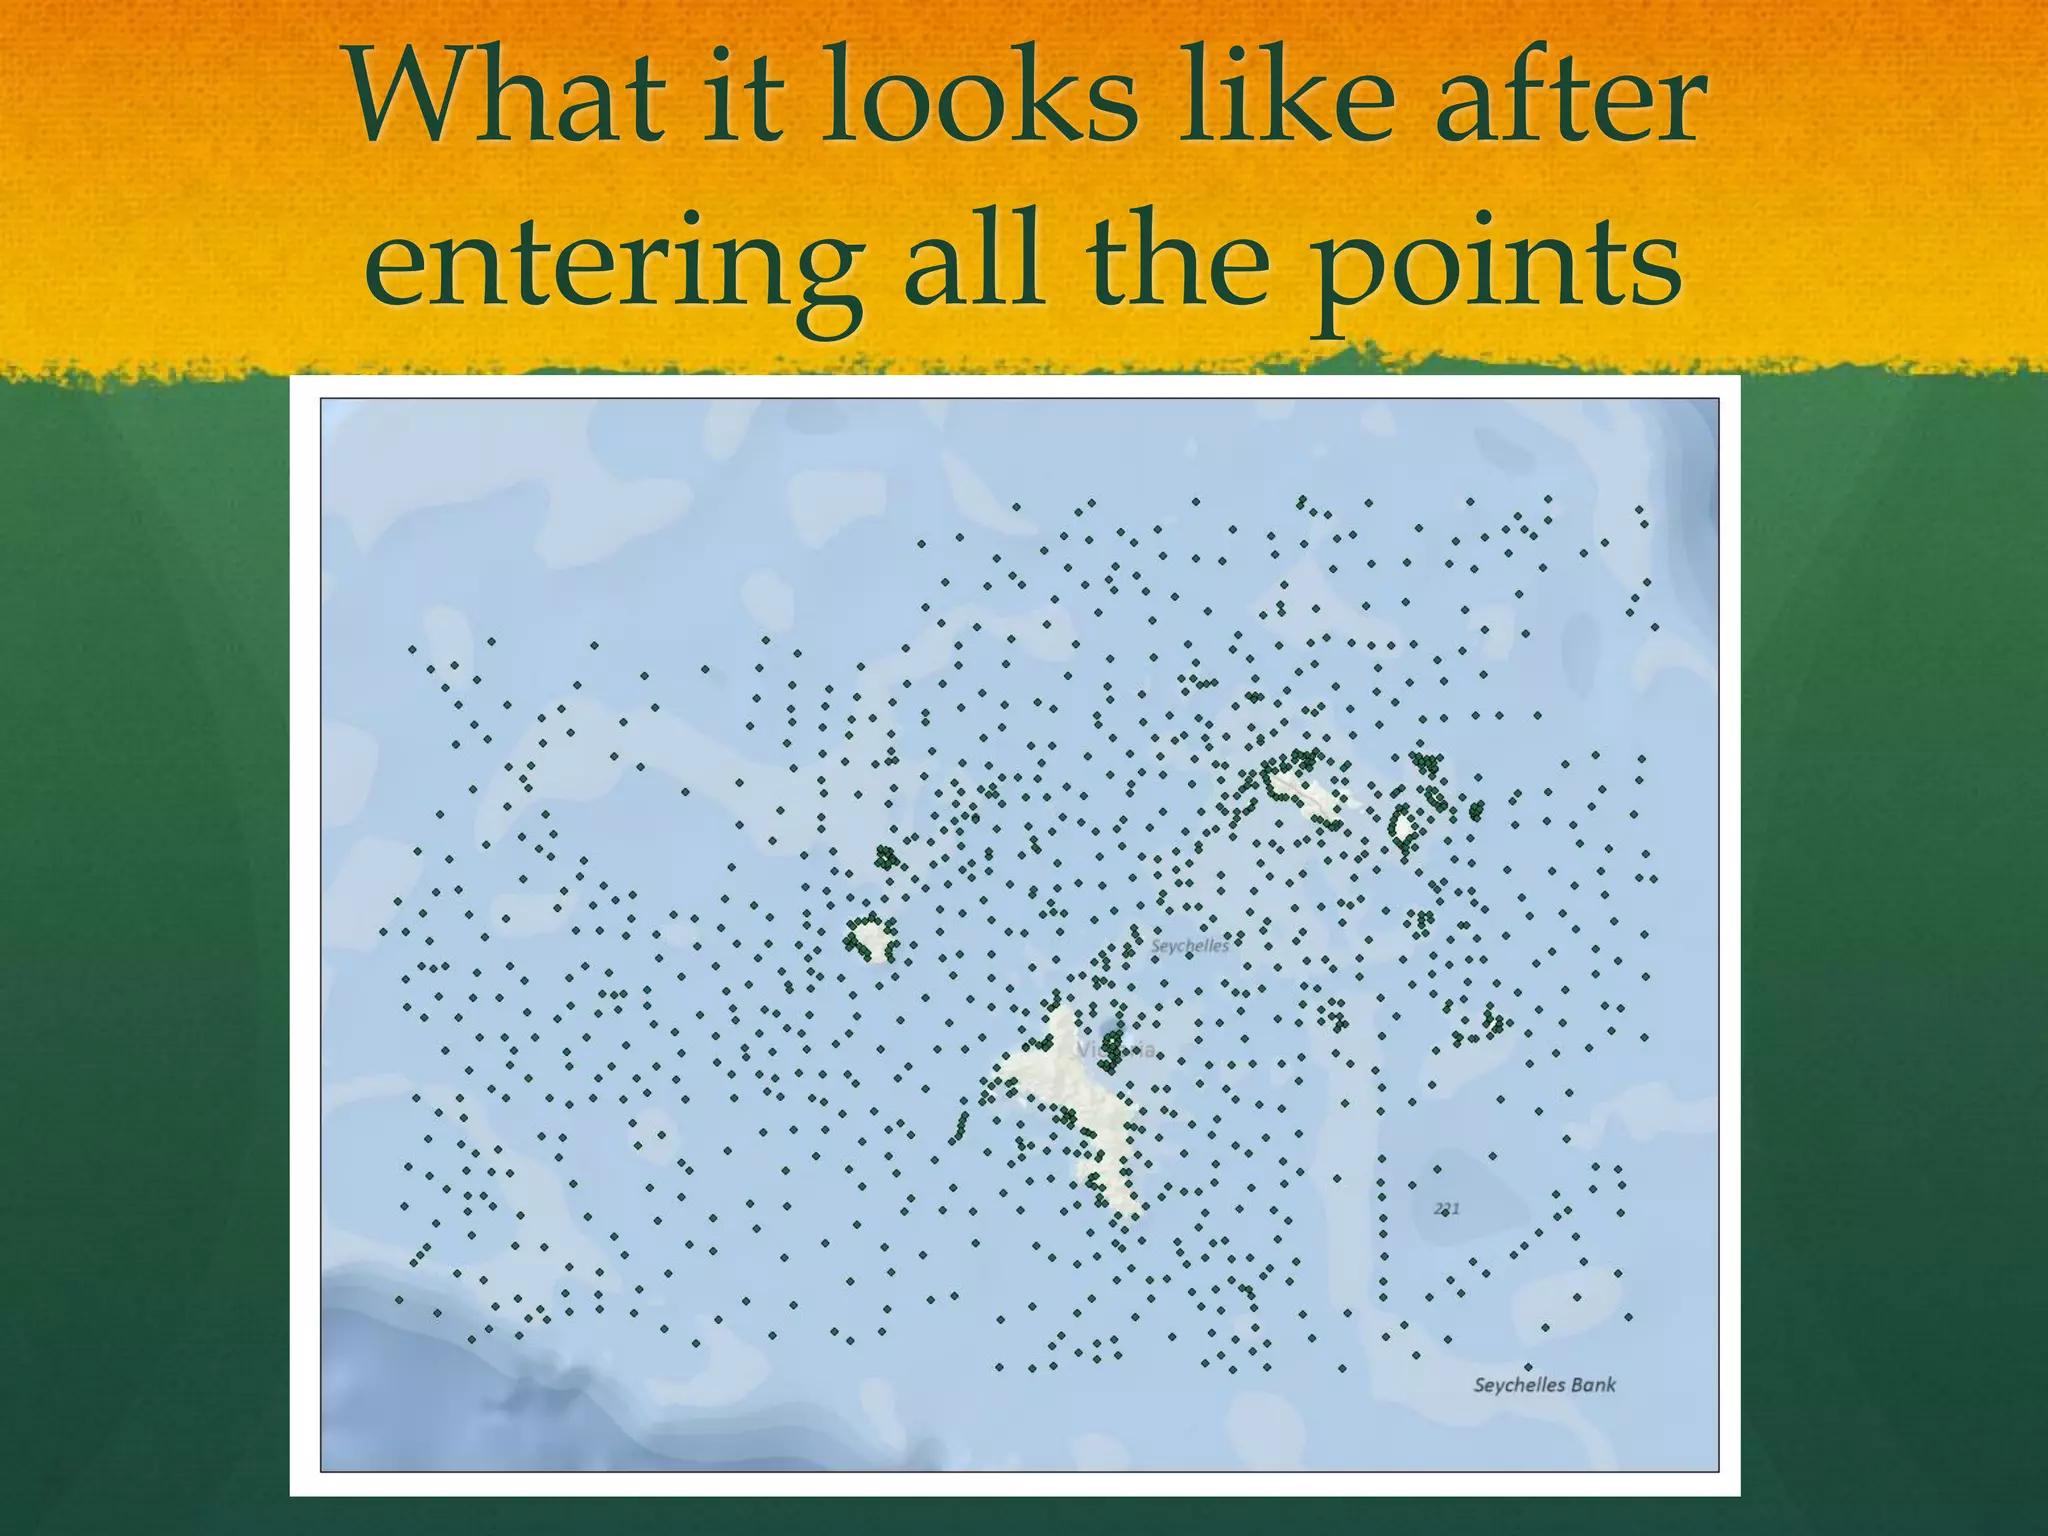
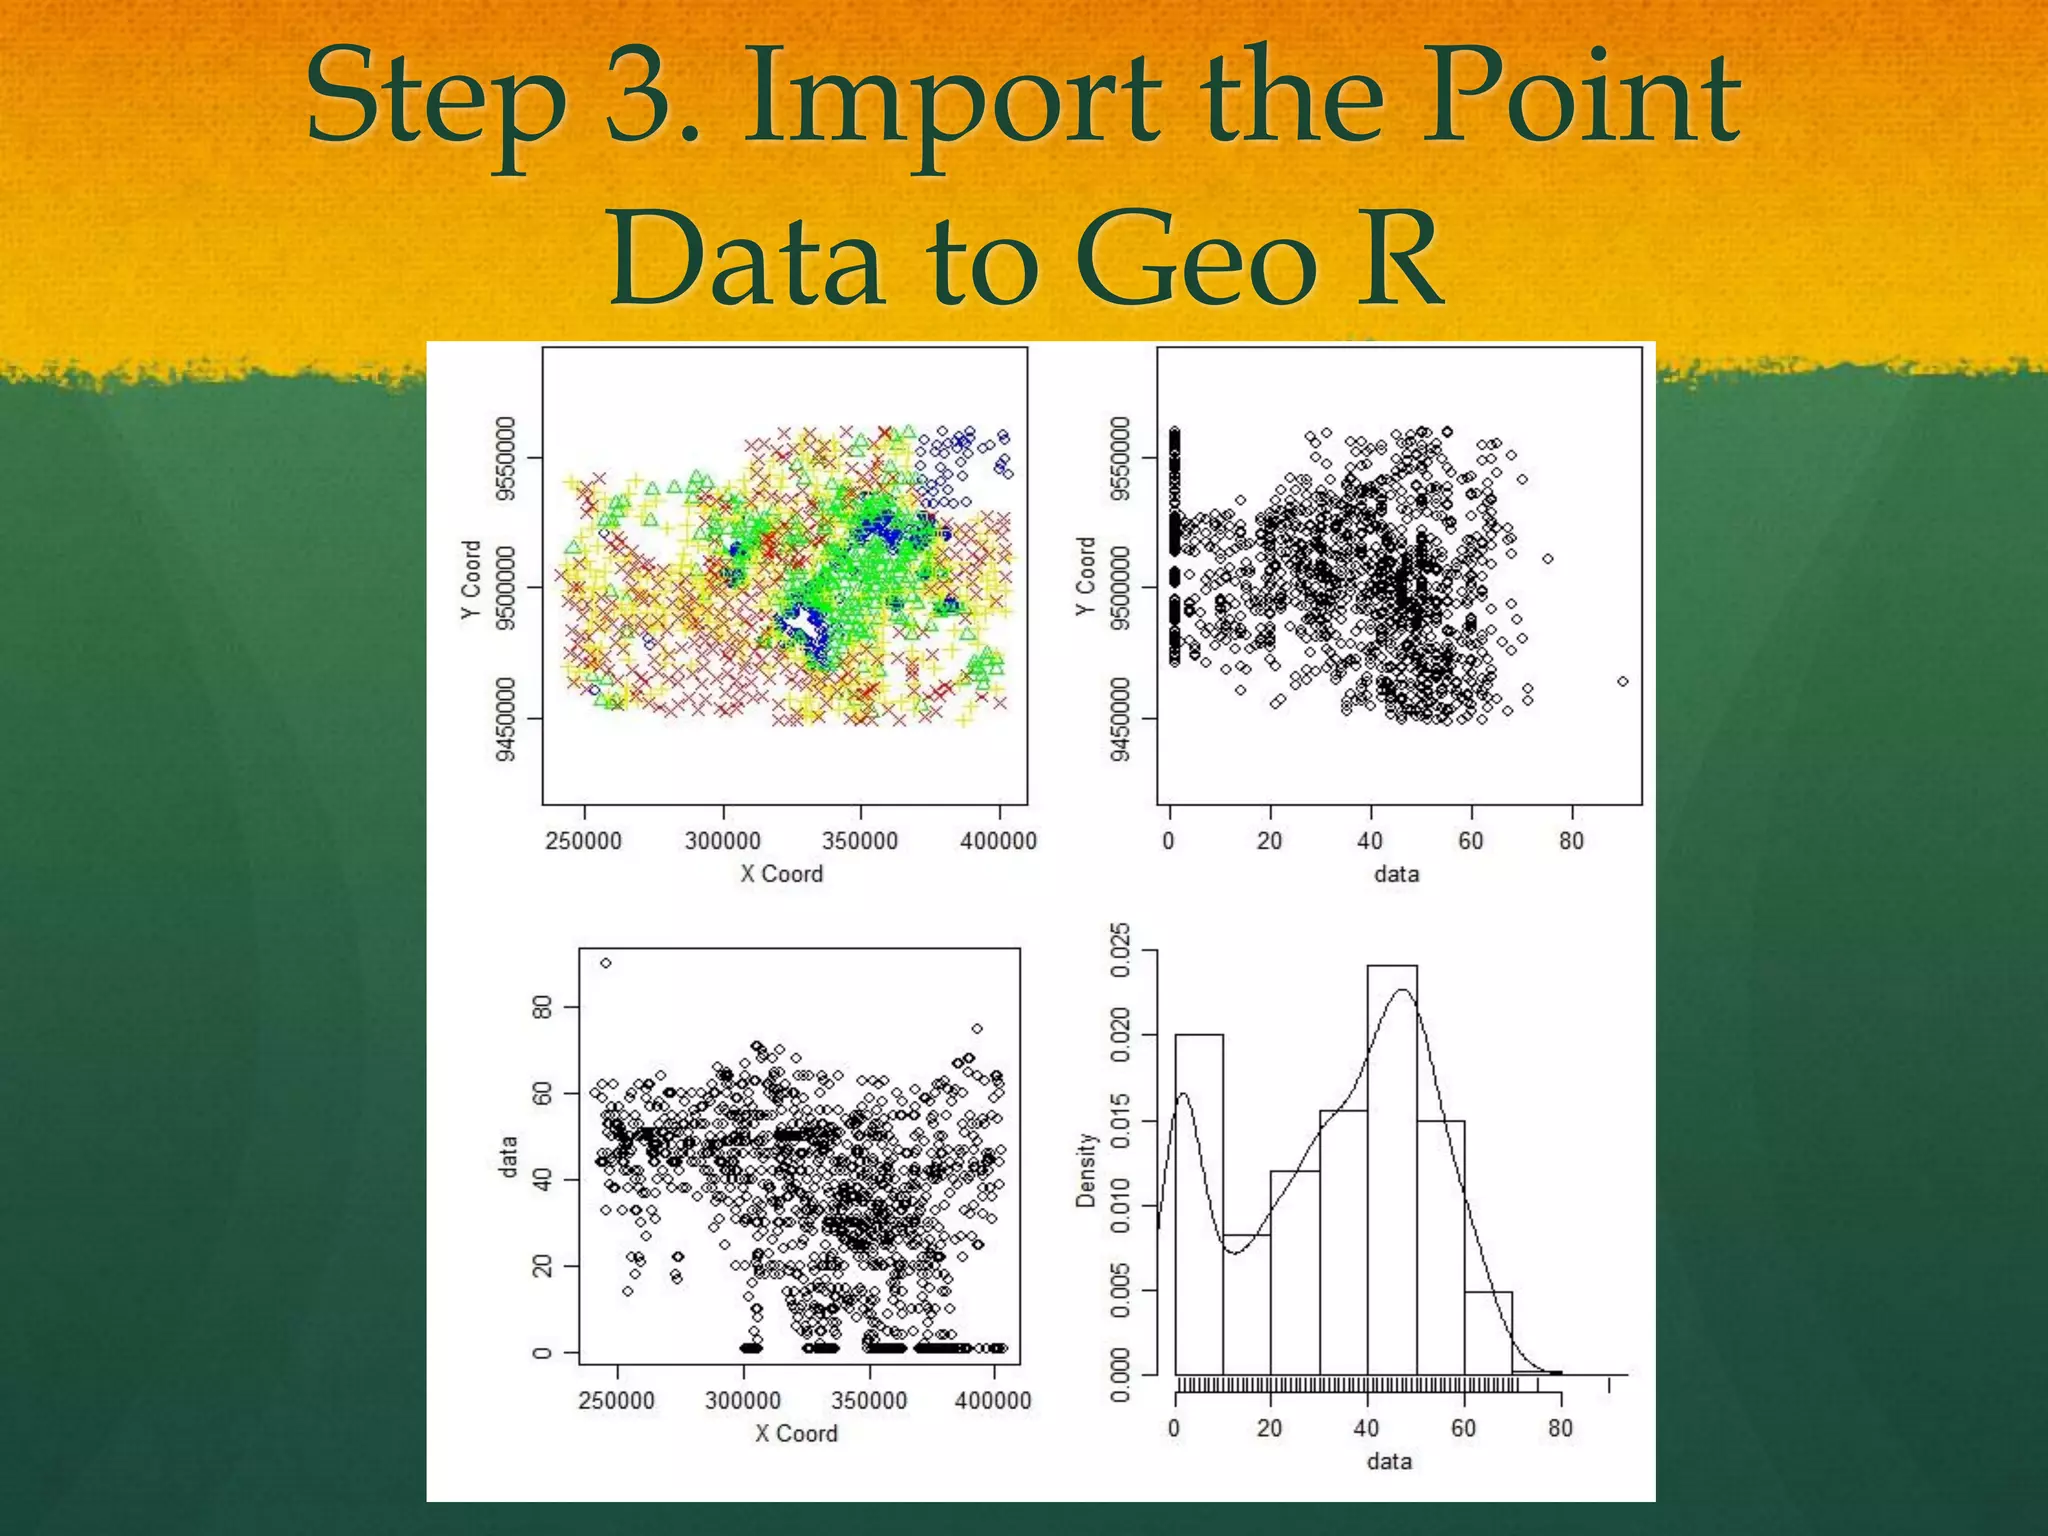
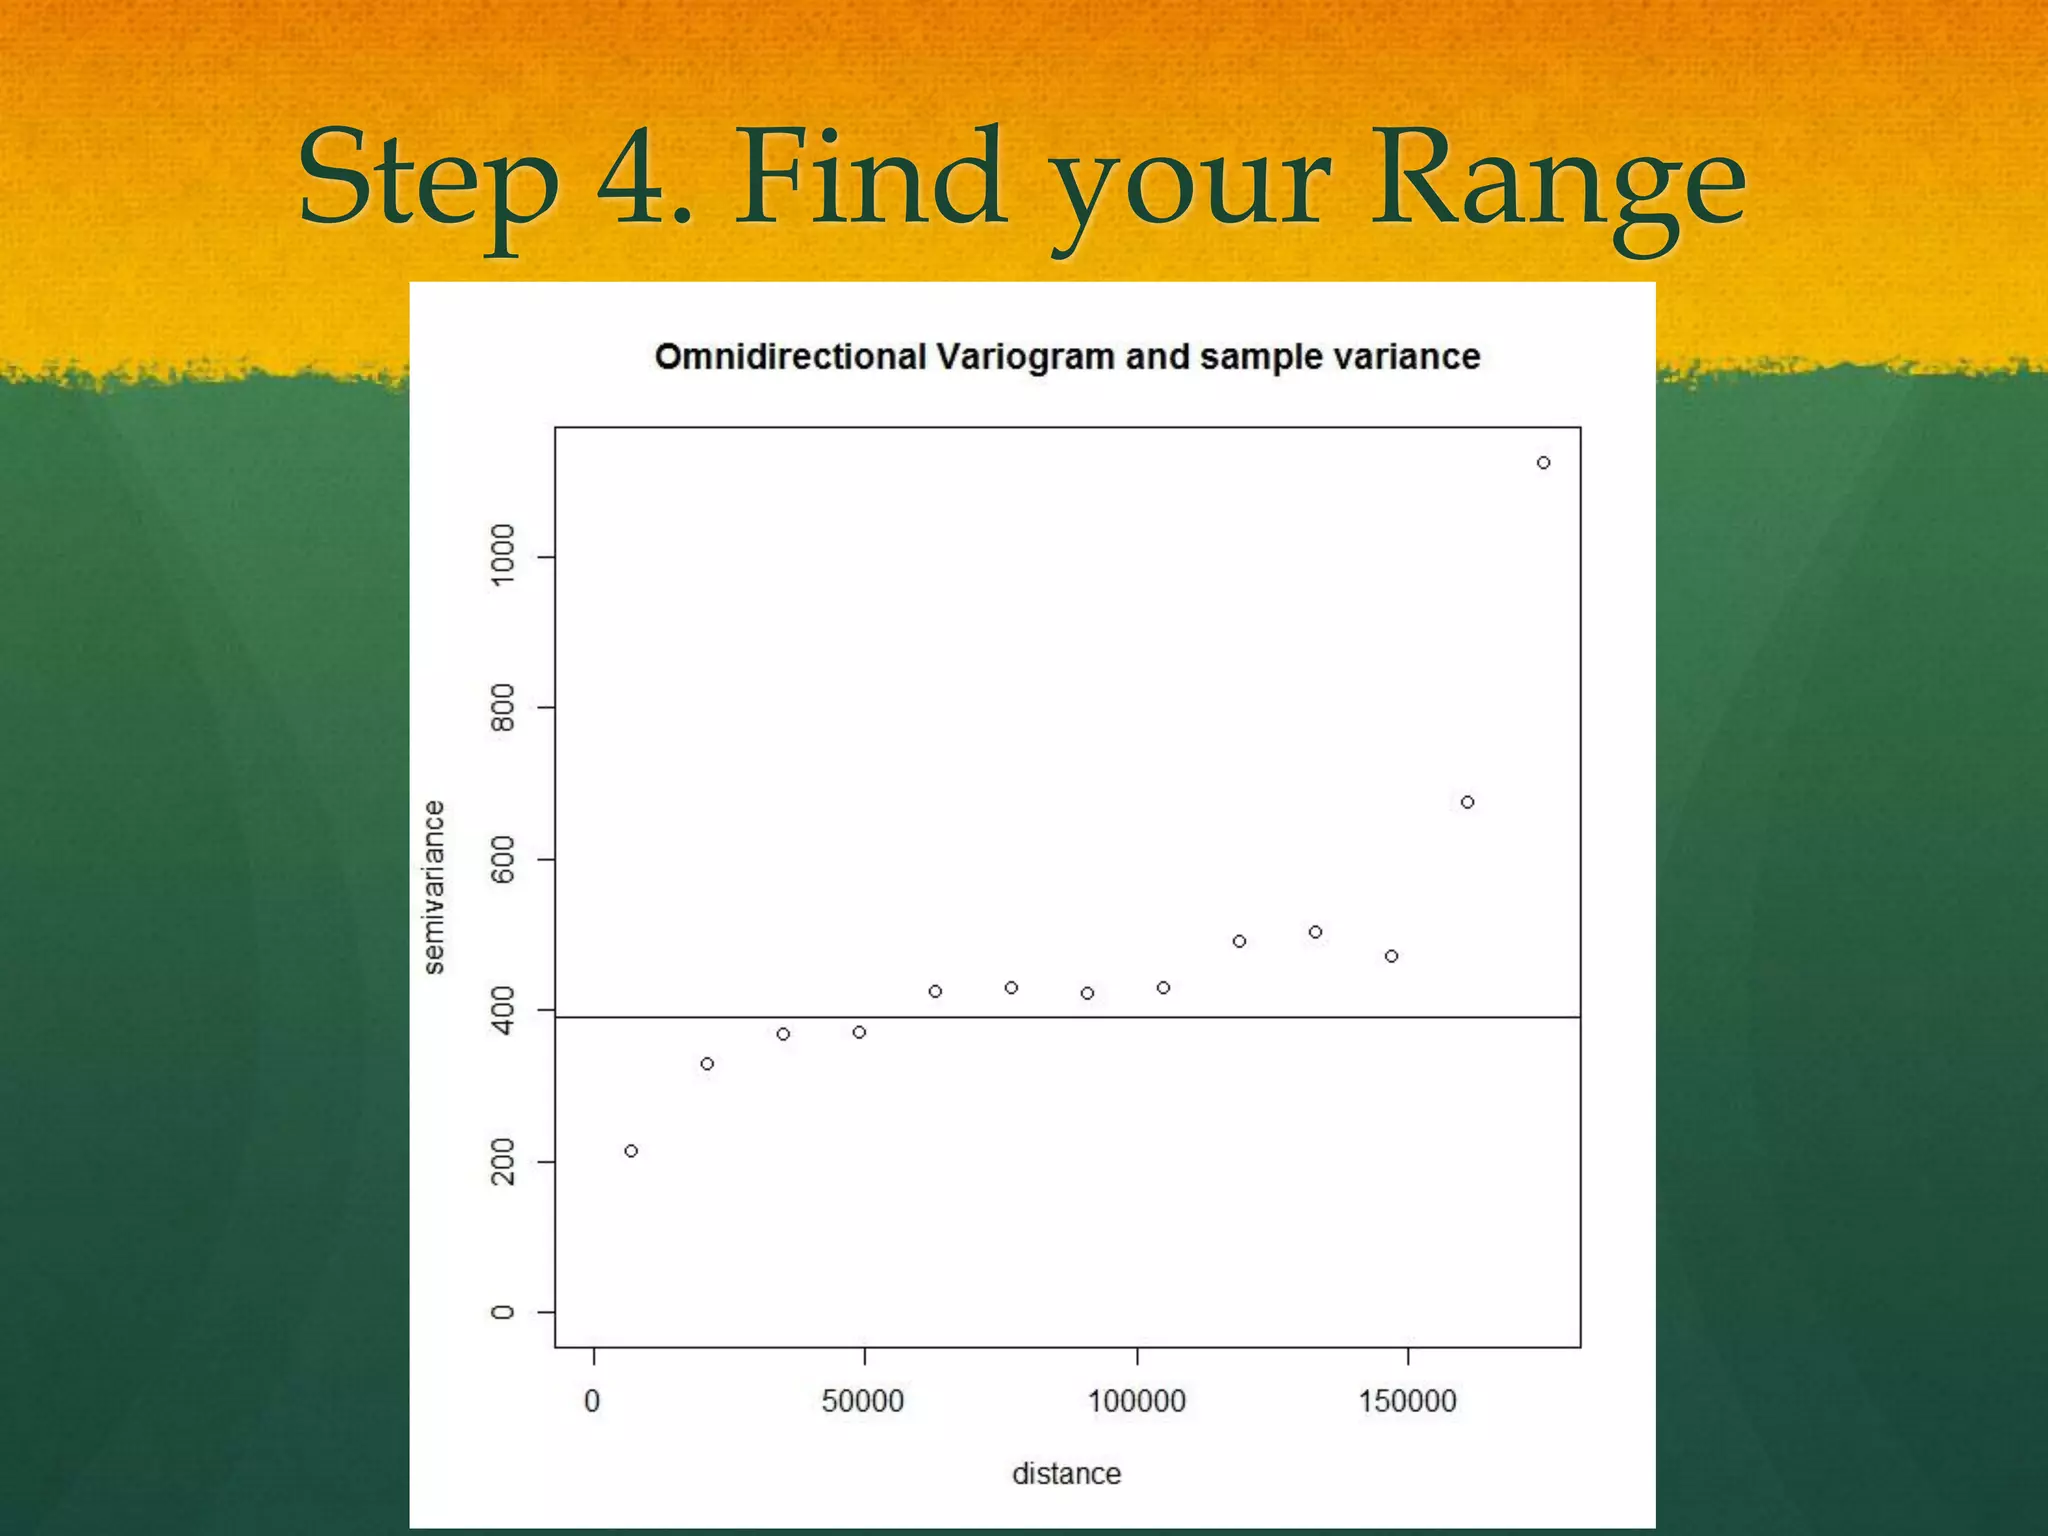
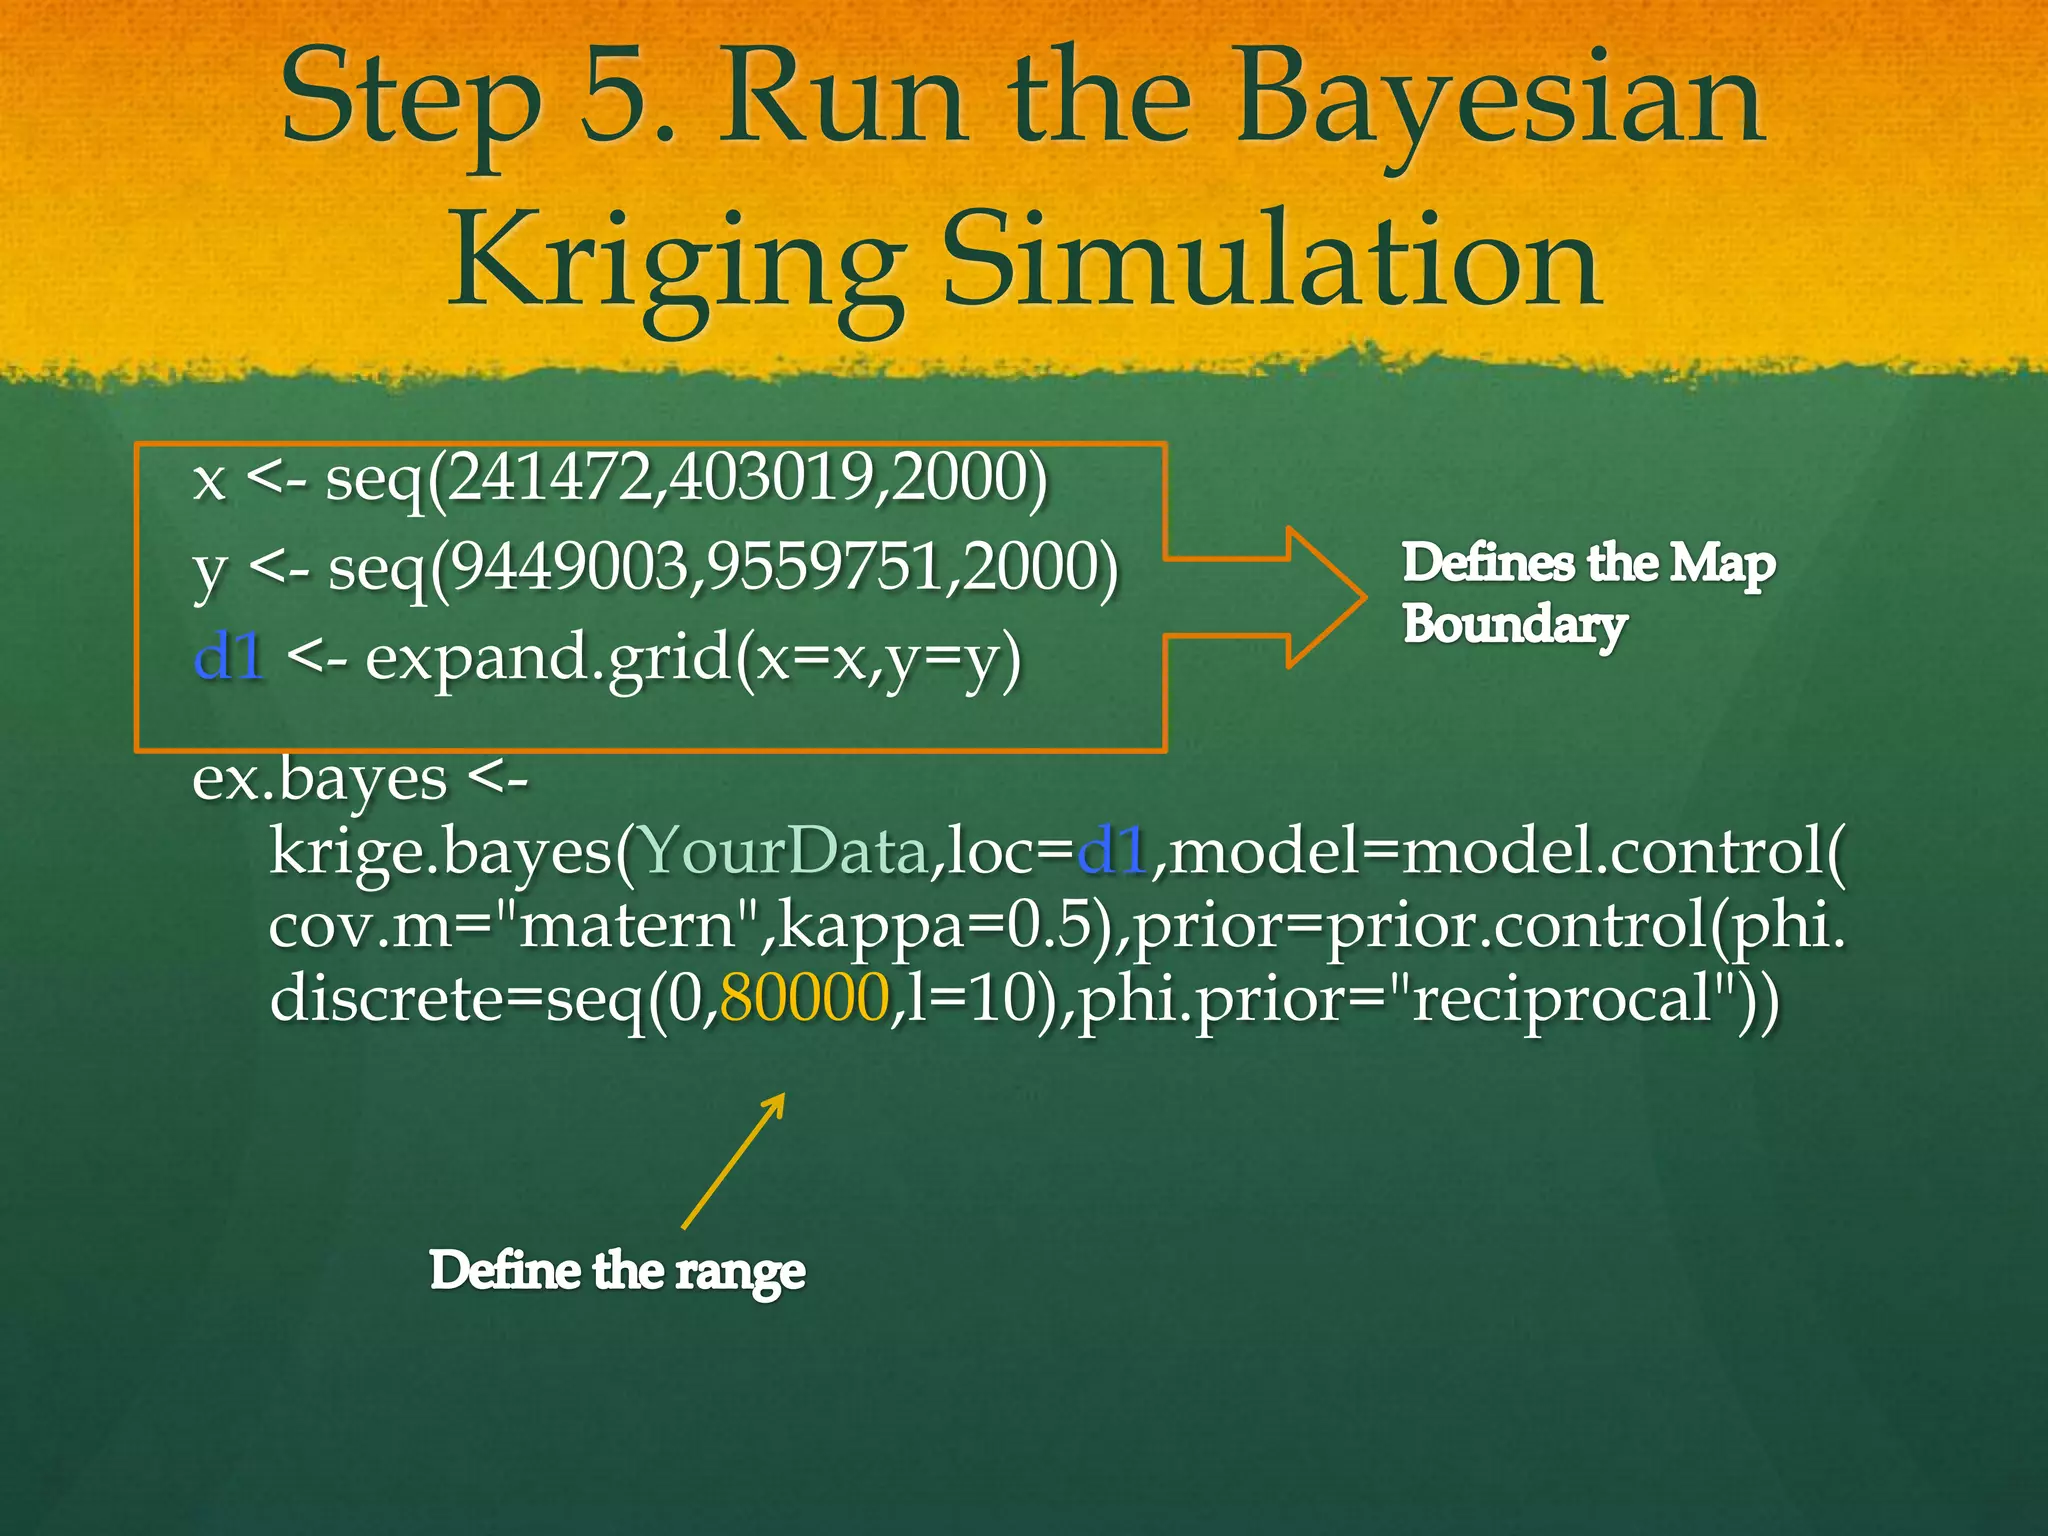
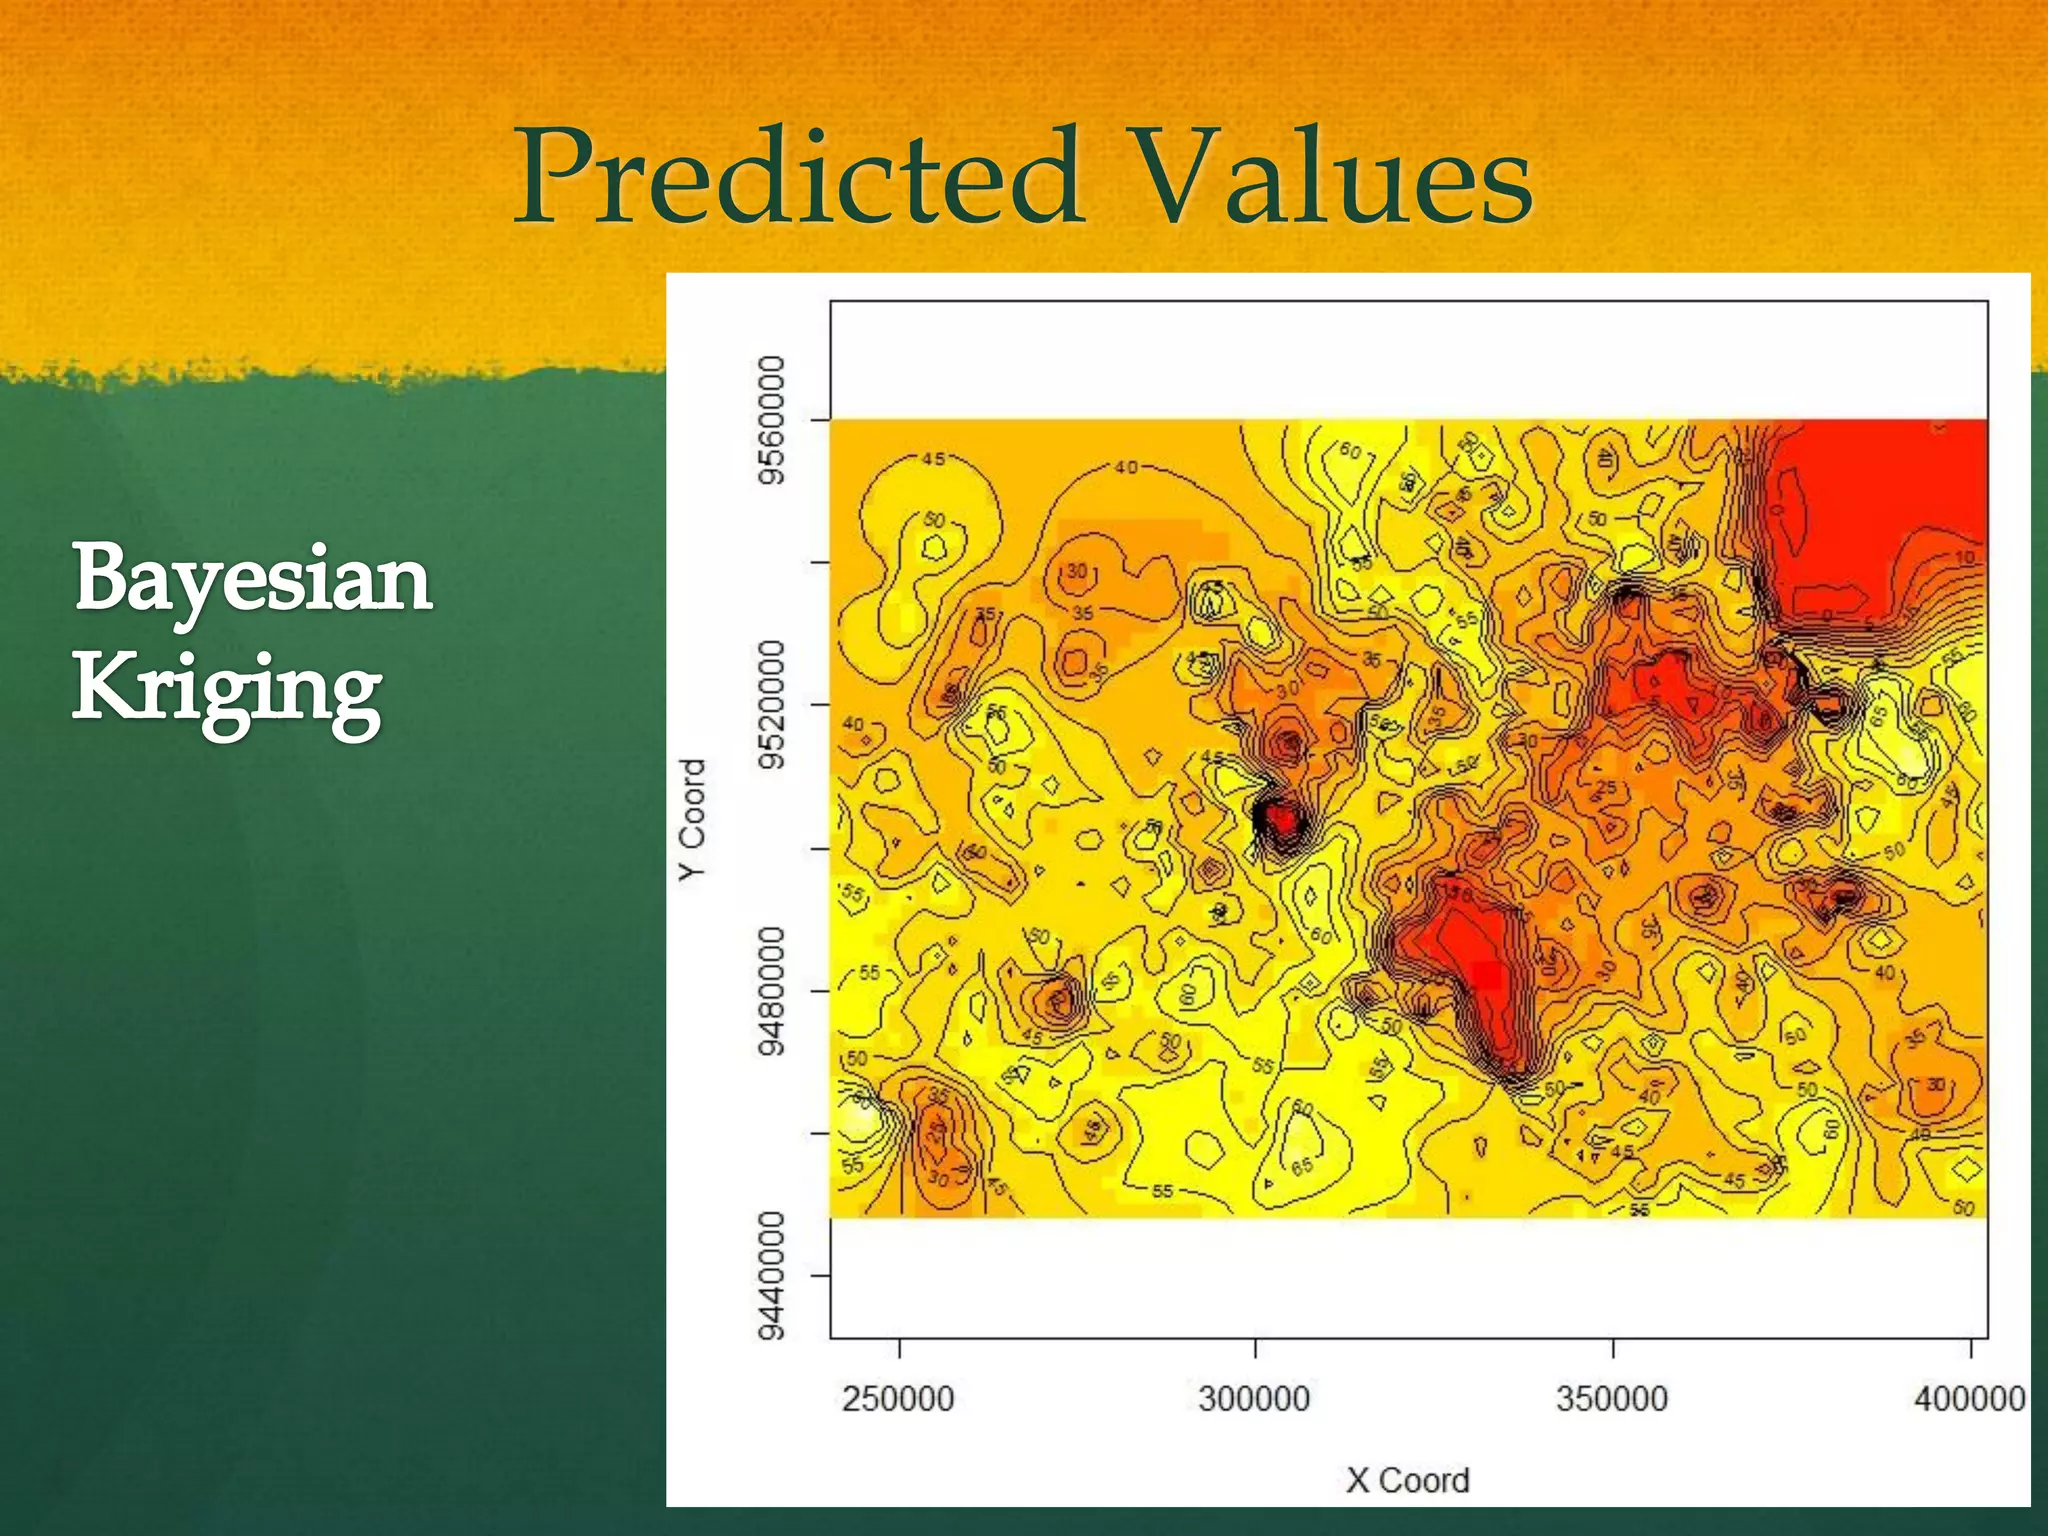
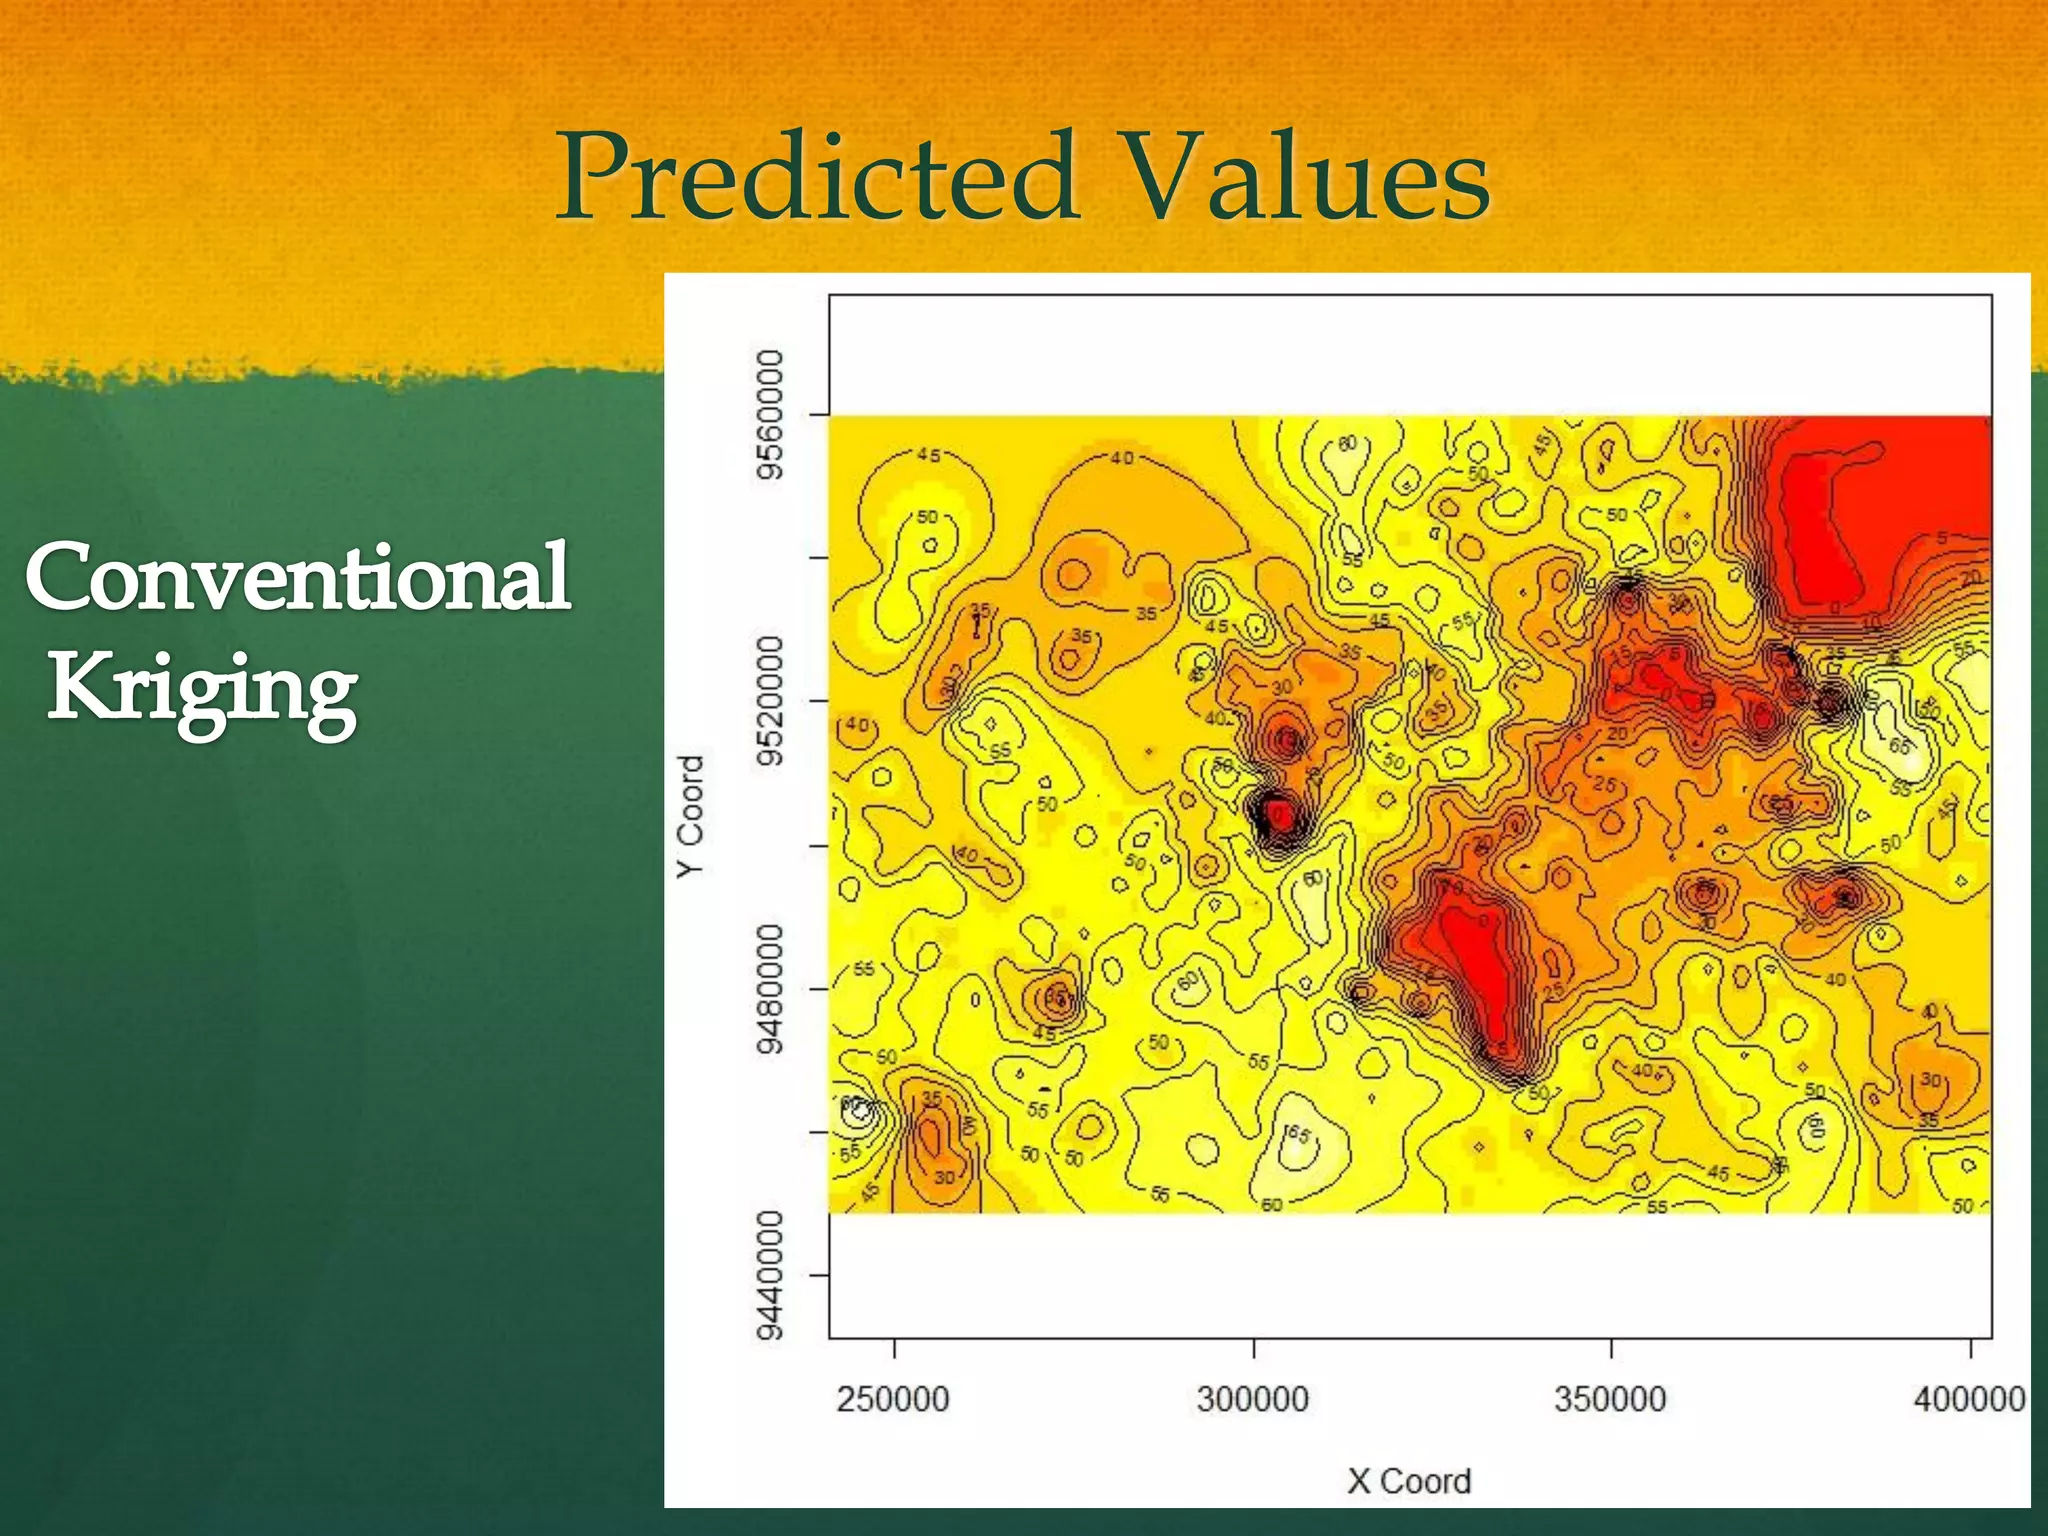
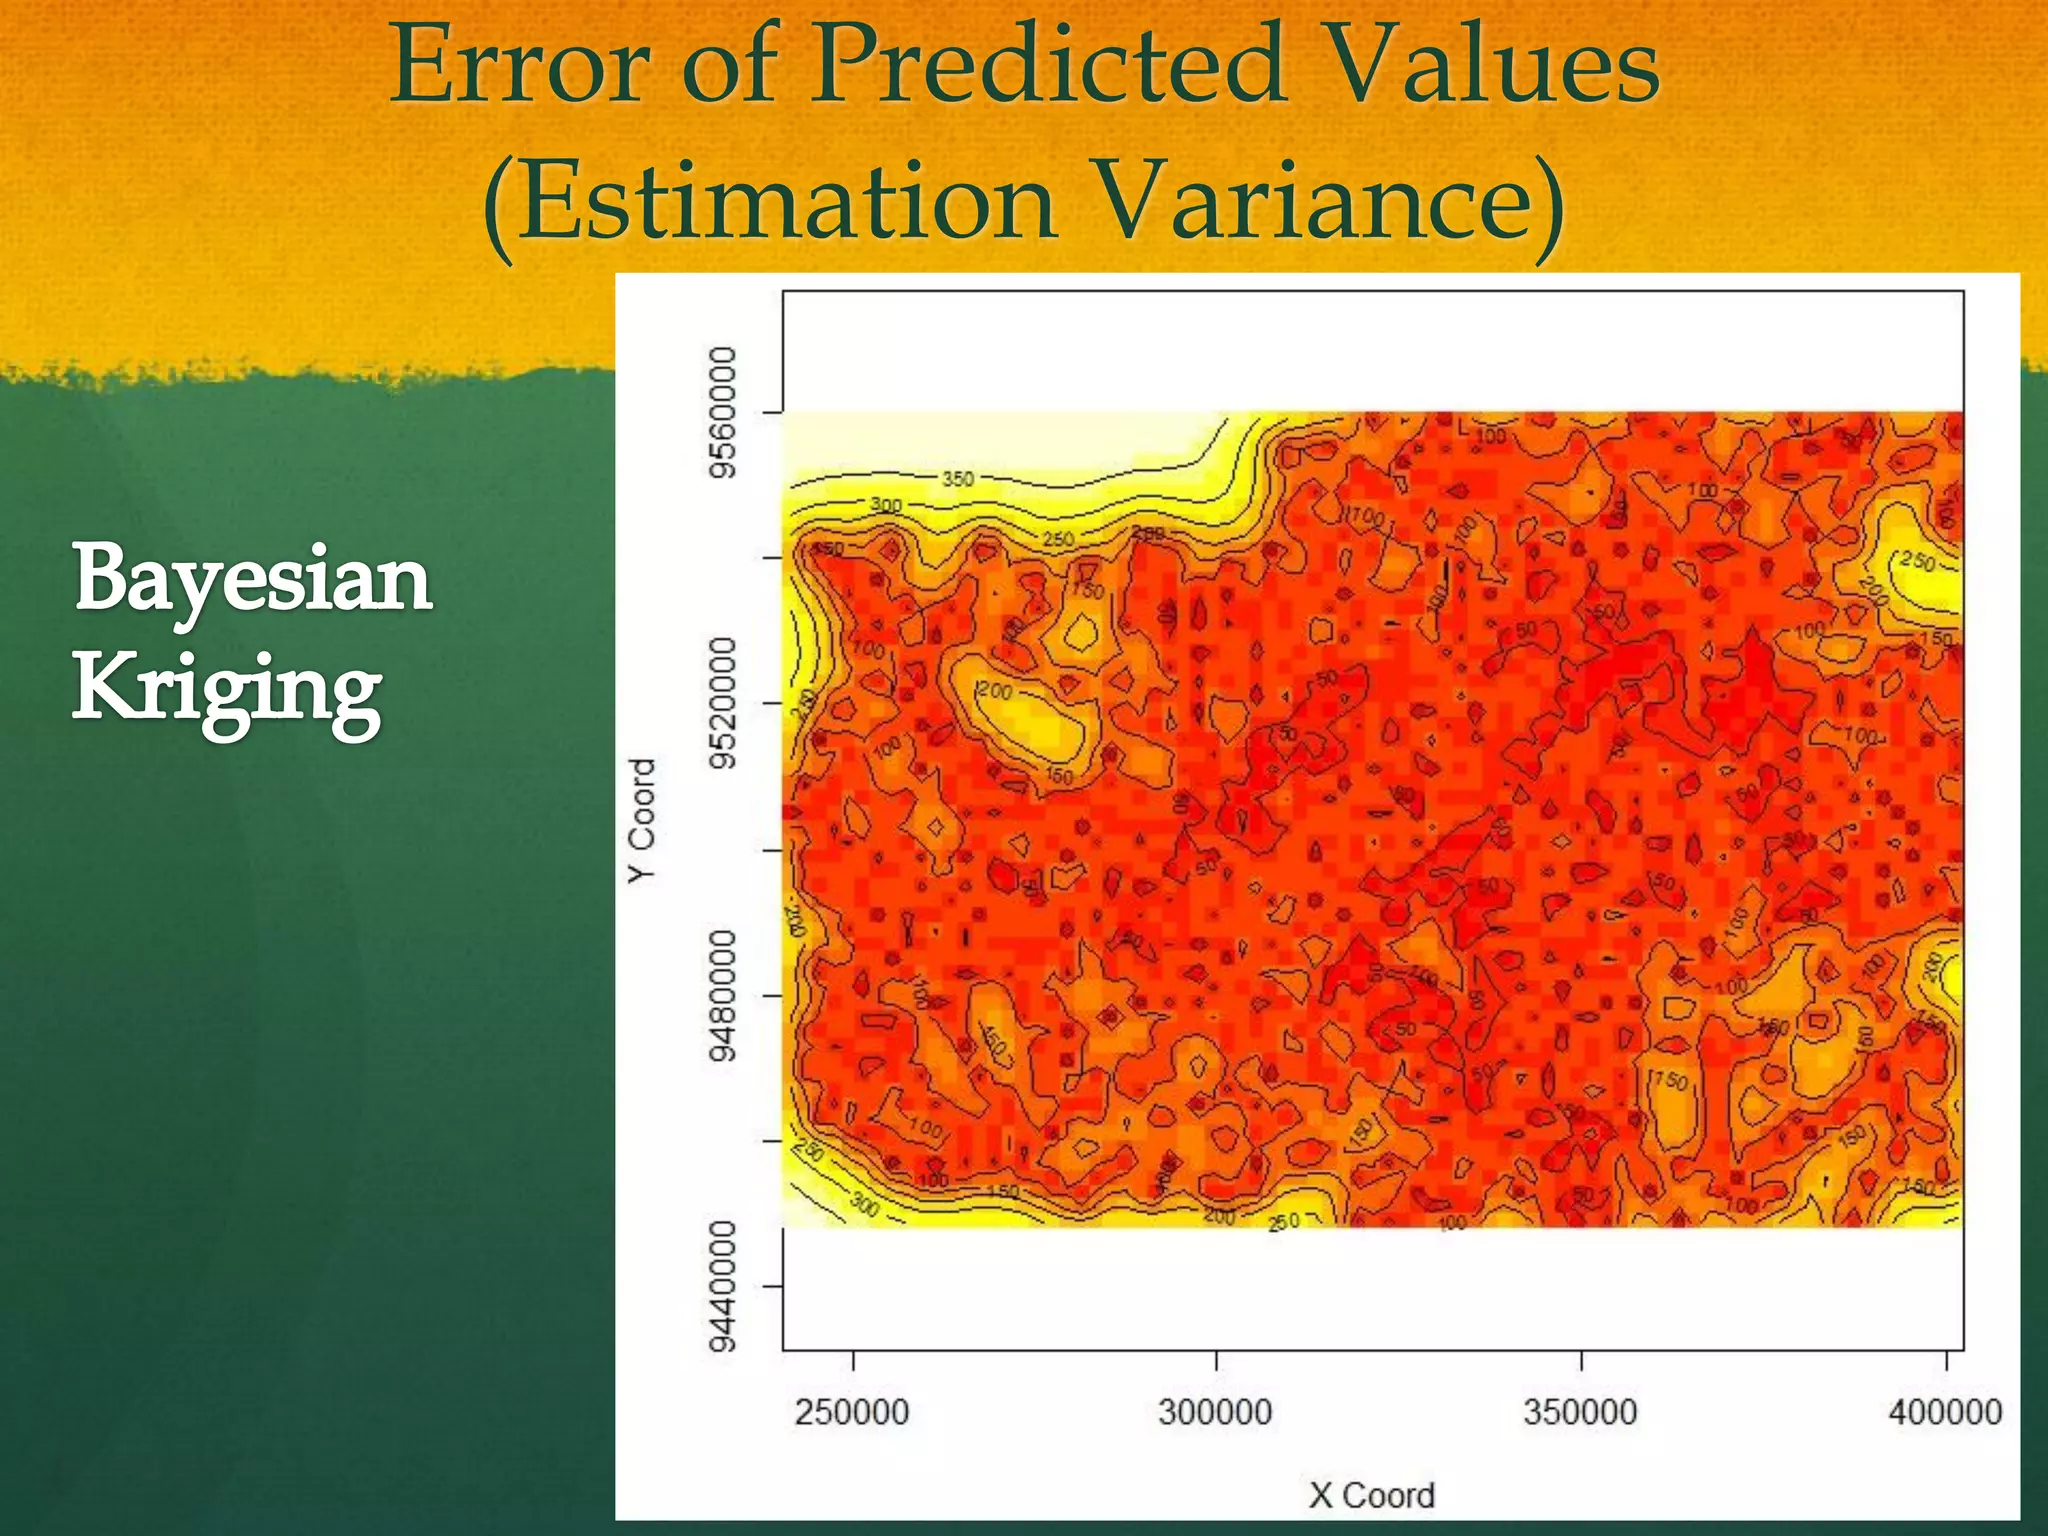
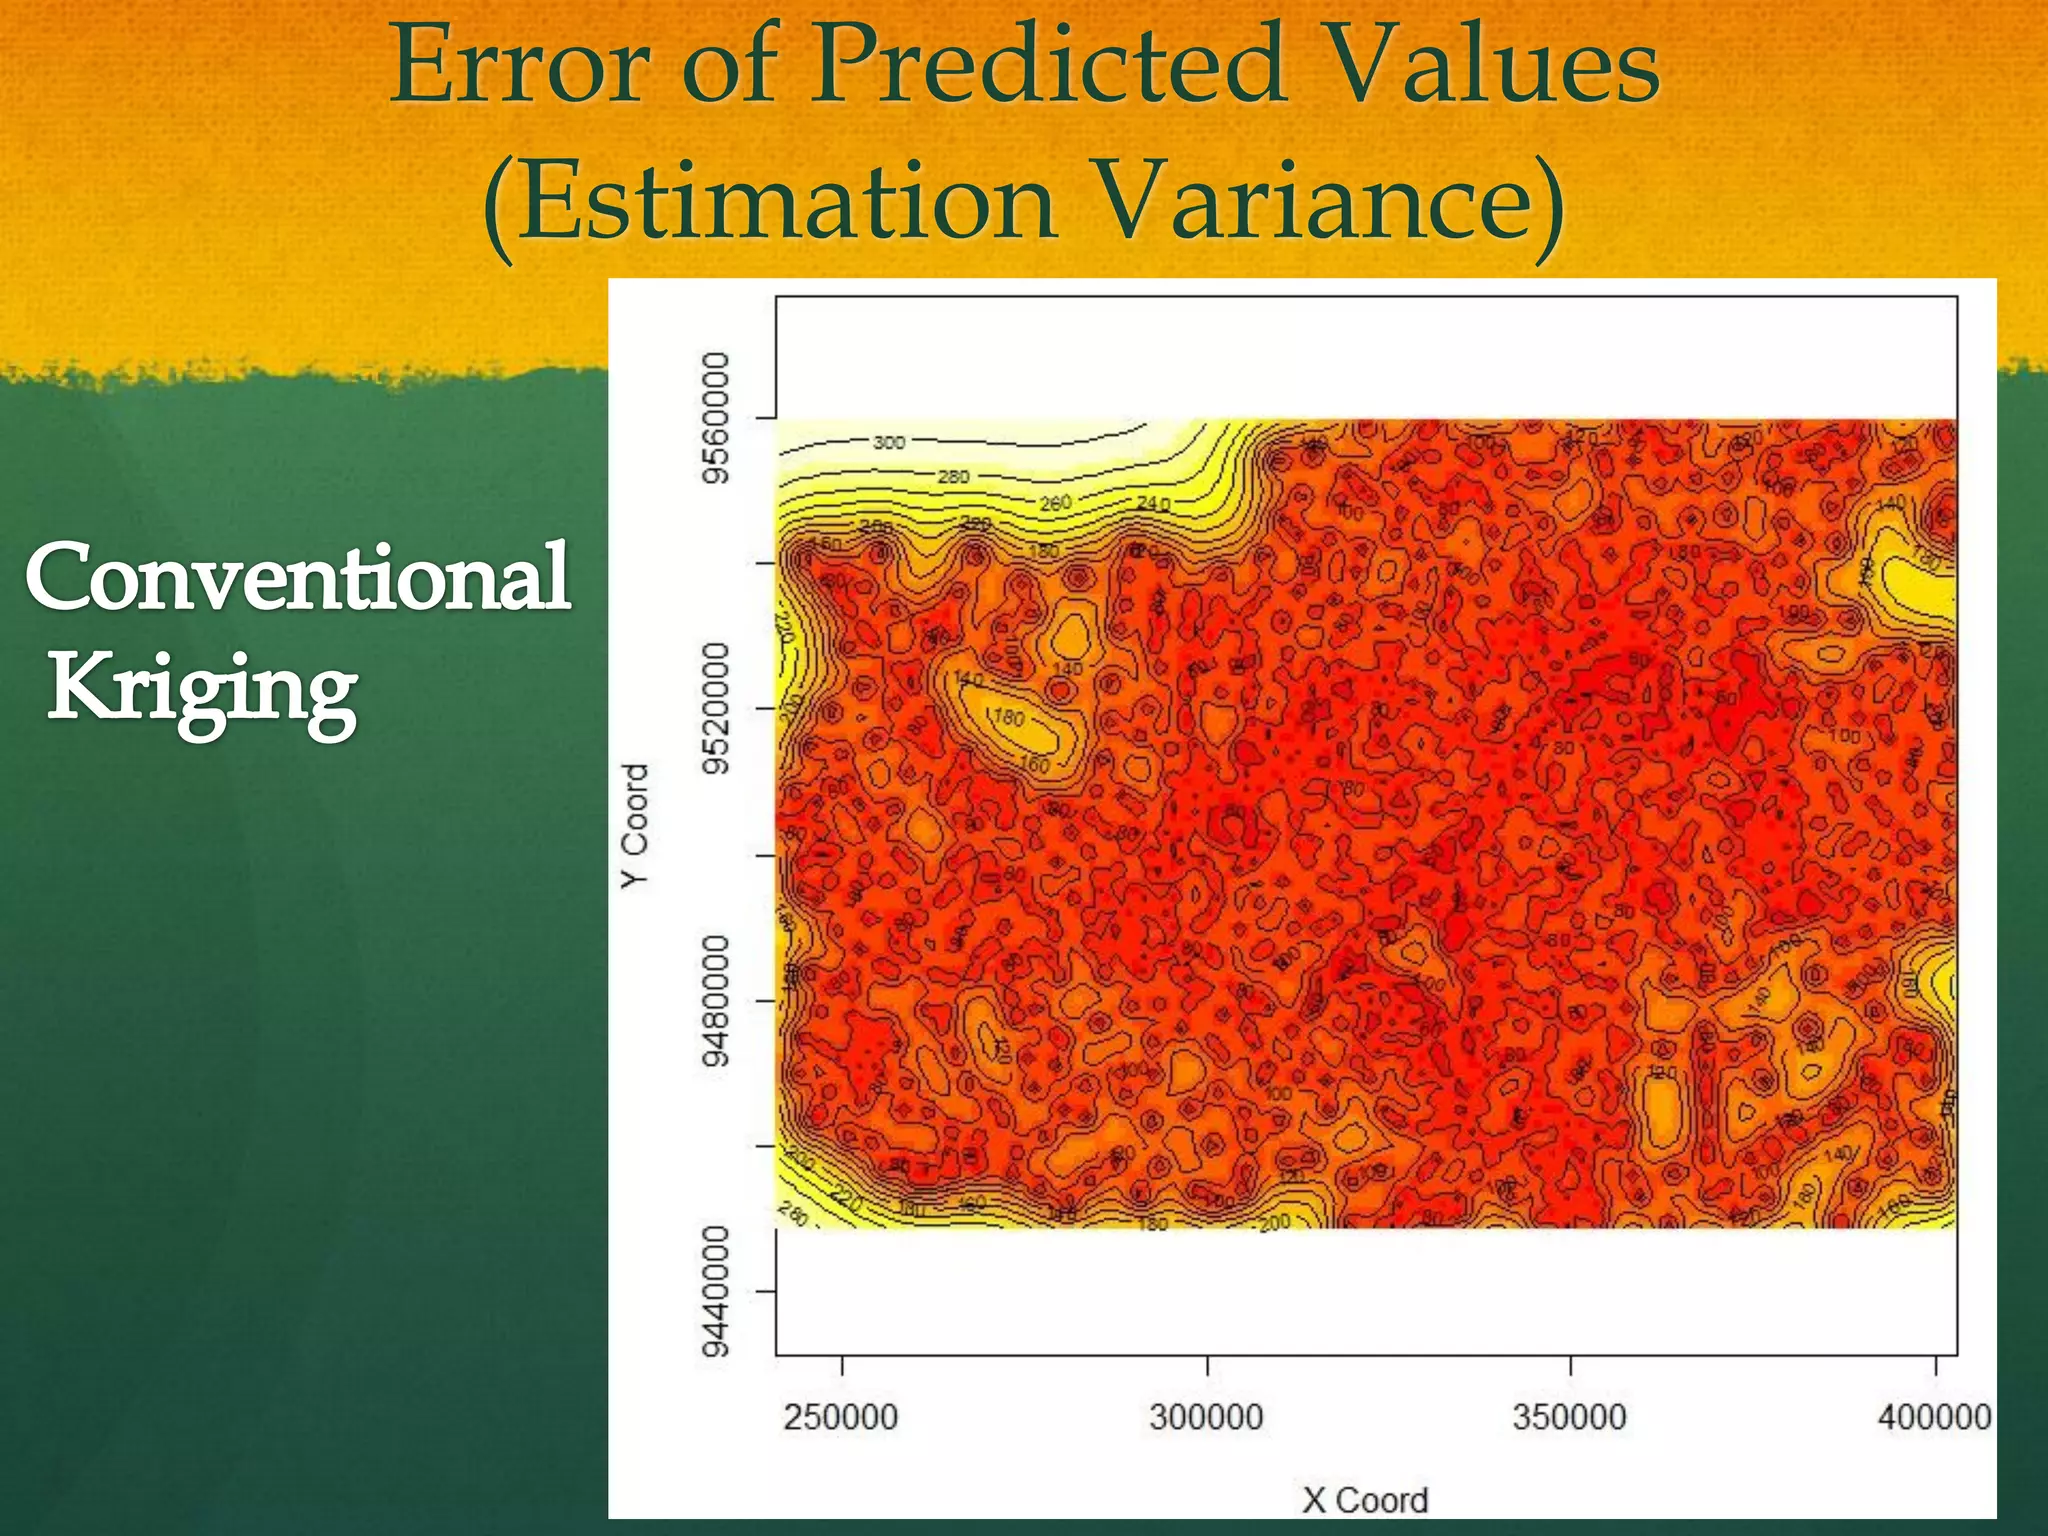
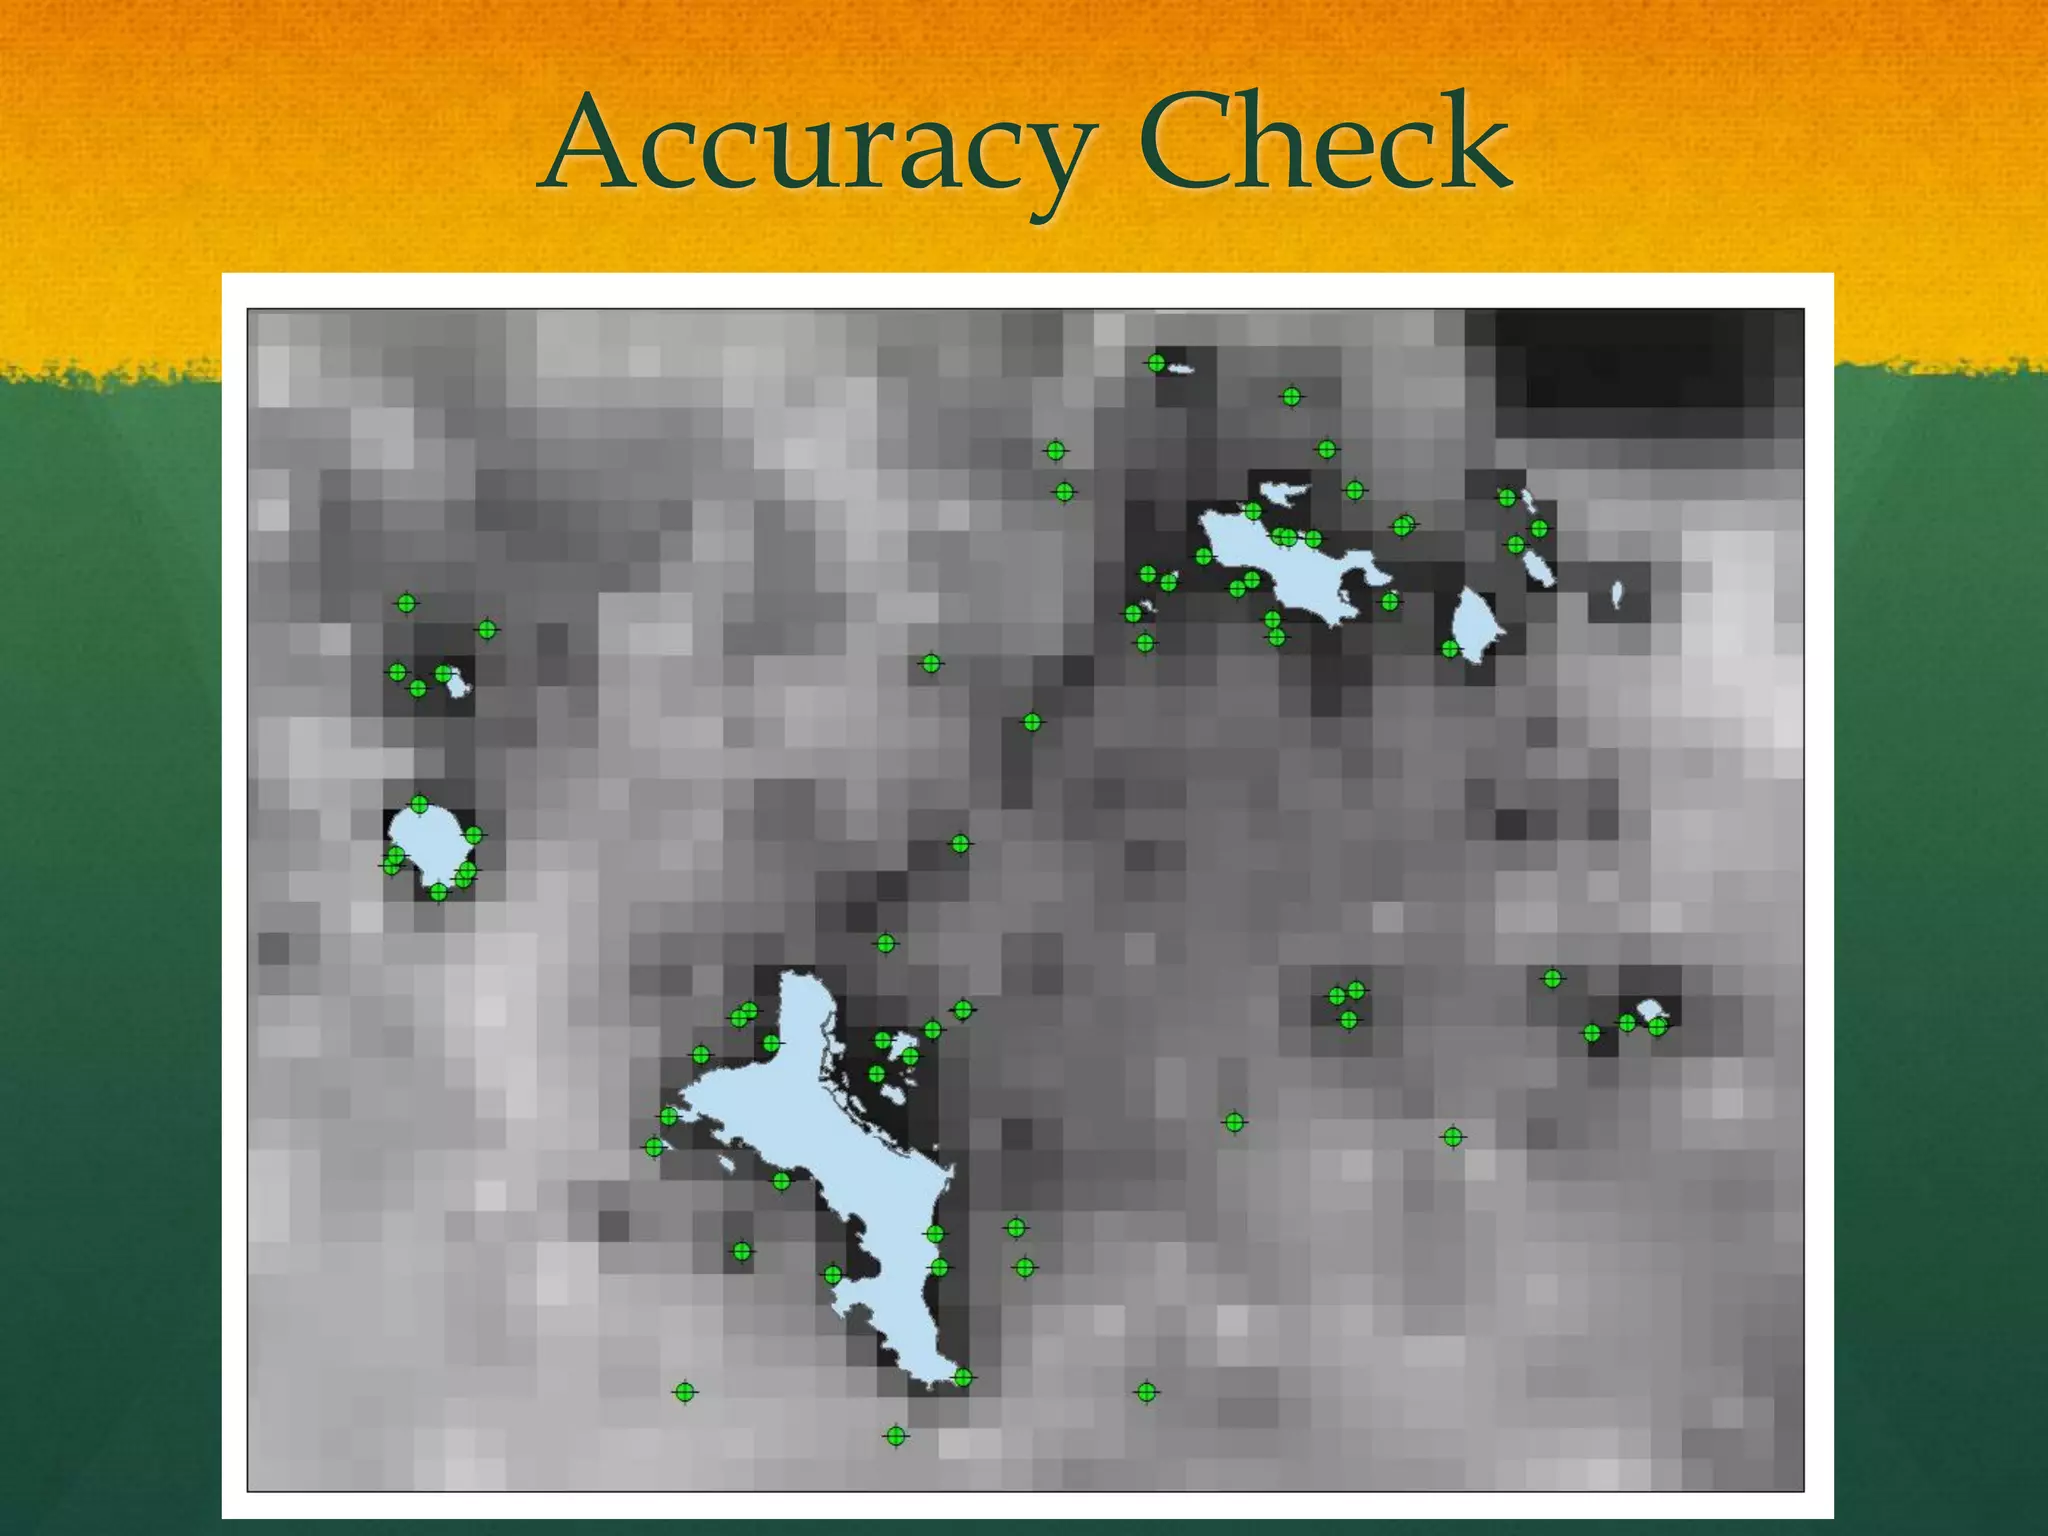
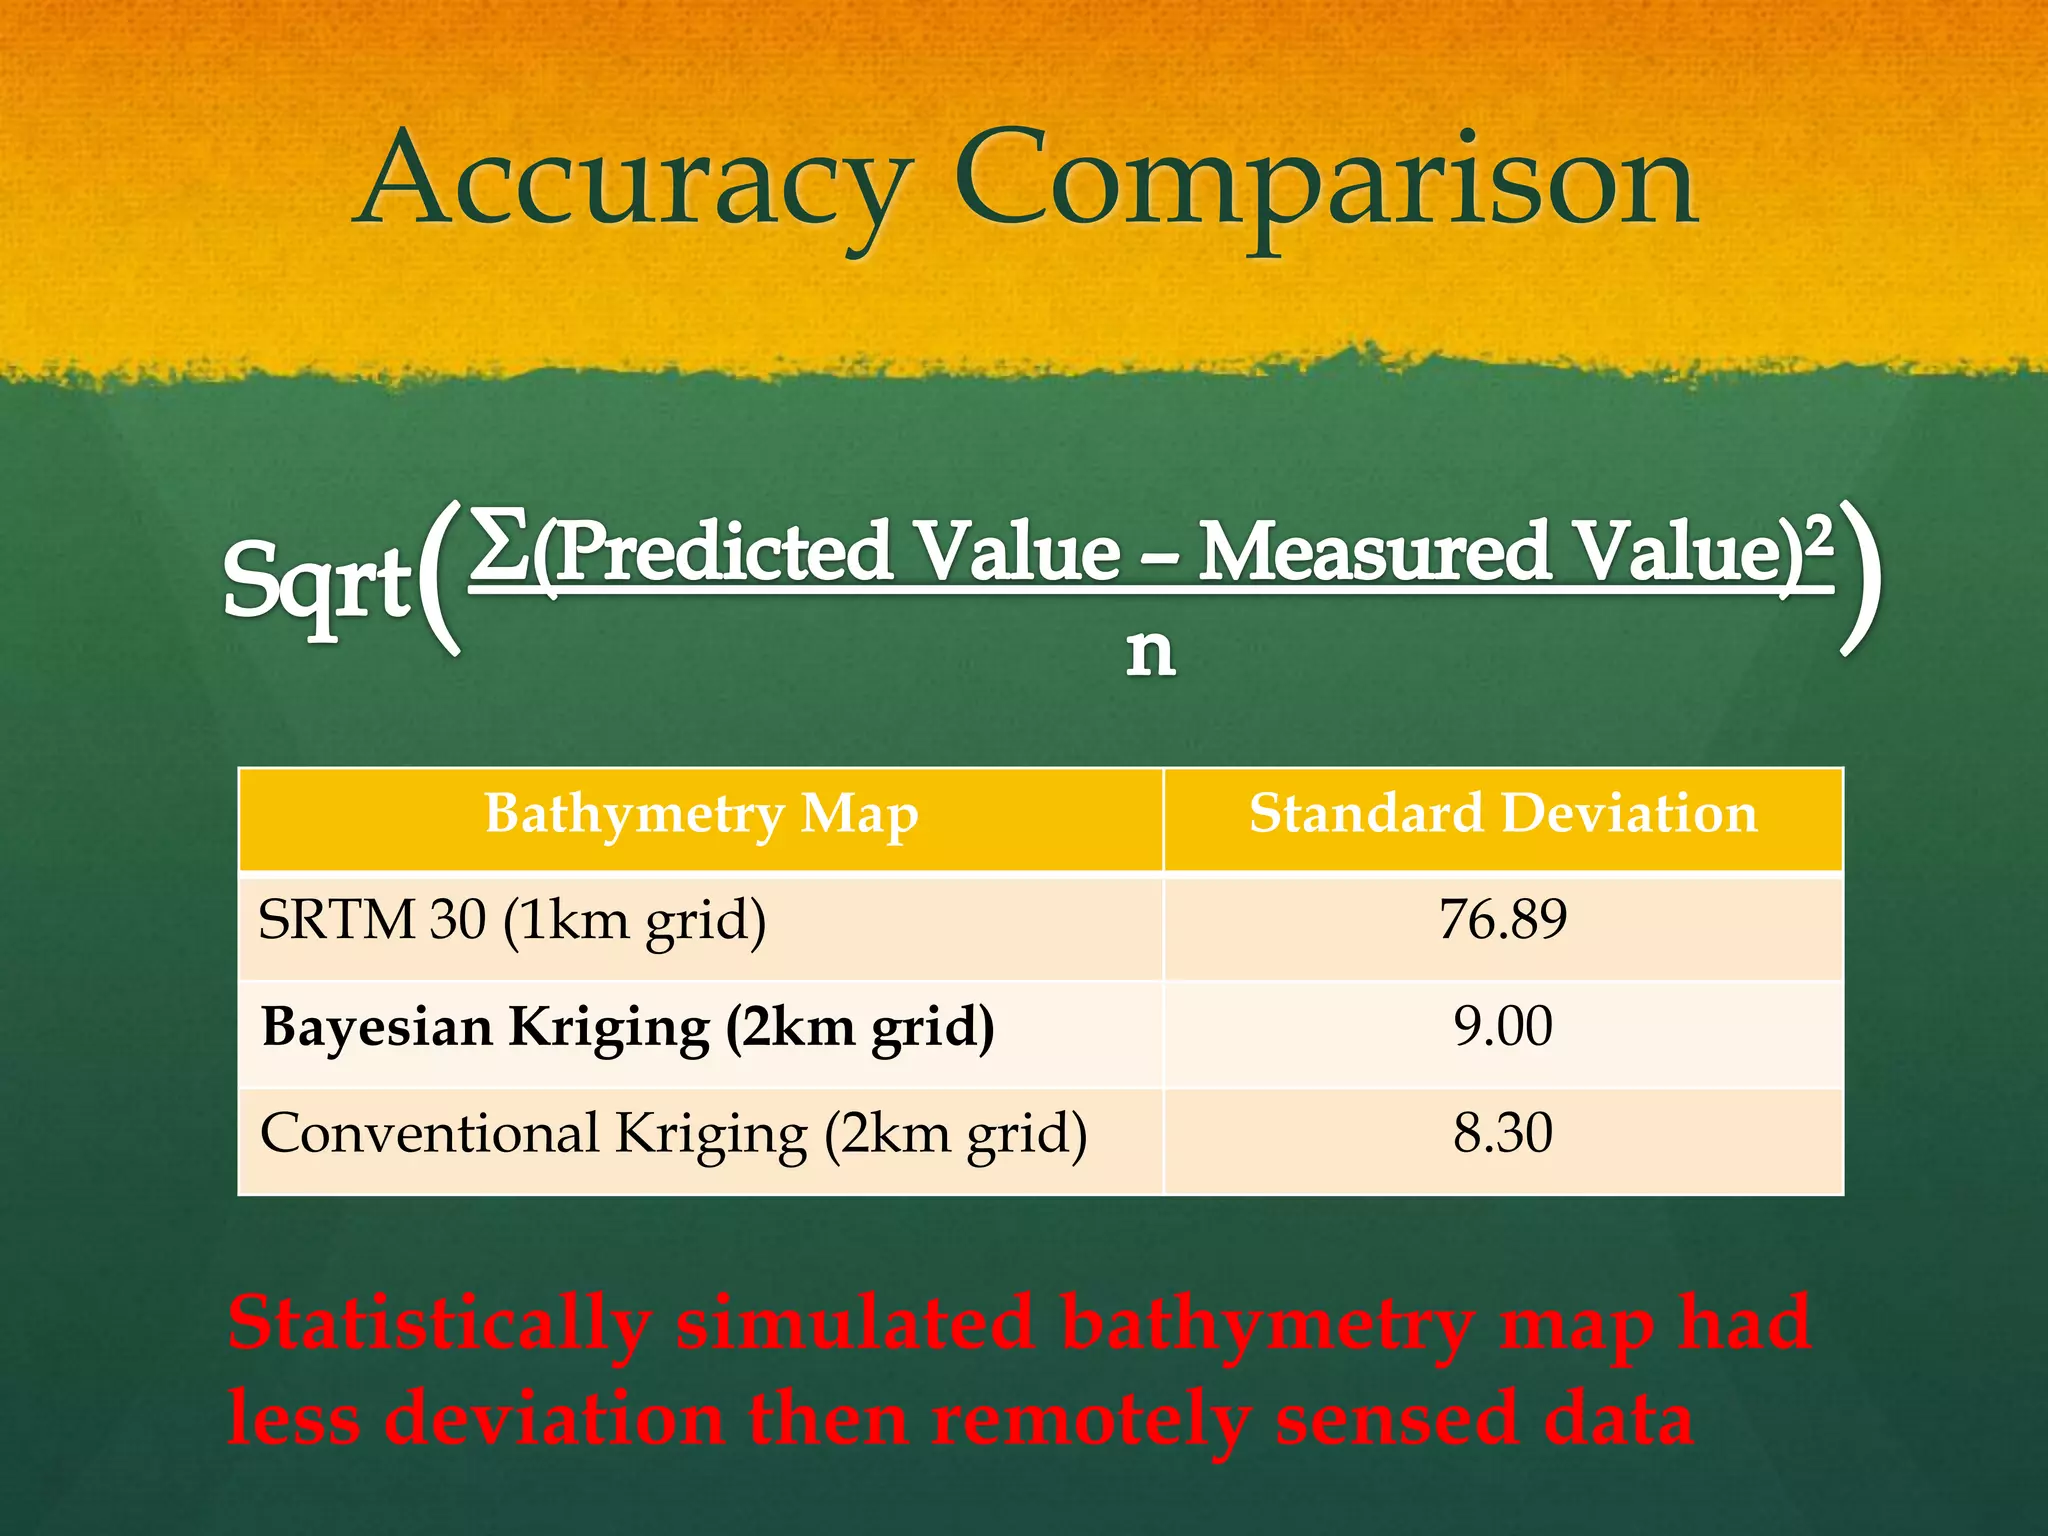
Creating Bathymetry Maps
With Coarse Data -
Bayesian Kriging Using
Open Source Tools
Hal Koike
University of Hawaii,
Hawaii Fisheries Cooperative Research Unit
Why do we need a
       Bathymetry Map?
 Marine resource management is pushed
  toward ecosystem based management (e.g.
  linking with land development, marine
  protected area)
 You need spatial data to fully understand
  the ecosystem of your interest
 Species distribution for marine organisms is
  known to be influenced by depth
Outside the United States…

Most countries do not have a spatial
data repository where bathymetry
data, land cover data, etc. is readily
available to be used for analysis.
If $$ is Limited,
   What are the Options?
 Stick with what you have
 Create a pseudo-bathymetry map
 Some budget friendly data covering the world
 (bathymetry case)
    Navigational chart (low cost)
    MODIS (free)
    Hyperion (free)
Case for Seychelles…
What is available
What I need
Solution


Create a pseudo bathymetry map using
Bayesian Kriging option in GeoR (Rilbeiro jr.,
P.J. and Diggle, P.J. 2001)
What is GeoR?

 Created by Paulo J. Ribeiro Jr. and Peter J.
  Diggle.
 One of the many packages available through
  R-CRAN project
 Operated on R
Step 1. Georectification
Step 2. Enter the Depth Data
What it looks like after
entering all the points
Step 3. Import the Point
     Data to Geo R
Step 4. Find your Range
Step 5. Run the Bayesian
     Kriging Simulation
x <- seq(241472,403019,2000)
y <- seq(9449003,9559751,2000)
d1 <- expand.grid(x=x,y=y)
ex.bayes <-
   krige.bayes(YourData,loc=d1,model=model.control(
   cov.m="matern",kappa=0.5),prior=prior.control(phi.
   discrete=seq(0,80000,l=10),phi.prior="reciprocal"))
Predicted Values
Predicted Values
Error of Predicted Values
 (Estimation Variance)
Error of Predicted Values
 (Estimation Variance)
Accuracy Check
Accuracy Comparison


        Bathymetry Map            Standard Deviation
SRTM 30 (1km grid)                      76.89
Bayesian Kriging (2km grid)              9.00
Conventional Kriging (2km grid)          8.30


Statistically simulated bathymetry map had
less deviation then remotely sensed data
Hawaii Pacific GIS Conference 2012: 3D GIS - Creating Bathymetry Maps with Coarse Data - Bayesian Kriging Using Open Source Tools

Hawaii Pacific GIS Conference 2012: 3D GIS - Creating Bathymetry Maps with Coarse Data - Bayesian Kriging Using Open Source Tools

  • 1.
    Creating Bathymetry Maps WithCoarse Data - Bayesian Kriging Using Open Source Tools Hal Koike University of Hawaii, Hawaii Fisheries Cooperative Research Unit
  • 2.
    Why do weneed a Bathymetry Map?  Marine resource management is pushed toward ecosystem based management (e.g. linking with land development, marine protected area)  You need spatial data to fully understand the ecosystem of your interest  Species distribution for marine organisms is known to be influenced by depth
  • 3.
    Outside the UnitedStates… Most countries do not have a spatial data repository where bathymetry data, land cover data, etc. is readily available to be used for analysis.
  • 4.
    If $$ isLimited, What are the Options?  Stick with what you have  Create a pseudo-bathymetry map Some budget friendly data covering the world (bathymetry case)  Navigational chart (low cost)  MODIS (free)  Hyperion (free)
  • 5.
  • 6.
  • 7.
    Solution Create a pseudobathymetry map using Bayesian Kriging option in GeoR (Rilbeiro jr., P.J. and Diggle, P.J. 2001)
  • 8.
    What is GeoR? Created by Paulo J. Ribeiro Jr. and Peter J. Diggle.  One of the many packages available through R-CRAN project  Operated on R
  • 9.
  • 10.
    Step 2. Enterthe Depth Data
  • 11.
    What it lookslike after entering all the points
  • 12.
    Step 3. Importthe Point Data to Geo R
  • 13.
    Step 4. Findyour Range
  • 14.
    Step 5. Runthe Bayesian Kriging Simulation x <- seq(241472,403019,2000) y <- seq(9449003,9559751,2000) d1 <- expand.grid(x=x,y=y) ex.bayes <- krige.bayes(YourData,loc=d1,model=model.control( cov.m="matern",kappa=0.5),prior=prior.control(phi. discrete=seq(0,80000,l=10),phi.prior="reciprocal"))
  • 16.
  • 17.
  • 18.
    Error of PredictedValues (Estimation Variance)
  • 19.
    Error of PredictedValues (Estimation Variance)
  • 20.
  • 21.
    Accuracy Comparison Bathymetry Map Standard Deviation SRTM 30 (1km grid) 76.89 Bayesian Kriging (2km grid) 9.00 Conventional Kriging (2km grid) 8.30 Statistically simulated bathymetry map had less deviation then remotely sensed data