Download to read offline

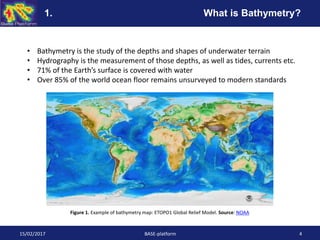

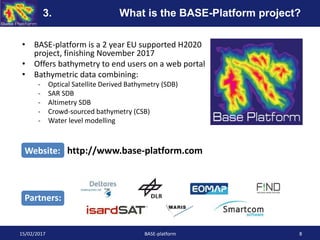
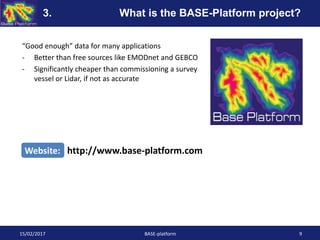
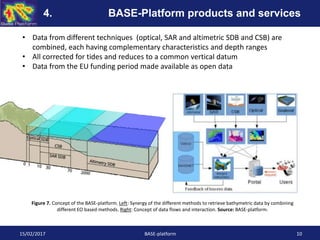
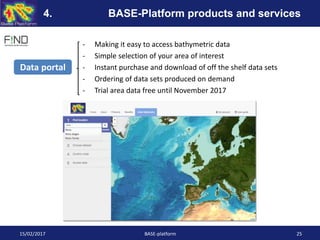
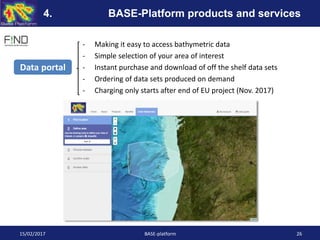
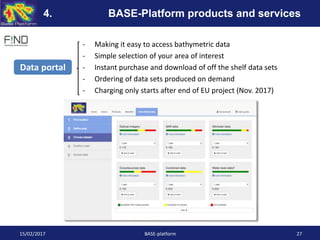
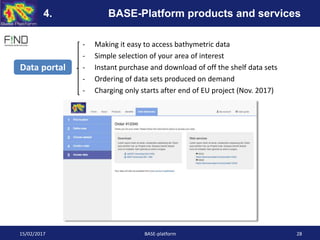

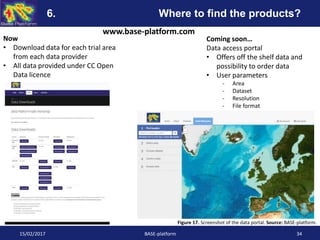

The document discusses the Base-Platform project, which aims to produce bathymetric data by combining various satellite and crowd-sourced methods. Bathymetry is crucial for numerous applications such as navigation, construction, and environmental management, as a significant portion of the ocean floor remains unsurveyed. The project offers accessible data through a web portal, providing users with 'good enough' solutions that are more cost-effective than traditional survey methods while still being precise enough for many applications.


![Polymer [ बहुलक ] Chemistry Notes PDF - Irfanullah Mehar - JJ Sir Chemistry.pdf](https://cdn.slidesharecdn.com/ss_thumbnails/polymerchemistrynotespdf-irfanullahmehar-jjsirchemistry-260210172118-3f9b37f7-thumbnail.jpg?width=640&height=640&fit=bounds)


