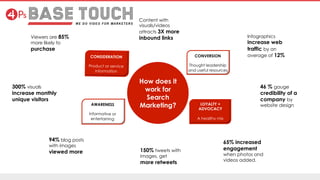
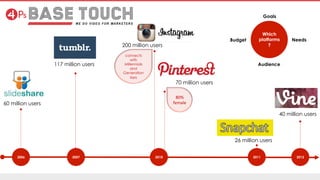
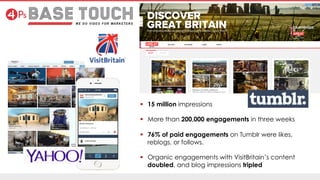
Harnessing the power of visual marketing for search
How does it work for search marketing?
Great examples…
Social media and visual marketing
Visit Britain case study
Why use visual marketing as part of your
strategy?
What is visual marketing and where to use it?
Defining your goals and ROI
Know your audience
Technology
2015 and beyond…
CONTENT IS AN
EXPERIENCE, NOT
JUST WORDS
What is
Visual
Marketing?
Product
pages
Where to
use it?
Social
Media
Ebooks
& white
papers
Emails &
newsletters
Website
/blog
Online and
offline
advertising
How does it
work for
Search
Marketing?AWARENESS
Informative or
entertaining
CONSIDERATION
Product or service
information
CONVERSION
Thought leadership
and useful resources
LOYALTY +
ADVOCACY
A healthy mix
65% increased
engagement
when photos and
videos added.
300% visuals
increase monthly
unique visitors
94% blog posts
with images
viewed more 150% tweets with
images, get
more retweets
Viewers are 85%
more likely to
purchase
46 % gauge
credibility of a
company by
website design
Infographics
increase web
traffic by an
average of 12%
Content with
visuals/videos
attracts 3X more
inbound links
Which
platforms
?
60 million users
117 million users
200 million users
70 million users
26 million users
40 million users
2006 2007 2010 2011 2012
Budget
Goals
Needs
Audience
connects
with
Millennials
and
Generation
Xers
80%	
  
female	
  
  15 million impressions
  More than 200,000 engagements in three weeks
  76% of paid engagements on Tumblr were likes,
reblogs, or follows.
  Organic engagements with VisitBritain’s content
doubled, and blog impressions tripled
No point doing visual marketing just for the sake of it.
What is the true picture?
It’s a collaborative effort to
score
What does the goal look like?
What are your aims?
Leaning back vs. leaning in.
Engaging your online audience
The platform dictates the format and style
Brand Focused or Customer Focused
Understand the sets of eyes
THE FLEXIBILITY OF VIDEO
How should you measure your ROI in visual marketing?
•  Objectives!
•  Time on Page/Completion Rate
•  Inbound links
Time on page/completion Rate:
The longer a consumer spends watching a video,
scanning through photos or interacting with your
content, the closer you are to forming a bond.
Metrics such as time on page and completion
rate help track this engagement. But new, more
refined metrics such as page scroll and article
completion offer more insight.
Visitors engaged with rich media are more likely to
share with peers.
 
DEFINE YOUR OBJECTIVES…
2005 2007 2010 2014
TECHNOLOGY ENABLES USERS
TO CREATE RICHER CONTENT…
Instead of more… think better
As well as text… think simple drawings, infographs and video
Instead of product-centric… think insights and value
Instead of vendor-developed… think 3rd party credibility
 
2015 AND BEYOND…
Questions?

Harnessing the power of visual marketing for search

  • 1.
    Harnessing the powerof visual marketing for search
  • 2.
    How does itwork for search marketing? Great examples… Social media and visual marketing Visit Britain case study Why use visual marketing as part of your strategy? What is visual marketing and where to use it? Defining your goals and ROI Know your audience Technology 2015 and beyond…
  • 3.
    CONTENT IS AN EXPERIENCE,NOT JUST WORDS What is Visual Marketing?
  • 4.
    Product pages Where to use it? Social Media Ebooks &white papers Emails & newsletters Website /blog Online and offline advertising
  • 5.
    How does it workfor Search Marketing?AWARENESS Informative or entertaining CONSIDERATION Product or service information CONVERSION Thought leadership and useful resources LOYALTY + ADVOCACY A healthy mix 65% increased engagement when photos and videos added. 300% visuals increase monthly unique visitors 94% blog posts with images viewed more 150% tweets with images, get more retweets Viewers are 85% more likely to purchase 46 % gauge credibility of a company by website design Infographics increase web traffic by an average of 12% Content with visuals/videos attracts 3X more inbound links
  • 12.
    Which platforms ? 60 million users 117million users 200 million users 70 million users 26 million users 40 million users 2006 2007 2010 2011 2012 Budget Goals Needs Audience connects with Millennials and Generation Xers 80%   female  
  • 13.
      15 millionimpressions   More than 200,000 engagements in three weeks   76% of paid engagements on Tumblr were likes, reblogs, or follows.   Organic engagements with VisitBritain’s content doubled, and blog impressions tripled
  • 14.
    No point doingvisual marketing just for the sake of it. What is the true picture? It’s a collaborative effort to score What does the goal look like? What are your aims?
  • 17.
    Leaning back vs.leaning in. Engaging your online audience The platform dictates the format and style Brand Focused or Customer Focused Understand the sets of eyes
  • 18.
  • 20.
    How should youmeasure your ROI in visual marketing? •  Objectives! •  Time on Page/Completion Rate •  Inbound links
  • 21.
    Time on page/completionRate: The longer a consumer spends watching a video, scanning through photos or interacting with your content, the closer you are to forming a bond. Metrics such as time on page and completion rate help track this engagement. But new, more refined metrics such as page scroll and article completion offer more insight. Visitors engaged with rich media are more likely to share with peers.   DEFINE YOUR OBJECTIVES…
  • 22.
    2005 2007 20102014 TECHNOLOGY ENABLES USERS TO CREATE RICHER CONTENT…
  • 23.
    Instead of more…think better As well as text… think simple drawings, infographs and video Instead of product-centric… think insights and value Instead of vendor-developed… think 3rd party credibility   2015 AND BEYOND…
  • 24.