Download as PDF, PPTX


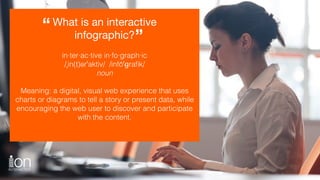


This document outlines the creation and benefits of interactive infographics, which are digital visual experiences that present data while engaging users. It provides best practices for effectiveness, including clear calls to action, structured content, and interactive elements. Additionally, it showcases success stories from various organizations that improved engagement and conversion rates through the use of interactive content.


![[SlideShare] The Blueprint to B2B Content Metrics](https://cdn.slidesharecdn.com/ss_thumbnails/the-blueprint-to-b2b-content-metrics-final-150713164650-lva1-app6892-thumbnail.jpg?width=640&height=640&fit=bounds)


