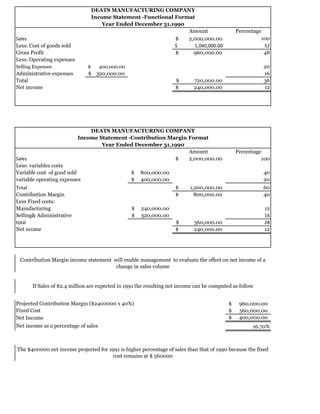
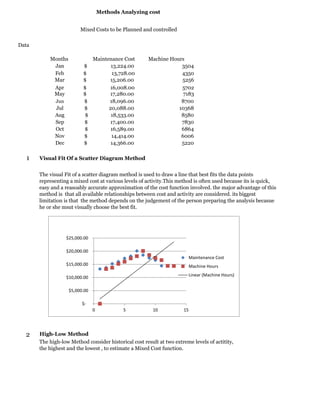
Income statement Functional Format,Linear cost Function,Method of Analyzing cost,Comparison of variable costing , unit cost computation, Illustration of variable costing , evaluation of results. Managerial Accounting
Kenya Coconut Production Presentation by Dr. Lalith Perera
Cost behavior and contribution margin reporting
1. Amount Percentage
Sales 2,000,000.00$ 100
Less: Cost of goods sold 1,040,000.00$ 52
Gross Profit 960,000.00$ 48
Less: Operating expenses
Selling Expenses 400,000.00$ 20
Administrative expenses 320,000.00$ 16
Total 720,000.00$ 36
Net income 240,000.00$ 12
Amount Percentage
Sales 2,000,000.00$ 100
Less: variables costs
Variable cost of good sold 800,000.00$ 40
variable operating expenses 400,000.00$ 20
Total 1,200,000.00$ 60
Contribution Margin 800,000.00$ 40
Less Fixed costs:
Manufacturing 240,000.00$ 12
Selling& Administrative 320,000.00$ 16
total 560,000.00$ 28
Net ncome 240,000.00$ 12
960,000.00$
560,000.00$
Net Income 400,000.00$
16.70%
DEATS MANUFACTURING COMPANY
Income Statement -Functional Format
Year Ended December 31,1990
The $400000 net income projected for 1991 is higher percentage of sales than that of 1990 because the fixed
cost remains at $ 560000
Projected Contribution Margin ($2400000 x 40%)
Fixed Cost
Net income as a percentage of sales
DEATS MANUFACTURING COMPANY
Income Statement -Contribution Margin Format
Year Ended December 31,1990
Contribution Margin income statement will enable management to evaluate the effect on net income of a
change in sales volume
If Sales of $2.4 million are expected in 1991 the resulting net income can be computed as follow
2. y= a + bx
y=
a=
b=
x=
the total cost as a dependent variable
the fixed cost portion of the total cost (aslo called the y intercept because it is
the point where a linear cost function that is graphed touches the vertical axis .
the variable cost rate that is the slop (rate of change) of the linear cost function
the measure of the activity or volume as an independent variable , Examples
are sales dollar, unit produced, and direct labour hours
Importance of Linear cost Functions
Linear cost function is a close approxiamtion of the real cost function and its accurate
enough for the estimates needed to project the future with all its uncertainties
A liner Cost Function is expressed in the form of a linear equation as follows
3. Data
Months Maintenance Cost Machine Hours
Jan 13,224.00$ 3504
Feb $ 13,728.00 4350
Mar $ 15,206.00 5256
Apr $ 16,008.00 5702
May $ 17,280.00 7183
Jun 18,096.00$ 8700
Jul 20,088.00$ 10368
Aug 18,533.00$ 8580
Sep 17,400.00$ 7830
Oct 16,589.00$ 6864
Nov 14,414.00$ 6006
Dec 14,366.00$ 5220
1
2 High-Low Method
The high-low Method consider historical cost result at two extreme levels of actitity,
the highest and the lowest , to estimate a Mixed Cost function.
The visual Fit of a scatter diagram method is used to draw a line that best fits the data points
representing a mixed cost at various levels of activity.This method is often used because its is quick,
easy and a reasoably accurate approximation of the cost function involved. the major advantage of this
method is that all available relationships between cost and activity are considered. its biggest
limitation is that the method depends on the judgement of the person preparing the analysis becasue
he or she msut visually choose the best fit.
Visual Fit Of a Scatter Diagram Method
Methods Analyzing cost
Mixed Costs to be Planned and controlled
$-
$5,000.00
$10,000.00
$15,000.00
$20,000.00
$25,000.00
0 5 10 15
Maintenance Cost
Machine Hours
Linear (Machine Hours)
4. Change in total cost
Change in activity level
Maintenance Cost Machine Hours
High Point 20,088.00$ 10368
Low point 13224 3504
Difference 6,864.00$ 6864
1.00$
$9,720
$9,720
Machine Cost
3
nΣxy-(Σx)(Σy)
nΣx^2 -(Σx)^2
a= Σy/n - b(Σx/n)
b= 1.03
a= 9,408.71
9408.71+1.031 (Machine Hours)
Variable Cost Rate Fixed Costs
1.02$ 9,500.00$
y= a + bx
Maintenance Costs =
Summary of Cost Estimation Results
Scatter diagram method
Linear Regression Analysis
Linear Regression Analysis is a more accurate cost estimation technique because it
mathematically determines the straight line Called Regression line)
y= a + bx
b=
or
Fixed Cost ,=13224-(1*3504)
,= 9720 + $1 (Machine Hours)
Variable cost rate=
Fixed Cost ,=20088-(1*10368)
Variable cost rate=
5. 1.00$ 9,720.00$
1.03$ 9,408.50$
The most Accurate Result can be Expected from Linear Regression Analysis
Linear Regression method
High-low method
6. Variable Costing Absorption Costing
Basic Purpose Internal Reporting External Reproting
Income statement Format Sales Sales
Variable cost Cost of Good Sold
Contribution Margin Gross Margin
Fixed Cost Operating Expense
Net Income Net income
Product Costs variable manufacturing costs All manufacturing Cost
Period Costs Veriable selling & Administravtive Expenses All selling & Administrative Expenses
All fixed Cost
Manufacturing , selling & Administrative
Net Income Comparison
Prodution equals Sales Net income same as Absorption costing Net income same as variable costing
Prodution more than sales Net income Less than Absorption costing Net income more than variable costing
Production less than sales Net income Mor e than absortion costing Net Income less than variable costing
Net income differene
Fixed cost in ending inventory compared with
those in beginning inventory
Comparison of Variable Costing and Absorption Costing
7. Unit Cost Computation with variable and Abosrption Costing
How unit cost differ with variable costing and absorption costing
Irvin company which manufatures a single product
Direct material 3.00$
Direct labor 6.00$
Manufacturing overhead 1.00$
Selling and Administrative 2.00$
Fixed Cost for a year
Fixed Manufactuirng overhead 600,000.00$
Selling & Administrative 100,000.00$
Annual production 50000 units
Absorption Costing Variable Costing
Direct material 3.00$ 3.00$
Direct labor 6.00$ 6.00$
Manufacturing overhead 1.00$ 1.00$
Fixed Manufactuirng overhead 12.00$ -$
22.00$ 10.00$
Variable cost per unit
Note that the unit cost with absorption Costing is $12 more than it is with variable
costing.this because absorption costing treats the $12 per unit manufacturig overhed
rate as a product cost while fixed manufacturig overhead cost totalling $ 60000 are
period cost with variable costing, when the irvin company sells one unit of product
valued with absorption costing the income statement will show $22 as cost of good
sold.if variable costing is used only $10 will be charged to cost of good sold.In
addition ,unit that are not sold at the end of the accounting period will valued at $22
on the balance sheet with absorption costing and $ 10 with variable costing
8. year Production Sales
1990 50000 50000
1991 50000 40000
1992 40000 50000
1990 1991 1992 Total
Sales ($30 per unit 1,500,000.00$ 1,200,000.00$ 1,500,000.00$ 4,200,000.00$
Cost of Good Sold 1,100,000.00$ 880,000.00$ 1,220,000.00$ 320,000.00$
Gross profit 400,000.00$ 320,000.00$ 280,000.00$ 1,000,000.00$
Selling and administrative expenses 200,000.00$ 180,000.00$ 200,000.00$ 580,000.00$
Net Income 200,000.00$ 140,000.00$ 80,000.00$ 420,000.00$
Cost of Good sold Calculation
Beginning inventory -$ -$ 220,000.00$ -$
Production cost
50000 units X $22 1,100,000.00$
40000 units x $22 880,000.00$ 3,080,000.00$
Inventory available 1,100,000.00$ 1,100,000.00$ 1,100,000.00$ 3,080,000.00$
Less ending inventory -$ 220,000.00$ -$ -$
Cost of Good Sold 1,100,000.00$ 880,000.00$ 1,100,000.00$ 3,080,000.00$
Add underapplied overhead -$ -$ 120,000.00$ 120,000.00$
Adjusted Cost of Good sold 1,100,000.00$ 880,000.00$ 1,220,000.00$ 3,200,000.00$
Selling and Administrative Expenses calculation
50000 units X $2 +100000 200,000.00$
40000 unitesX $2 +100000 180,000.00$
50000 units X $2 +100000 200,000.00$
ToTal 580,000.00$
ILLUSTRATION OF VARIABLE COSTING VESES ABSORPTION COSTING
years Ended 1990, 1991 , 1992
Assume that firm began business on january 1, 1990 with no beginning inventory,it sells its single produt for $ 30 per unit. During three
year period 1990- 1992, the selling price and all costs remained the same each year while actual production and sale unit were as follow
Irvin Company
Comparation income Statement
Absorption costing
9. 1990 1991 1992 Total
Sales ($30 per unit 1,500,000.00$ 1,200,000.00$ 1,500,000.00$ 4,200,000.00$
Cost of Good Sold 500,000.00$ 400,000.00$ 500,000.00$ 1,400,000.00$
Manufacturing Margin 1,000,000.00$ 800,000.00$ 1,000,000.00$ 2,800,000.00$
Variable selling and Admin expenses 100,000.00$ 80,000.00$ 100,000.00$ 280,000.00$
Contribution Margin 900,000.00$ 720,000.00$ 900,000.00$ 2,520,000.00$
Fixed Cost
Manufacturing Margin 600,000.00$ 600,000.00$ 600,000.00$ 1,800,000.00$
Selling & Admin 100,000.00$ 100,000.00$ 100,000.00$ 300,000.00$
Total 700,000.00$ 700,000.00$ 700,000.00$ 2,100,000.00$
Net Income 200,000.00$ 20,000.00$ 200,000.00$ 420,000.00$
Cost of Good sold Calculation
Beginning inventory -$ -$ 100,000.00$ -$
Production cost
50000 units X $10 500,000.00$
40000 units x $10 400,000.00$ 1,400,000.00$
Inventory available 500,000.00$ 500,000.00$ 500,000.00$ 1,400,000.00$
Less ending inventory -$ 100,000.00$ -$ -$
Cost of Good Sold 500,000.00$ 400,000.00$ 500,000.00$ 1,400,000.00$
Variable Selling and Administrative Expenses calculation
50000 units X $2 100,000.00$
40000 unitesX $2 80,000.00$
50000 units X $2 100,000.00$
ToTal 280,000.00$
Irvin Company
Comparation income Statement
Variable costing
years Ended 1990, 1991 , 1992
10. The variable costing net income moves in the same direction as sales. The manufacturing margin is a
costant percentage of sales or 66.7%. The contribution margin also constant percentage of sales 60%
.Consequently management can easily perdict the impact of changes in sales volume on net income
because of the linear relationship involved. An irvin Compnay Manager will naturally expect a higher
profit when the sales volume increases. selling price remain constant, and all cost are the same.The
absorption costing result , however are much more difficult to interpret and explain. Despite the sales
increased by $ 300000 from 1991 to 1992, the net income of 1992 was actually lower than that of
1991.the reason these results are so inconsistent is that net income with absorption costing is affected by
changes in inventory because of the absorption of fixed manufacturing overhead costs as product cost .
as such absorption costing net income is a function of both sales and production. where as variable
costing net income is a function of sales only.these absorption costing deficiencies have made variable
costing very popular for interal reproting purpose
Evaluation Of The Net Income Results