Downloaded 246 times
![BREAK-EVEN ANALYSIS
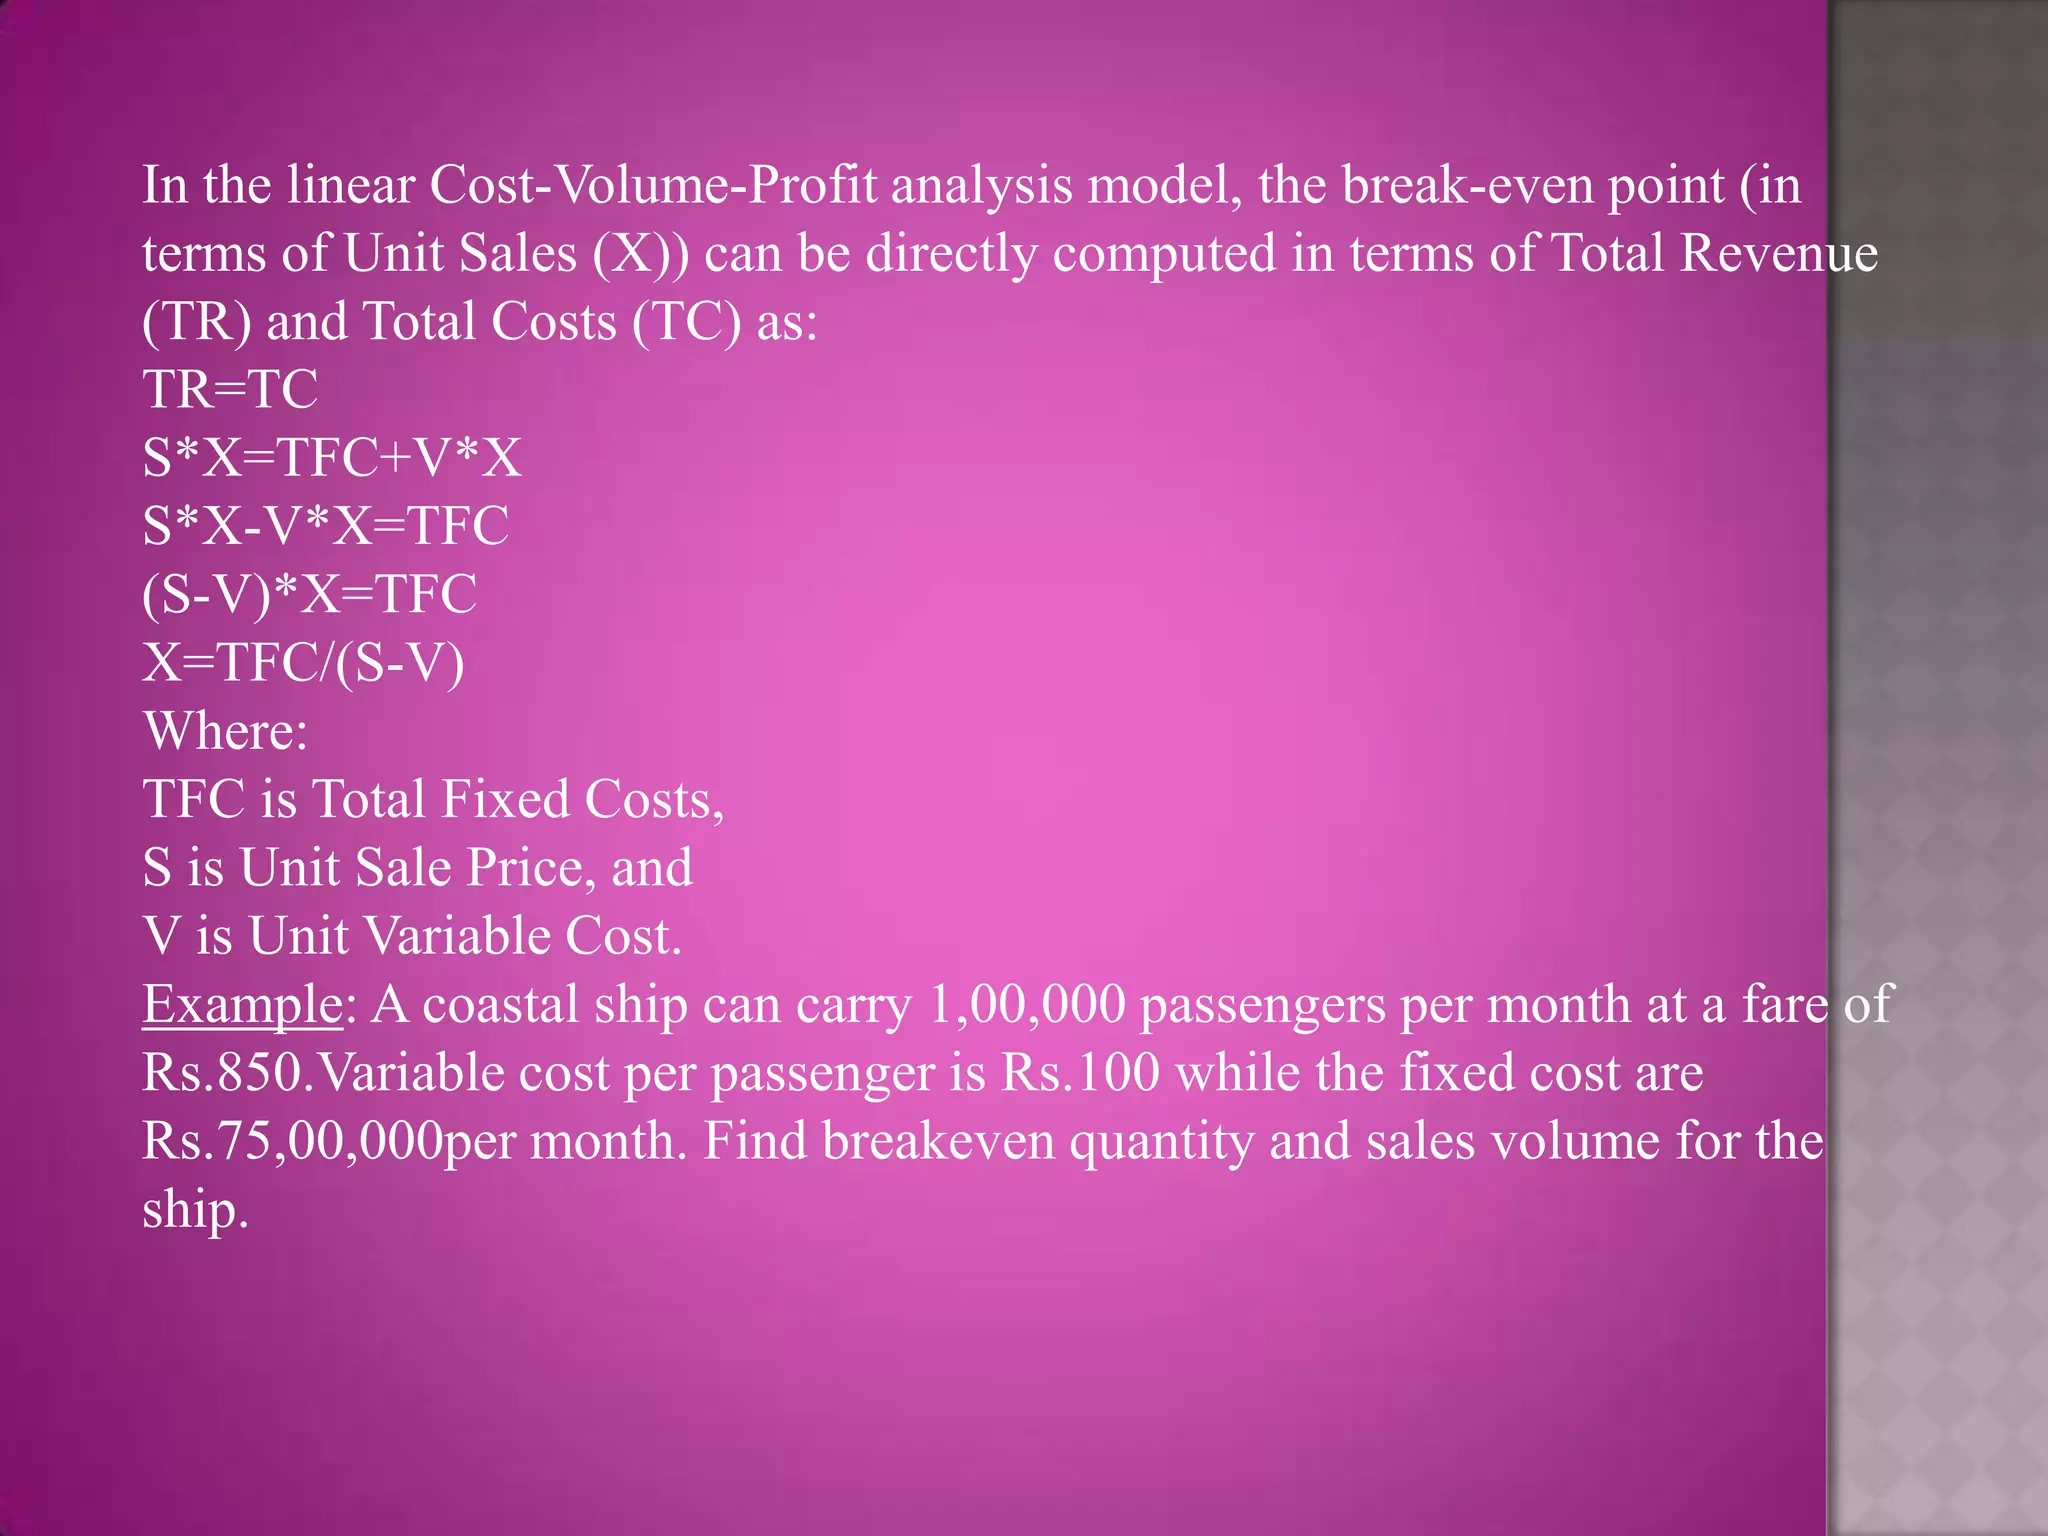
According to Martz,Curry and Frank, "A break-even analysis indicates at what
level cost and revenue are in equilibrium.”
•The BEP is that point of activity(sales volume) where total revenues and total
expenses are equal.
• Profit=0
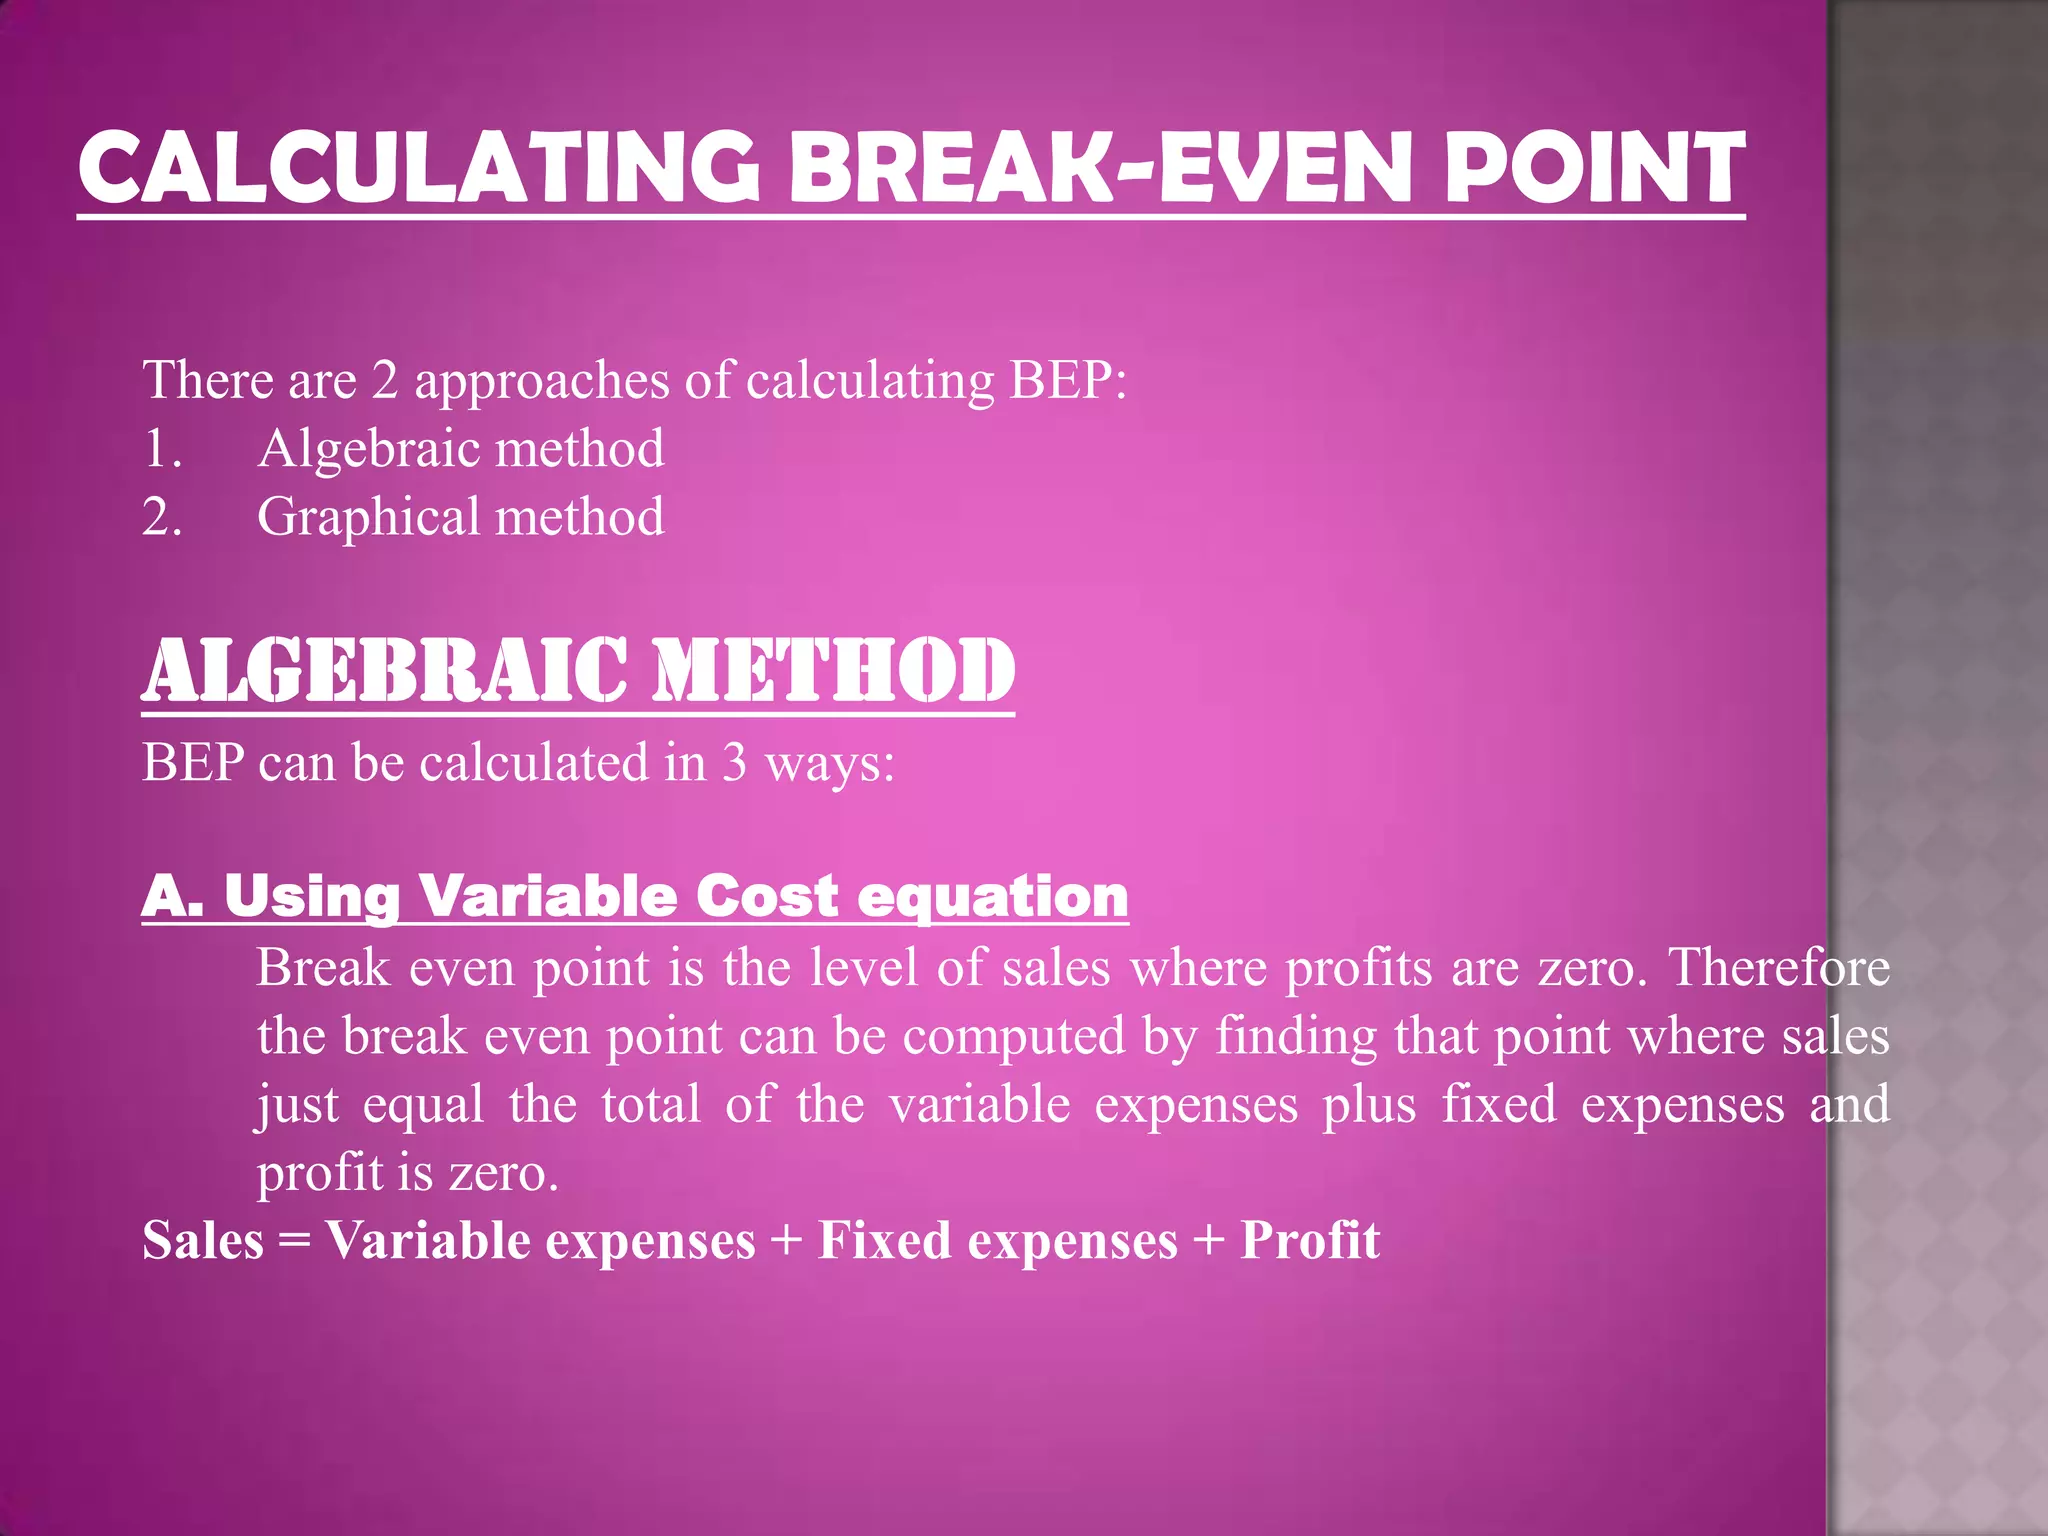
EQUATION
[Break even sales = fixed cost + variable cost]
Fixed Costs
Cost that do not change when production or sales levels do change, such as rent,
property tax, insurance, or interest expense. The fixed costs are summarized for
a specific time period (generally one month).
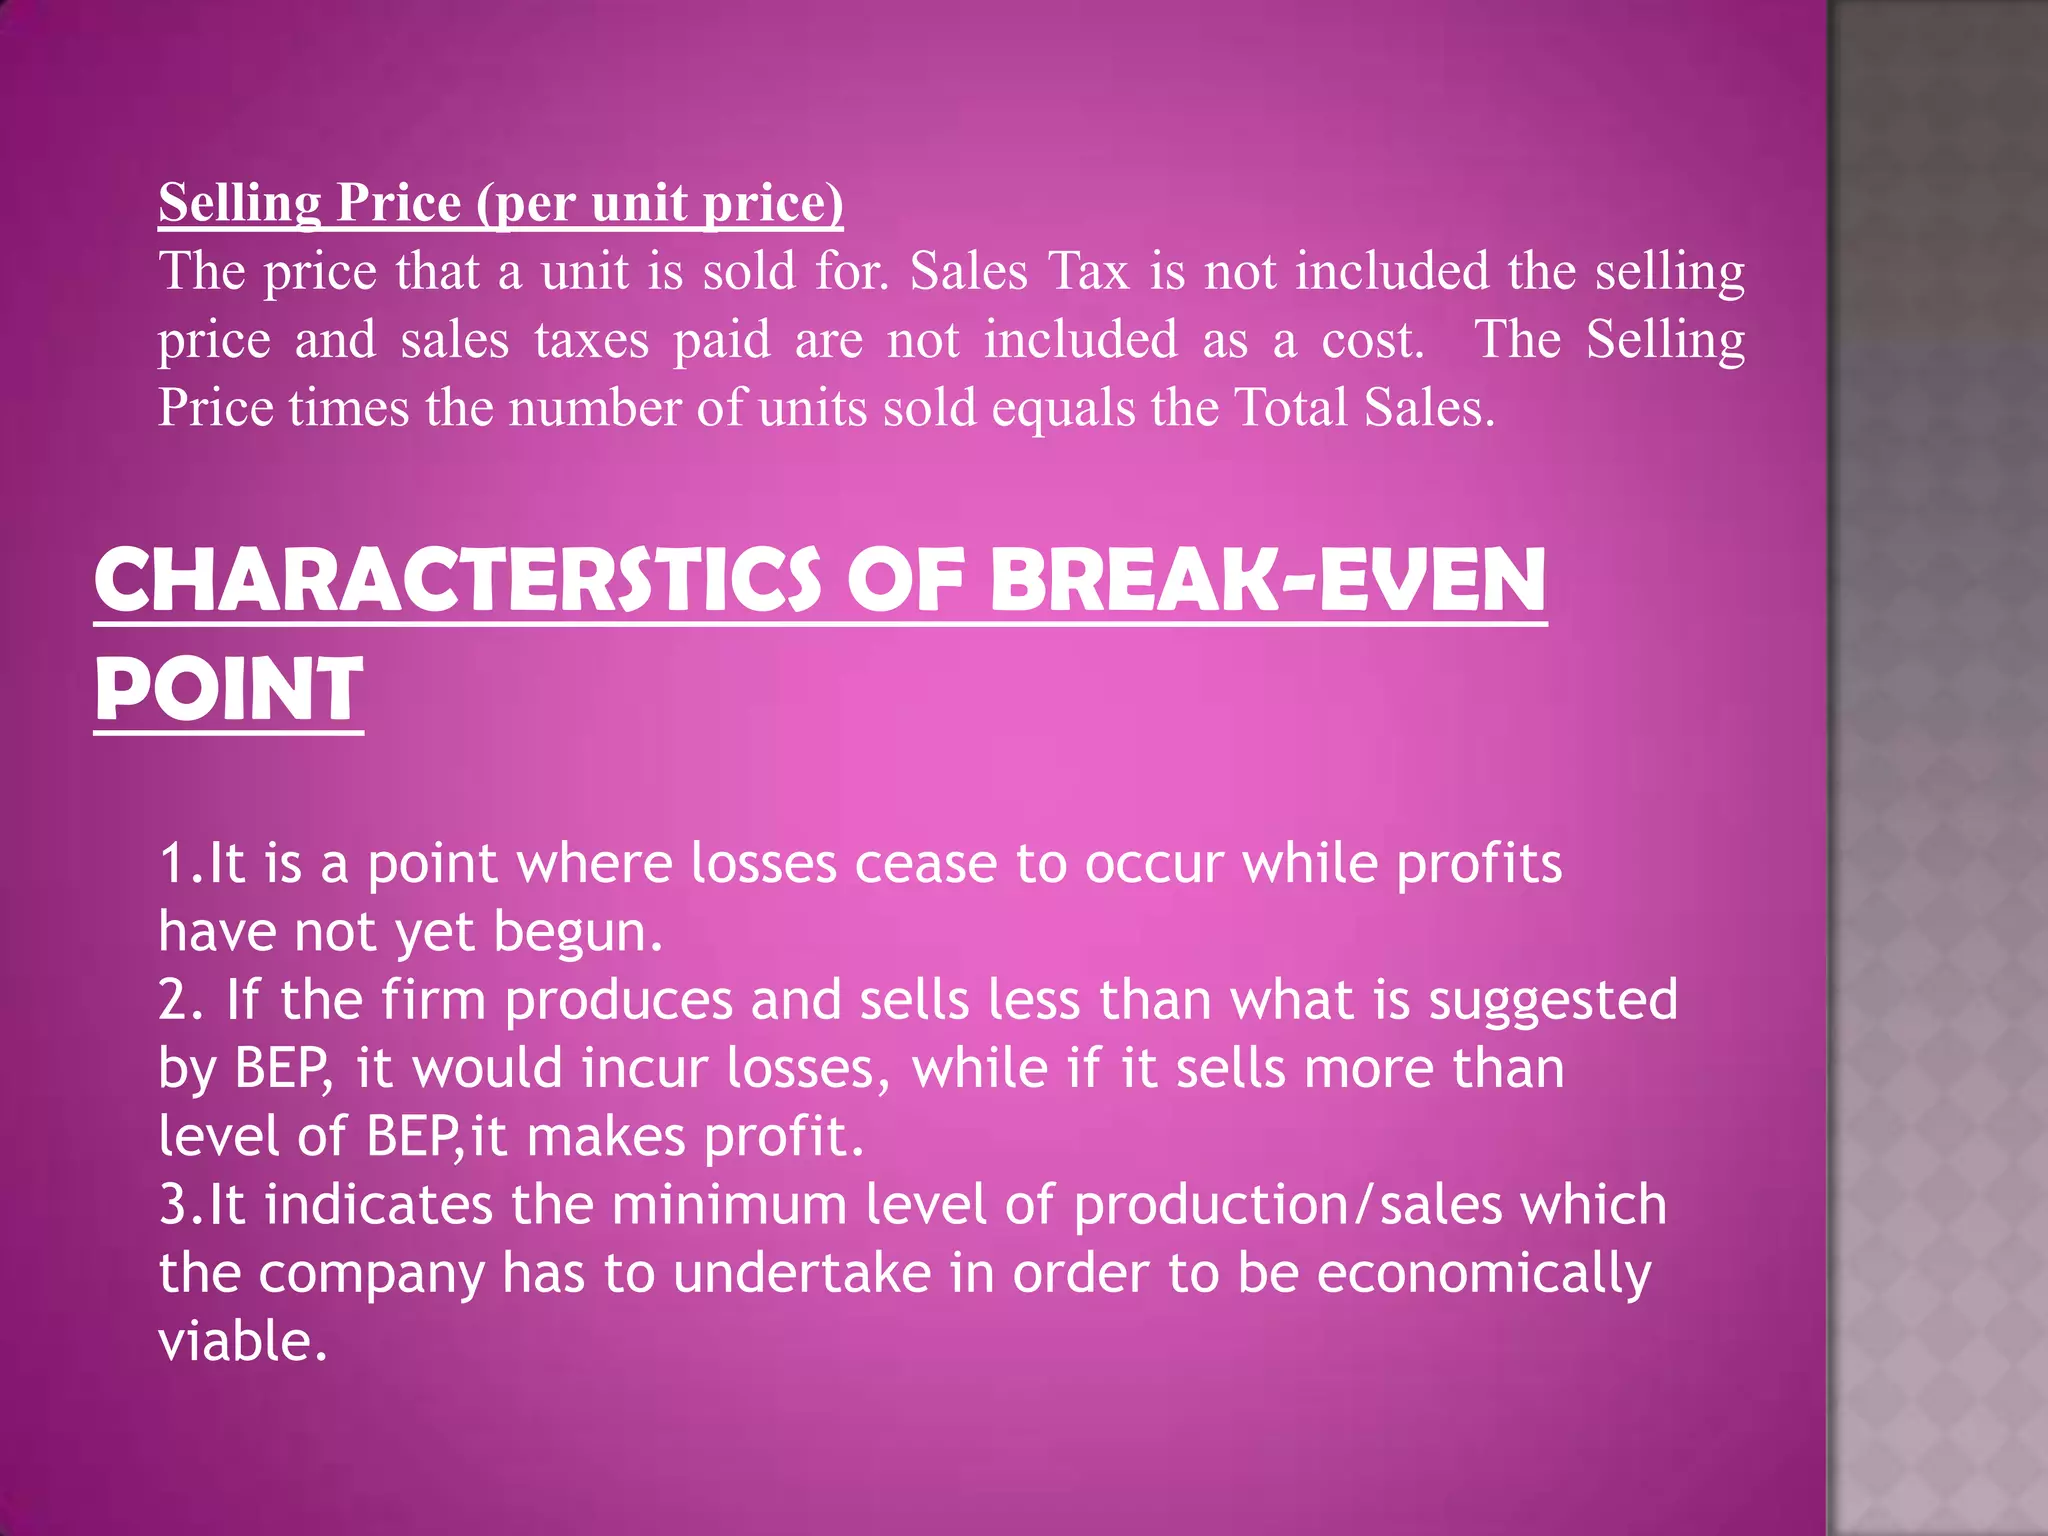
Variable Cost (Per Unit Cost)
Variable costs are costs directly related to production units. Typical variable
costs include direct labor and direct materials. The variable cost times the
number of units sold will equal the Total Variable Cost. Total Variable costs plus
Fixed costs make up the total cost of production.](https://image.slidesharecdn.com/beappt-111125065835-phpapp01/75/Bea-ppt-2-2048.jpg)
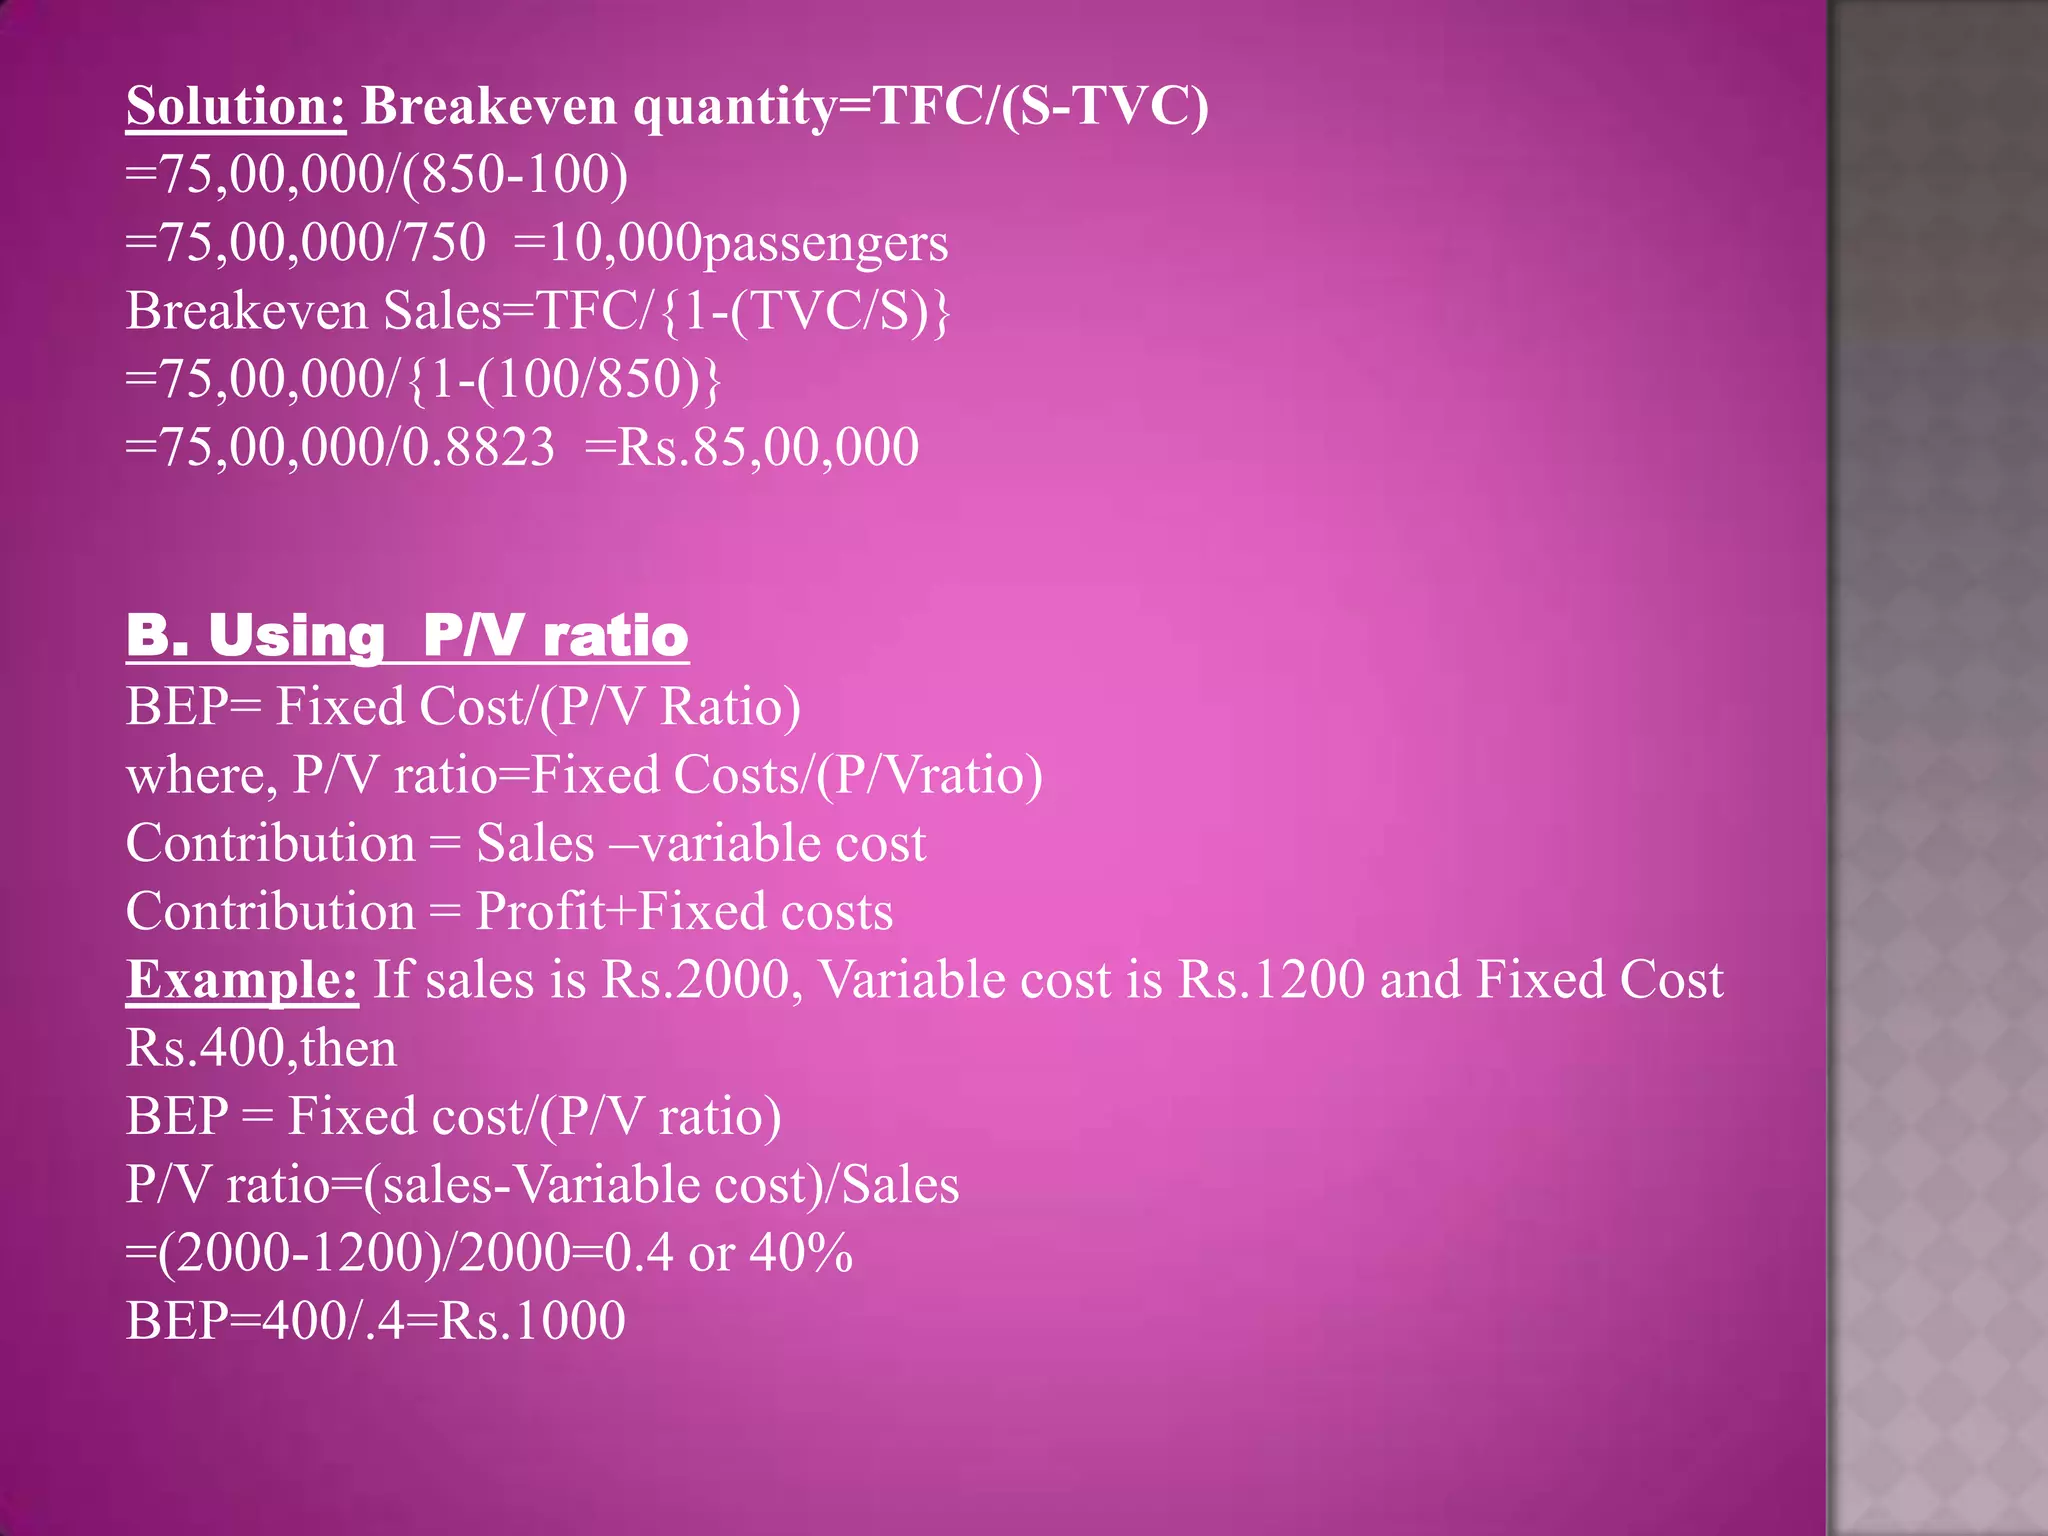
![Concept of Contribution Margin
Contribution is the difference between total revenue and variable costs arising out
of a business decision.
BEP(in units)=Fixed Cost/Unit contribution margin
Break Even Sales in Rs = [Fixed Cost / 1 – (Variable Cost / Sales)] Total
Contribution Profit=TR-TVC=Net Profit Fixed Cost.](https://image.slidesharecdn.com/beappt-111125065835-phpapp01/75/Bea-ppt-11-2048.jpg)


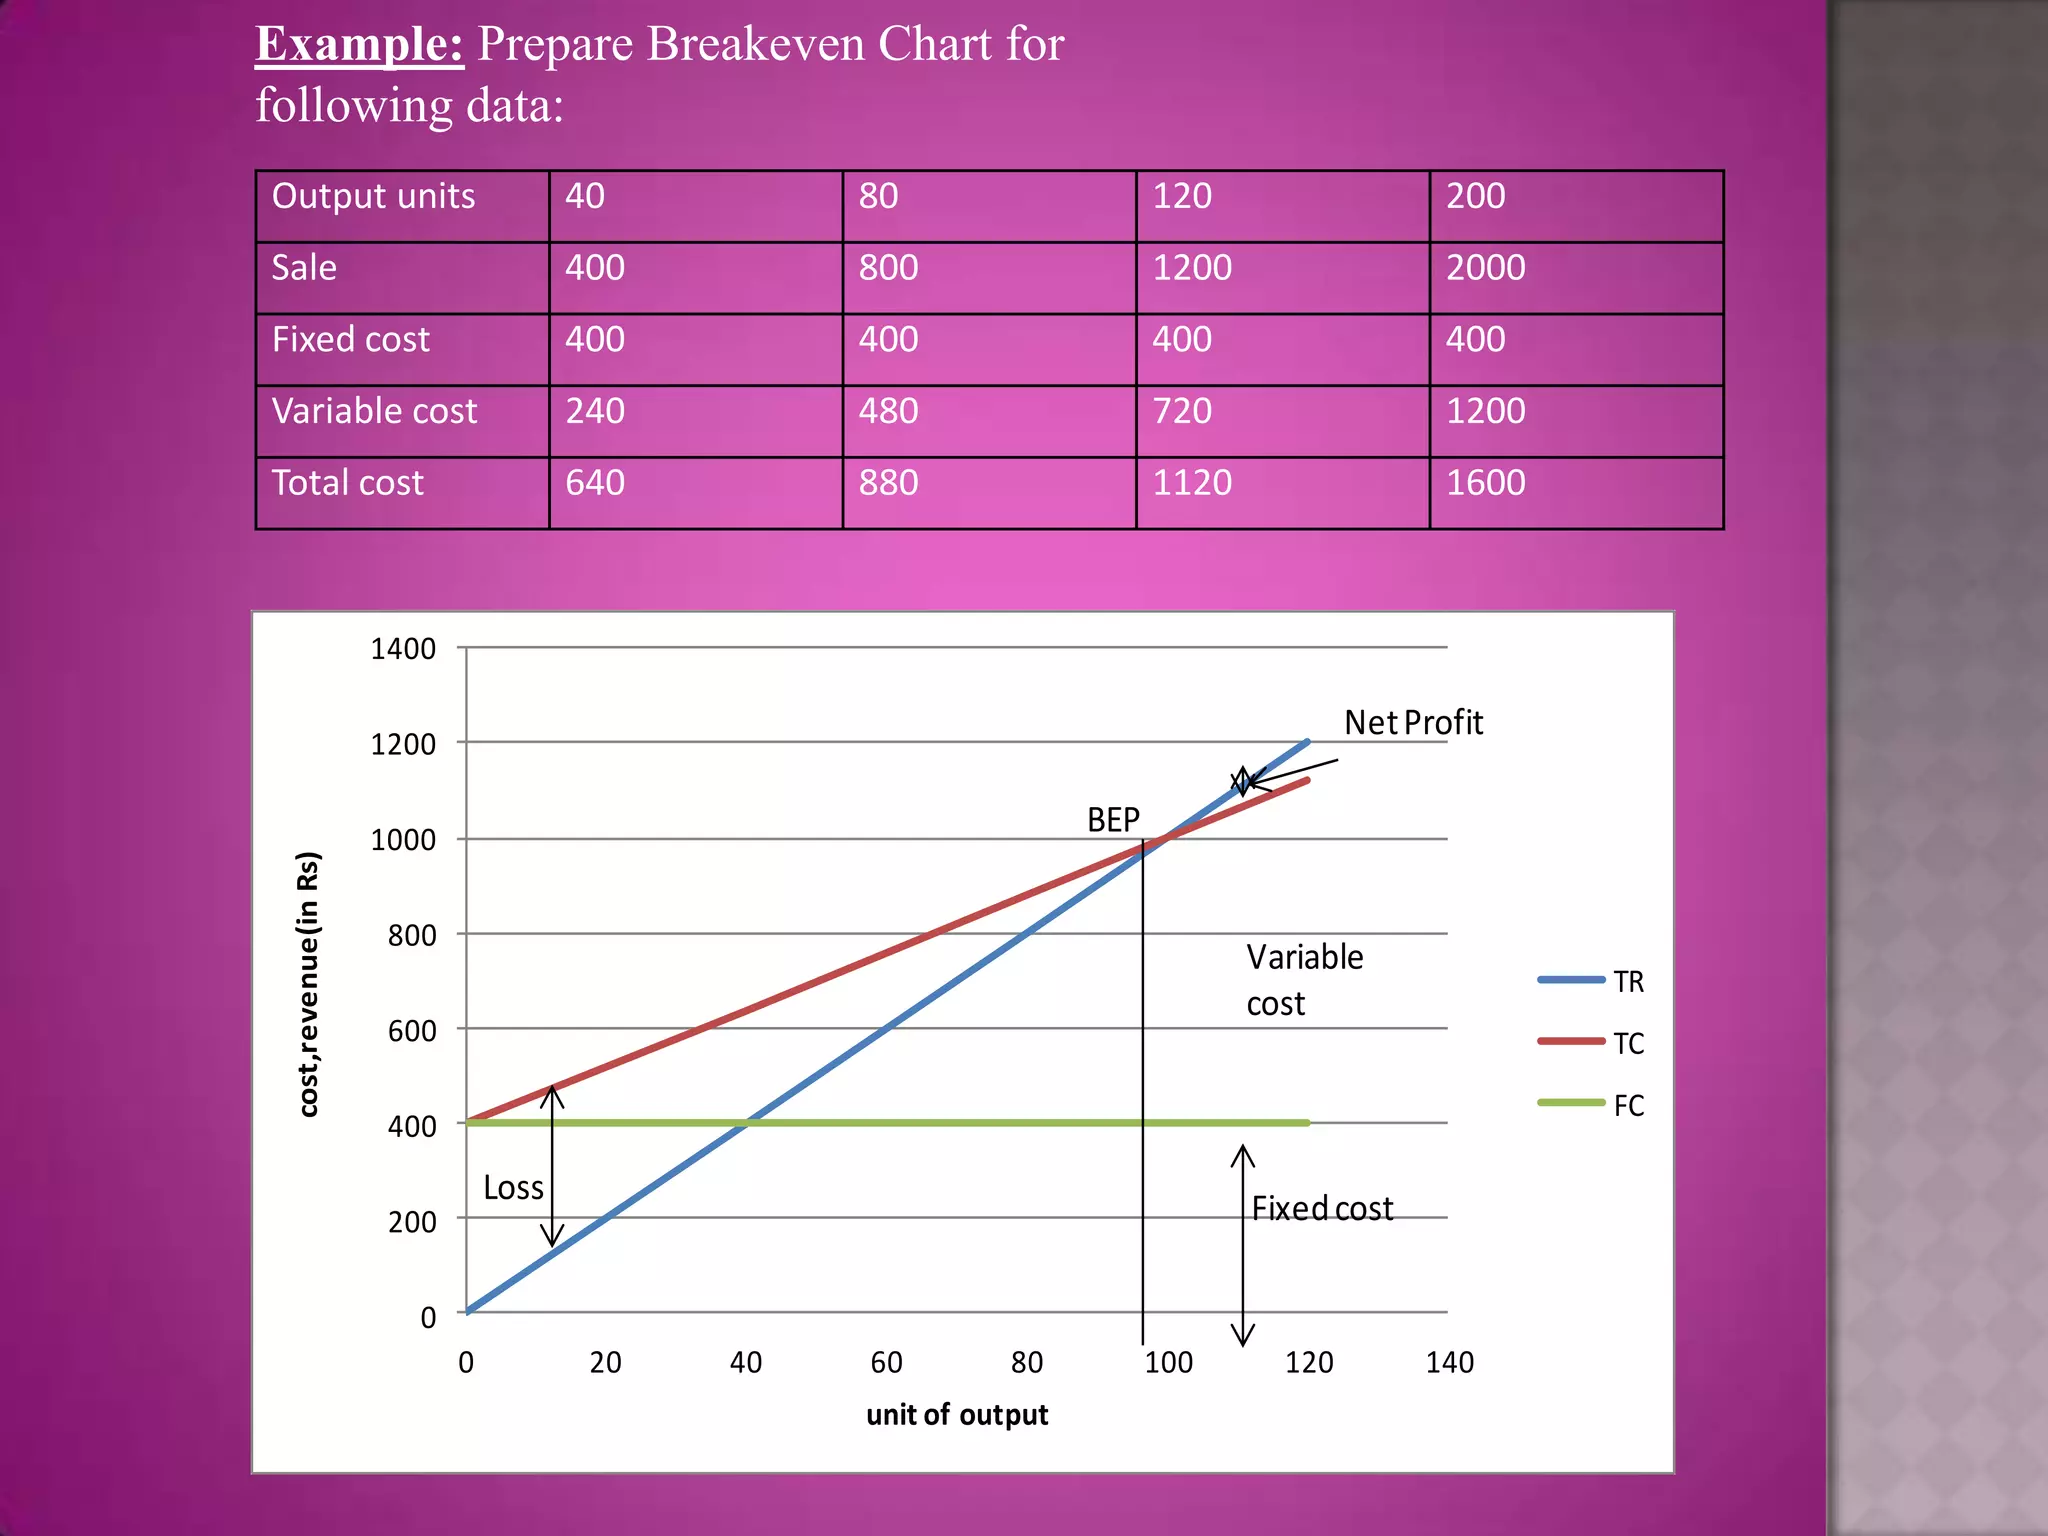
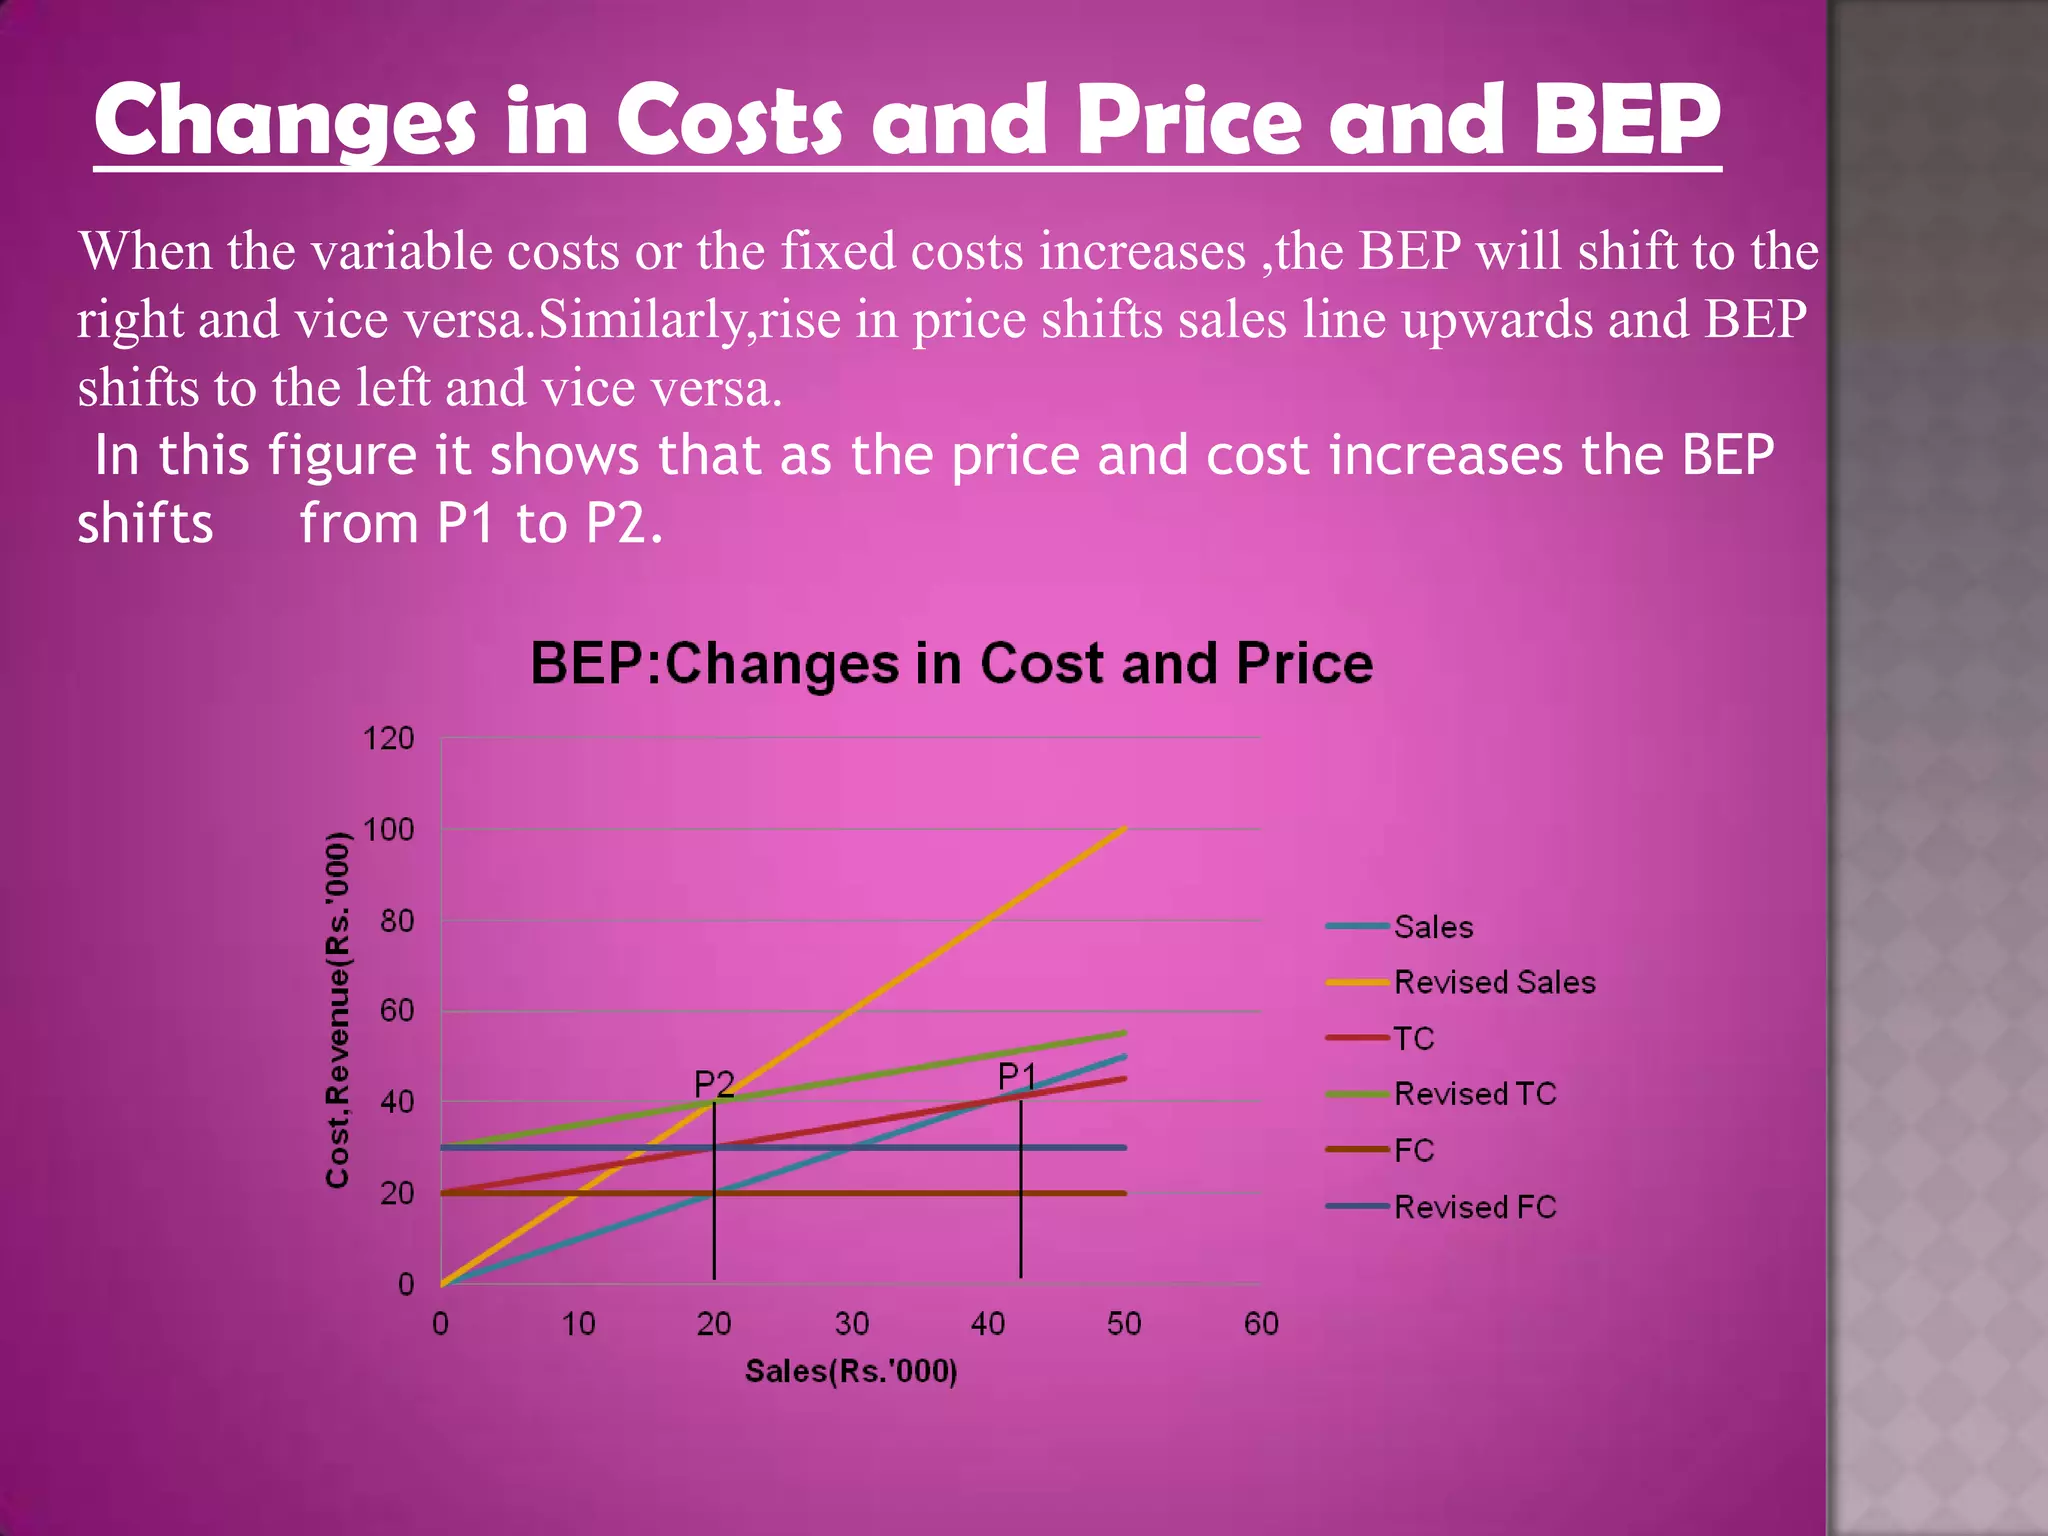
Break-even analysis indicates the sales volume needed for revenues and expenses to be equal. It is calculated using the equation: Break even sales = Fixed costs + Variable costs. The break-even point shows the minimum level of production or sales required for a company to not incur losses. Changes in fixed costs, variable costs, or prices will shift the break-even point. Break-even analysis helps determine optimal output levels and product pricing.