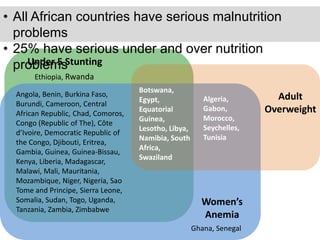
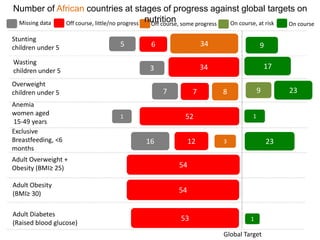
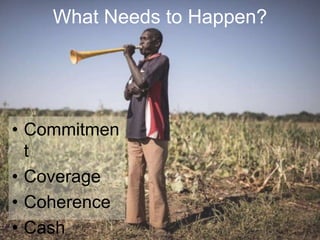
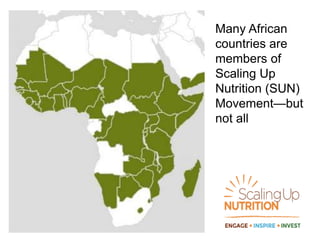
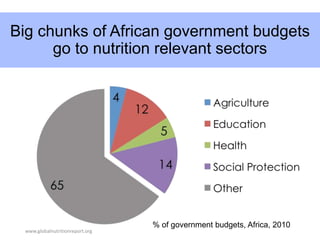
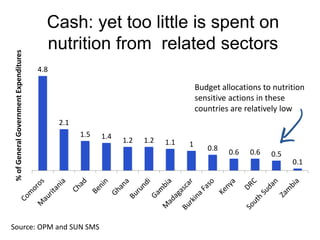
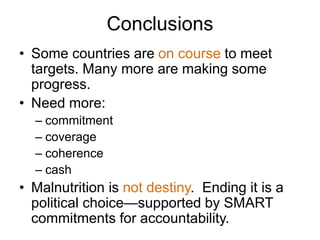
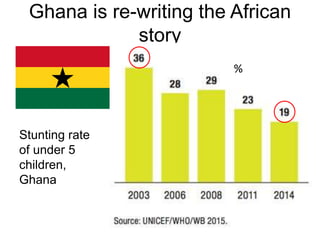
Scaling Up Nutrition Action for
Africa
Where are we and what challenges are
need to be addressed to accelerate
malnutrition?
Lawrence Haddad
Global Alliance for Improved Nutrition
• Why should African political
leaders care about
malnutrition?
• What needs to happen?
Good nutrition
prevents
45%..
.....of all death under 3 years of age
that is related to malnutrition
Good nutrition “wires the
circuits”
Poor nutrition reduces the
economic wealth of nations
16.5
11.5
10.3
7.7
6.3
5.6
3.1
% of GDP lost each year
AUC/WFP Cost of Hunger Studies
Demographic Dividend for Africa?
With stunting? Forget about it.
1
1.25
1.5
1.75
2
Ratioofworkingagetodependent
population,subSaharanAfrica
Data from Bloom and Canning 2011
Akin Adesina
President of the African
Development Bank 2016
“We need to
invest in gray
matter
infrastructure.”
“Neuronal
infrastructure is
quite possibly going
to be the most
important
infrastructure.”
Jim Kim
President, World Bank 2016
And the Development Bank Leaders
Know It
Scaling Up
Nutrition.
Where Are We?
Under 5 Stunting
Women’s
Anemia
Adult
Overweight
Ethiopia, Rwanda
Ghana, Senegal
Angola, Benin, Burkina Faso,
Burundi, Cameroon, Central
African Republic, Chad, Comoros,
Congo (Republic of The), Côte
d’Ivoire, Democratic Republic of
the Congo, Djibouti, Eritrea,
Gambia, Guinea, Guinea-Bissau,
Kenya, Liberia, Madagascar,
Malawi, Mali, Mauritania,
Mozambique, Niger, Nigeria, Sao
Tome and Principe, Sierra Leone,
Somalia, Sudan, Togo, Uganda,
Tanzania, Zambia, Zimbabwe
Algeria,
Gabon,
Morocco,
Seychelles,
Tunisia
Botswana,
Egypt,
Equatorial
Guinea,
Lesotho, Libya,
Namibia, South
Africa,
Swaziland
• All African countries have serious malnutrition
problems
• 25% have serious under and over nutrition
problems
What is the rate of
progress?
Highly variable—but there is cause for hope
9
Stunting
children under 5
Wasting
children under 5
Overweight
children under 5
Anemia
women aged
15-49 years
Exclusive
Breastfeeding, <6
months
Adult Overweight +
Obesity (BMI≥ 25)
Adult Obesity
(BMI≥ 30)
Adult Diabetes
(Raised blood glucose)
3465
3
7
1
16
17
23
1
23
34
987
52
312
54
54
53 1
Global Target
Missing data Off course, little/no progress Off course, some progress On courseOn course, at risk
Number of African countries at stages of progress against global targets on
nutrition
Progress against Malabo
Declaration target for stunting
reduction
4
39
6
On course Off course, but
making progress
Off course, not
making any
progress
How many
African
countries will
attain stunting
rates of 10% by
2025?
What Needs to Happen?
• Commitmen
t
• Coverage
• Coherence
• Cash
Must make the issue hard for
African heads of state to ignore
Many African
countries are
members of
Scaling Up
Nutrition (SUN)
Movement—but
not all
But commitment is not measured by
membership alone.
Setting &
working to
meet SMART
targets is key.
There are not enough SMART targets in
African nutrition country plans
75 73
55
45
35
10
Stunting Exclusive
breastfeeding
Wasting Anaemia in
women
Low birth
weight
Under 5
overweight
Percent of 40 African Nutrition Plans with SMART Targets
for…
Few African Countries have Targets
for
Diet Related NCDs
Source: Unpublished self-reported data from the NCD Country Capacity Survey, provided by the WHO
Surveillance and Population-based Prevention Unit, Department for Prevention of NCDs. Printed with permission.
%
Percent of 40 countries with targets for…
40
35
15
Obesity Diabetes Salt Reduction
Nutrition
Program
Coverage
?
Coverage of nutrition-specific interventions
remains highly variable across African countries
0
10
20
30
40
50
60
70
80
90
100
Exclusive
breastfeeding <6
months
Minimum dietary
diversity (6-23
months)
Zinc treatment
for diarrhoea (U5)
Iron-Folic acid
suppl. 90+ days
(pregnant women)
Iron suppl. (U5) Vitamin A suppl.
(U5)
Salt iodization
(household)
Coverage of Nutrition Programs
is too Low
Coherence
Coherence: Underlying determinant
dashboard for Kenya
24
0.792
39
44
122
37.7
% Food insecure (FAO)
Nurses and Midwives/1000 people
% girls not enrolled in secondary school
Unimproved water (%)
Unimproved or no sanitation (%)
Gender inequality rank (1=best)
Gov Exp on Health, Ed, Ag (as % of budget)
http://globalnutritionreport.org/files/2014/11/gnr14_cp_kenya.pdf
Cash: Invest more
and allocate better
% of government budgets, Africa, 2010
Big chunks of African government budgets
go to nutrition relevant sectors
www.globalnutritionreport.org
Source: OPM and SUN SMS
Cash: yet too little is spent on
nutrition from related sectors
Budget allocations to nutrition
sensitive actions in these
countries are relatively low
4.8
2.1
1.5 1.4 1.2 1.2 1.1 1 0.8 0.6 0.6 0.5
0.1
%ofGeneralGovernmentExpenditures
Conclusions
• Some countries are on course to meet
targets. Many more are making some
progress.
• Need more:
– commitment
– coverage
– coherence
– cash
• Malnutrition is not destiny. Ending it is a
political choice—supported by SMART
commitments for accountability.
Ghana is re-writing the African
story
Stunting rate
of under 5
children,
Ghana
%
Three things you can do
• Challenge decision makers with
evidence on the slow pace of
malnutrition reduction
• Make those essential but challenging
alliances for nutrition with those outside
your immediate circle
• Make SMART commitments for nutrition
and ask others to do the same
Thank you

Haddad ator oct 2016

  • 1.
    Scaling Up NutritionAction for Africa Where are we and what challenges are need to be addressed to accelerate malnutrition? Lawrence Haddad Global Alliance for Improved Nutrition
  • 2.
    • Why shouldAfrican political leaders care about malnutrition? • What needs to happen?
  • 3.
    Good nutrition prevents 45%.. .....of alldeath under 3 years of age that is related to malnutrition
  • 4.
    Good nutrition “wiresthe circuits”
  • 5.
    Poor nutrition reducesthe economic wealth of nations 16.5 11.5 10.3 7.7 6.3 5.6 3.1 % of GDP lost each year AUC/WFP Cost of Hunger Studies
  • 6.
    Demographic Dividend forAfrica? With stunting? Forget about it. 1 1.25 1.5 1.75 2 Ratioofworkingagetodependent population,subSaharanAfrica Data from Bloom and Canning 2011
  • 7.
    Akin Adesina President ofthe African Development Bank 2016 “We need to invest in gray matter infrastructure.” “Neuronal infrastructure is quite possibly going to be the most important infrastructure.” Jim Kim President, World Bank 2016 And the Development Bank Leaders Know It
  • 8.
  • 9.
    Under 5 Stunting Women’s Anemia Adult Overweight Ethiopia,Rwanda Ghana, Senegal Angola, Benin, Burkina Faso, Burundi, Cameroon, Central African Republic, Chad, Comoros, Congo (Republic of The), Côte d’Ivoire, Democratic Republic of the Congo, Djibouti, Eritrea, Gambia, Guinea, Guinea-Bissau, Kenya, Liberia, Madagascar, Malawi, Mali, Mauritania, Mozambique, Niger, Nigeria, Sao Tome and Principe, Sierra Leone, Somalia, Sudan, Togo, Uganda, Tanzania, Zambia, Zimbabwe Algeria, Gabon, Morocco, Seychelles, Tunisia Botswana, Egypt, Equatorial Guinea, Lesotho, Libya, Namibia, South Africa, Swaziland • All African countries have serious malnutrition problems • 25% have serious under and over nutrition problems
  • 10.
    What is therate of progress? Highly variable—but there is cause for hope
  • 11.
    9 Stunting children under 5 Wasting childrenunder 5 Overweight children under 5 Anemia women aged 15-49 years Exclusive Breastfeeding, <6 months Adult Overweight + Obesity (BMI≥ 25) Adult Obesity (BMI≥ 30) Adult Diabetes (Raised blood glucose) 3465 3 7 1 16 17 23 1 23 34 987 52 312 54 54 53 1 Global Target Missing data Off course, little/no progress Off course, some progress On courseOn course, at risk Number of African countries at stages of progress against global targets on nutrition
  • 12.
    Progress against Malabo Declarationtarget for stunting reduction 4 39 6 On course Off course, but making progress Off course, not making any progress How many African countries will attain stunting rates of 10% by 2025?
  • 13.
    What Needs toHappen? • Commitmen t • Coverage • Coherence • Cash
  • 14.
    Must make theissue hard for African heads of state to ignore
  • 15.
    Many African countries are membersof Scaling Up Nutrition (SUN) Movement—but not all
  • 16.
    But commitment isnot measured by membership alone. Setting & working to meet SMART targets is key.
  • 17.
    There are notenough SMART targets in African nutrition country plans 75 73 55 45 35 10 Stunting Exclusive breastfeeding Wasting Anaemia in women Low birth weight Under 5 overweight Percent of 40 African Nutrition Plans with SMART Targets for…
  • 18.
    Few African Countrieshave Targets for Diet Related NCDs Source: Unpublished self-reported data from the NCD Country Capacity Survey, provided by the WHO Surveillance and Population-based Prevention Unit, Department for Prevention of NCDs. Printed with permission. % Percent of 40 countries with targets for… 40 35 15 Obesity Diabetes Salt Reduction
  • 19.
  • 20.
    Coverage of nutrition-specificinterventions remains highly variable across African countries 0 10 20 30 40 50 60 70 80 90 100 Exclusive breastfeeding <6 months Minimum dietary diversity (6-23 months) Zinc treatment for diarrhoea (U5) Iron-Folic acid suppl. 90+ days (pregnant women) Iron suppl. (U5) Vitamin A suppl. (U5) Salt iodization (household) Coverage of Nutrition Programs is too Low
  • 21.
  • 22.
    Coherence: Underlying determinant dashboardfor Kenya 24 0.792 39 44 122 37.7 % Food insecure (FAO) Nurses and Midwives/1000 people % girls not enrolled in secondary school Unimproved water (%) Unimproved or no sanitation (%) Gender inequality rank (1=best) Gov Exp on Health, Ed, Ag (as % of budget) http://globalnutritionreport.org/files/2014/11/gnr14_cp_kenya.pdf
  • 23.
    Cash: Invest more andallocate better
  • 24.
    % of governmentbudgets, Africa, 2010 Big chunks of African government budgets go to nutrition relevant sectors www.globalnutritionreport.org
  • 25.
    Source: OPM andSUN SMS Cash: yet too little is spent on nutrition from related sectors Budget allocations to nutrition sensitive actions in these countries are relatively low 4.8 2.1 1.5 1.4 1.2 1.2 1.1 1 0.8 0.6 0.6 0.5 0.1 %ofGeneralGovernmentExpenditures
  • 26.
    Conclusions • Some countriesare on course to meet targets. Many more are making some progress. • Need more: – commitment – coverage – coherence – cash • Malnutrition is not destiny. Ending it is a political choice—supported by SMART commitments for accountability.
  • 27.
    Ghana is re-writingthe African story Stunting rate of under 5 children, Ghana %
  • 28.
    Three things youcan do • Challenge decision makers with evidence on the slow pace of malnutrition reduction • Make those essential but challenging alliances for nutrition with those outside your immediate circle • Make SMART commitments for nutrition and ask others to do the same
  • 29.

Editor's Notes

  • #8 Here are Two quotes from leaders of development banks—quite extraordinary—is this the beginning of a sea change in the way financial institutions think about nutrition? YES
  • #17 Why are we worried about SMART targets? Because they lend themselves to stronger accountability but also 2. they go hand in hand with performance (see next slide)
  • #18 Setting SMART (specific, measurable, relevant, achievable and time-bound) targets is one indicator of commitment This analysis is from the WHO team. Unfortunately looking at 122 country nutrition plans, less than half have set SMART targets for the 6 WHA maternal and child nutrition indicators. Stunting and EBF fare the best. Wasting, perhaps surprisingly, is given lower priority when it comes to setting SMART targets. KB: Analysis of plans from 40 of 54 African countries.
  • #19 On the NCD side of things, less than a third of 174 countries surveys by WHO had targets (SMART or not) for obesity, diabetes and reduction of salt intake
  • #21  This slide shows that when it comes to nutrition specific interventions there is a wide range of coverage achieved by different countries. This is good and bad news. Bad news because we want more countries with high coverage. Good news in the sense that some countries have achieved high coverage but they are not obviously wealthier than the countries that have not. We need to understand more about why some countries are near the top of the lines and some are near the bottom
  • #24 Implementation takes financial resources. Some of it needs to be new. Some of it needs to be allocated differently.
  • #26 But its not just about more money. Its also about making existing allocations to food and agriculture, health, education, social protection, WASH and women’s empowerment more effective in reducing malnutrition The graph shows the percent of government expenditures going to nutrition sensitive programmes (using the SUN donor network definition). The countries on the right of the graph allocated much less of their budgets to nutrition sensitive programmes than other countries—the potential to increase is clear.