Downloaded 10 times
![ACKNOWLEDGMENTS
The Global Nutrition Report’s Independent Expert Group (IEG)
would like to acknowledge the support and contributions
of a large number of people and organizations who made the
development and delivery of the 2014 report possible.
We would like to thank the writing and data analysis team:
Lawrence Haddad, Jessica Fanzo, Kamilla Eriksen, and Komal
Bhatia, with help from Julia Krasevec. We also thank the Report
Secretariat, based at the Institute of Development Studies (IDS)
and coordinated by Tara Shyam.
The IEG is grateful to the International Food Policy Re-
search Institute’s Director General Shenggen Fan and Director
of Communications and Knowledge Management (CKM)
Gwendolyn Stansbury, as well as to CKM team members
Tamar Abrams, Melanie Allen, Luz Marina Alvare, Mulugeta
Bayeh, Terra Carter, Heidi Fritschel, Simone Hill-Lee, Andrew
Marble, Andrea Pedolsky, David Popham, Nilam Prasai, Ghada
Shields, Julia Vivalo, and John Whitehead. We also greatly ap-
preciate administrative support from Lynette Aspillera, David
Governey, and Catherine Gee.
We thank the following people for help with data methods
and data access: Allison Pepper (Flour Fortification Initiative)
for data access; Ann Biddlecom (United Nations Population
Division) for information on the unmet need for family plan-
ning; Anne Peniston, Richard Greene, Elizabeth Jordan-Bell,
and Robbin Boyer (US Agency for International Development
[USAID]) for data clarifications; Bingxin Yu (IFPRI) for SPEED
data; Carlo Cafiero and Piero Conforti (Food and Agriculture
Organization of the United Nations [FAO]) for access to the
overaquisition data; Caryn Bredenkamp and Leander Buisman
(World Bank) for stunting trends by wealth quintile data; Leslie
Elder and Andrea Spray (World Bank) for data clarifications; Erin
McLean (Government of Canada) for data clarifications; David
Clark (UNICEF) for the latest data on the International Code of
Marketing of Breast-milk Substitutes; Liliana Carvajal (UNICEF)
for information on zinc treatment for diarrhea; Holly Newby,
Julia Krasevec, Arachana Dwivedi, and David Clark (UNICEF)
for help on data access and data interpretation; Jere Behrman
(University of Pennsylvania) for advice on the latest literature
on the economic returns to nutrition; John Hoddinott (IFPRI)
for new benefit-cost projections; Juan Feng (World Bank) for
definitions of poverty indicators; Lisa Smith (TANGO Interna-
tional) for advice on models and access to some data on basic
and underlying determinants; Manos Antoninis (United Nations
Educational, Scientific, and Cultural Organization [UNESCO]) for
advice on women’s secondary education indicators; Matthew
Greenslade (UK Department for International Development
[DFID]) for advice on social protection data; Mercedes de Onis,
Monika Blössner, and Elaine Borghi (World Health Organization
[WHO]) for support with data access and guidance on methods;
Scaling Up Nutrition (SUN) focal points and in-country partners
for conducting the self-assessment exercises on SUN country
institutional transformation and the MDF team (Irma Alpenid-
ze, Mike Zuyderduyn, and Ingrid Oomes) and SUN Movement
Secretariat team (Patrizia Fracassi, Shaoyu Lin, Martin Gallagher,
Kwame Akoto-Danso, Pau Blanquer, Delphine Babin-Pelliard,
and Fanny Granchamp) for collating and analyzing the data;
Rajith Lakshman, Maria Fe Celi Reyna, and Woody Wong Espejo
(IDS) for work on the development policy document review;
Rolf Luyendijk (UNICEF) for data and advice on water, sanita-
tion, and hygiene; and Dolf te Lintelo (IDS), Gretchen Stevens
(WHO), Jose Luiz Alvares Moran (Coverage Monitoring Net-
work, Action Against Hunger), and Luz Maria De-Regil (Micro-
nutrient Initiative) for being part of the report’s Data Access
Group.
We also acknowledge support for the development of the
panels (beyond authorship) featured in this year’s report from
Jennifer Requejo, Lina Mahy and the UN Standing Committee
on Nutrition, Pau Blanquer, Patrizia Fracassi, Rachel Nugent,
Endang Achadi, Steve Wiggins, Mercedes de Onis, and Clara
Picanyol.
For facilitating the tracking of Nutrition for Growth commit-
ments, we thank Anna Taylor, Tanya Green, and Rob Hughes
(DFID); Delphine Babin Pelliard, Kwame Akoto-Danso, Martin
Gallagher, Patrizia Fracassi, Pau Blanquer, and Fanny Gran-
champ (SUN Movement Secretariat); Jessica Meeker and Kat
Pittore (IDS); Jonathan Tench (SUN Business Network); and Lina
Mahy (UN Standing Committee on Nutrition).
The IEG acknowledges the support of Richard Horton and
Pamela Das at The Lancet in facilitating the peer review of the
report and thanks the four anonymous Lancet reviewers. We
thank those who provided further feedback and comments
on the draft report: Jennifer Rigg and Rebecca Olson (1,000
Days); Kate Goertzen (ACTION); Juliet Attenborough (Australian
Department of Foreign Affairs and Trade); Ellen Piwoz, Shawn
Baker, and Neil Watkins (Bill & Melinda Gates Foundation);
Sabine Triemer (BMZ–German Federal Ministry for Economic
Cooperation); Jennifer Goosen and Erin McClean (Government
of Canada); Jo Lofthouse, Michael Anderson, and Augustin
Flory (Children’s Investment Fund Foundation [CIFF]); Joseph
Patrick Ngang (Collectif des ONG pour la Sécurité Alimentaire et
le Développement Rural); Joanna Francis (Concern Worldwide;
Generation Nutrition); John Cordaro (Mars); Pedro Campo-
Llopis, Catherine Chazaly, and Patrice Moussy (European
Commission); Food and Agriculture Organization of the United
x](https://image.slidesharecdn.com/gnr14-150115040612-conversion-gate01/85/Global-Nutrition-Report-14-11-320.jpg)
![Nations; Glen Tarman, Sabrina de Souza, and Sandra Mutuma
(Action Against Hunger UK, Generation Nutrition); Stuart Gillespie
(IFPRI); Marc van Ameringen and Jonathan Tench (Global Alli-
ance for Improved Nutrition [GAIN] and SUN Business Network);
Aslam Shaheen and Qadir Baloch (Harvest Plus Pakistan); Mags
Gaynor (Irish Aid); Iris Bollemeijer (International Medical Corps);
David Nabarro (SUN Movement Secretariat); Nicholas Nisbett
(IDS); Kathryn Russell and Anupama Dathan (ONE Campaign);
Robert Hecht, Arathi Rao, Tae Min Kim, and Aparna Kamath
(Results for Development); Marie Rumsby (Save the Children UK,
Road to Rio Group); Marie Ruel (IFPRI); Alexendre Ghelew (Swiss
Development Cooperation); Syngenta; Hannah Schellander and
James Jansen (UK Department for Environment, Food, and Rural
Affairs); Anna Taylor and Rob Hughes (DFID); Werner Schultink,
Yarlini Balarajan, and France Begin (UNICEF); Lina Mahy (UN
Standing Committee on Nutrition); Anne Peniston (USAID);
Veronique LaGrange and Dacia Whitsett-Morrow (US Dairy
Export Council); Yael Velleman (WaterAid); Leslie Elder and Juan
Feng (World Bank); Martin Bloem, Lynnda Kiess, Saskia Depee,
and Natalie Rae Aldern (World Food Programme [WFP]); and
Francesco Branca (WHO).
We are also grateful to Alan Dangour (London School of
Hygiene and Tropical Medicine), Anna Taylor (DFID), and Jo
Lofthouse (CIFF) for their early and continued encouragement;
to Peter Godwin and Sujaya Misra for comments and ideas on
the accountability and legitimacy framework; and to those who
provided their feedback and ideas during the development of
the concept note for the Global Nutrition Report in early 2014.
The IEG would like to thank the report’s Stakeholder Group
for its engagement throughout the development of the report:
cochairs Edith Mkawa (Permanent Secretary, Office of the
President, Malawi, SUN Focal Point) and Jane Edmonson (DFID),
Abdoulaye Ka (Cellule de lutte contre la malnutrition [CLM],
Senegal), Anna Lartey (FAO), Chris Osa Isokpunwu (SUN Focal
Point, Nigeria), David Nabarro (United Nations Secretary-
General’s office, SUN), Ferew Lemma (Ethiopia), Francesco Bran-
ca (WHO), Jésus Búlux (Secretaría de Seguridad Alimentaria y
Nutricional de la Presidencia de la República [SESAN], Guatema-
la), Martin Bloem (WFP), Nina Sardjunani (Bappenas, Indonesia),
Jean-Pierre Halkin (European Commission, SUN Donor Network),
Jennifer Goosen (Government of Canada, SUN Donor Network),
John Cordaro (Mars, SUN Business Network), Kate Houston
(Cargill, SUN Business Network), Lucy Sullivan and Jennifer Rigg
(1,000 Days, SUN CSO Network), M. Aslam Shaheen (Pakistan),
Marc Van Ameringen (GAIN, SUN Business Network), Michael
Anderson (CIFF), Milton Rondo (Brazil), Shawn Baker (Bill &
Melinda Gates Foundation, SUN Donor Network), Tom Arnold
(Concern Worldwide, SUN CSO Network), and Werner Schultink
(UNICEF).
Finally, we would also like to acknowledge the organiza-
tions that provided financial support for the 2014 report: 1,000
Days, the Bill & Melinda Gates Foundation, the CGIAR Research
Program on Agriculture for Nutrition and Health, the Children’s
Investment Fund Foundation, the European Commission, the
Government of Canada, Irish Aid, and the UK Department for
International Development.
ACTIONS & ACCOUNTABILITY TO ACCELERATE THE WORLD’S PROGRESS ON NUTRITION xi](https://image.slidesharecdn.com/gnr14-150115040612-conversion-gate01/85/Global-Nutrition-Report-14-12-320.jpg)

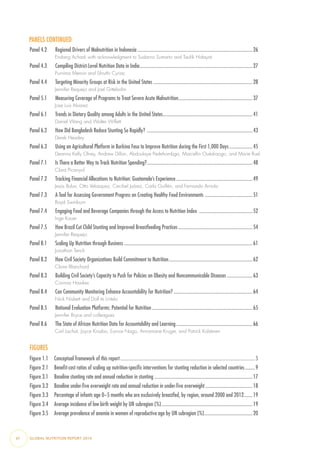
![ACTIONS & ACCOUNTABILITY TO ACCELERATE THE WORLD’S PROGRESS ON NUTRITION 5
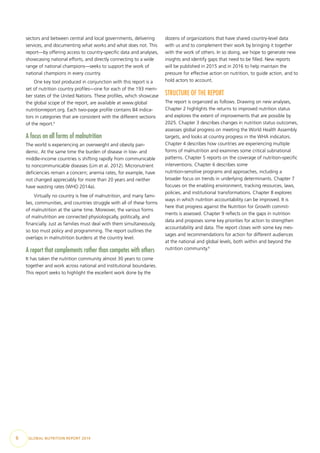
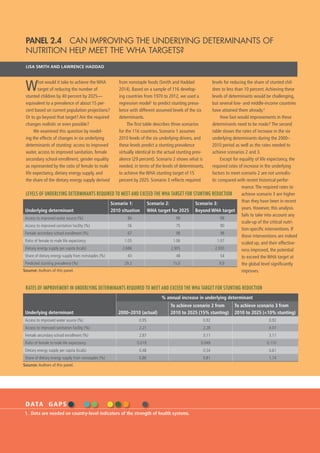
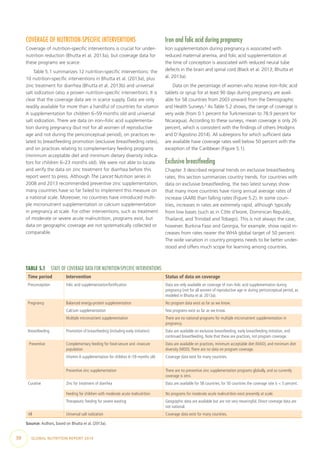
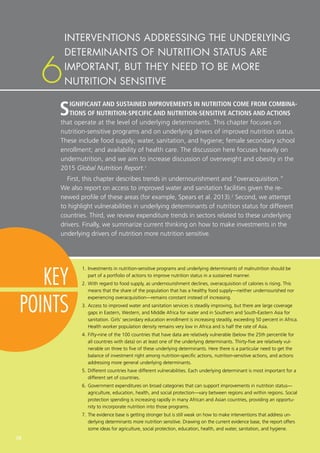
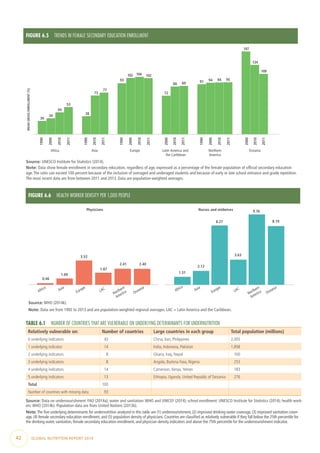
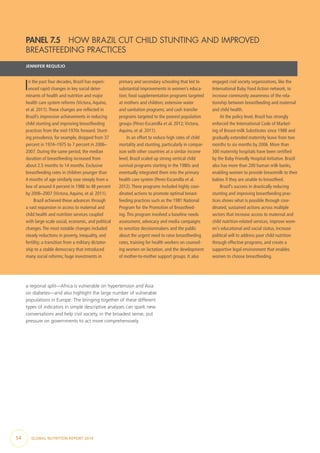
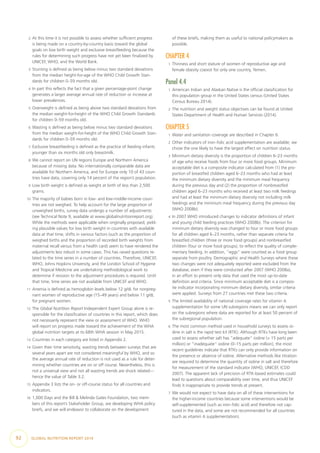
The report as an intervention
The goal of this report is to help better monitor progress on a
range of nutrition status indicators, programs, determinants,
policies, laws, and resources. The aim is to strengthen nutrition
accountability and contribute to faster improvements in nutri-
tion status. By identifying commitments, tracking them, and
assessing whether they are met, the report should stimulate and
intensify action. Because Global Nutrition Reports will be issued
annually, stakeholders will be better able to learn who is and is
not meeting commitments and to help them better meet these
commitments in the future.
A focus on stakeholders at the national level
Arguably, the global commitment to nutrition is stronger than
it has ever been. The food price spikes of 2007–2008 focused
global attention on the long-term consequences of widespread
shocks. The Lancet published two series of papers on maternal
and child undernutrition in 2008 and 2013, bringing together
what we know about the distribution and consequences of
malnutrition and what works to promote good nutrition. The
Scaling Up Nutrition (SUN) Movement, initiated in 2010, has
more than 50 country or state-level members and has been
instrumental in stimulating and sustaining commitment to nu-
trition. Progress in improving micronutrient deficiencies is slow
but has received renewed global attention (such as in the 2014
Global Hunger Index [von Grebmer et al. 2014]). The signatories
to the N4G Compact in London in 2013 pledged more than
US$4 billion in extra financing for undernutrition reduction until
2020. Overweight and obesity, which affect between a third
and a half of adults in high-income countries, are also rising
up the global agenda (Ng et al. 2014; Popkin 2009; Keats and
Wiggins 2014).
Global interest in malnutrition is increasingly reflected at
the national level and generated by challenges experienced at
that level. But without national-level progress, global interest
will be difficult to sustain. This progress at the national level will
depend on national champions who lead the way in pushing
nutrition up the development agenda, building alliances across
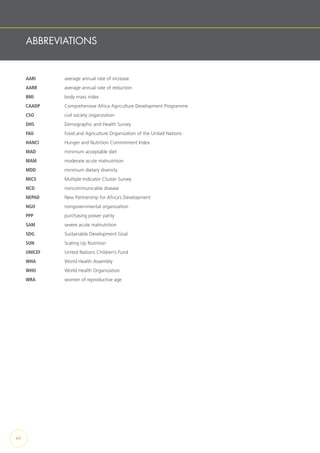
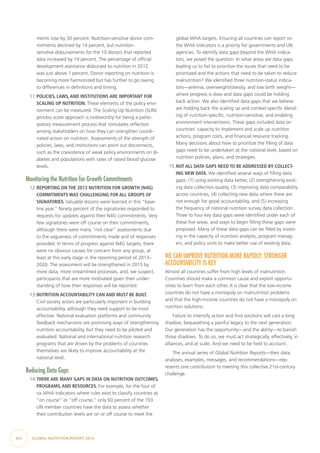
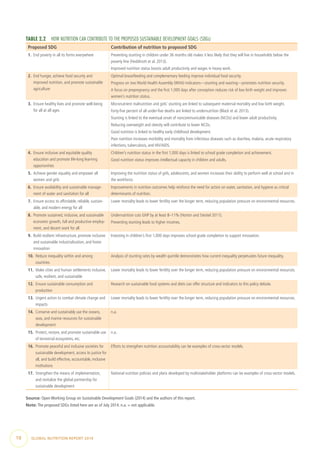
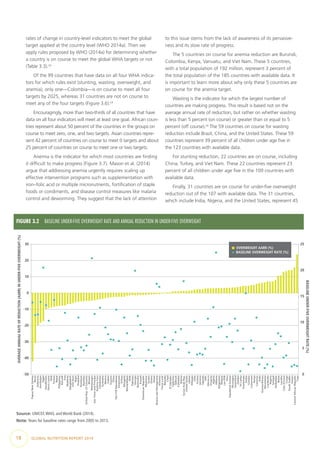
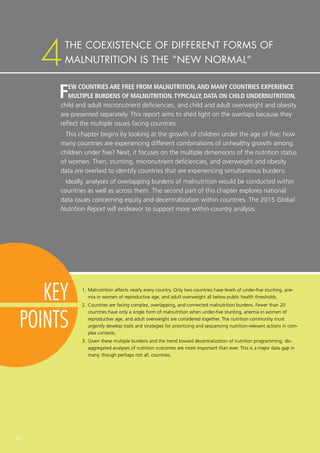
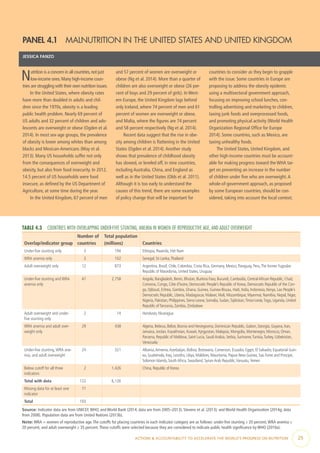
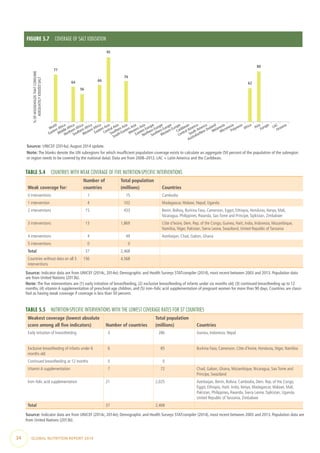
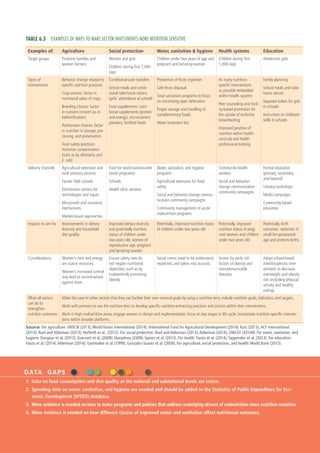
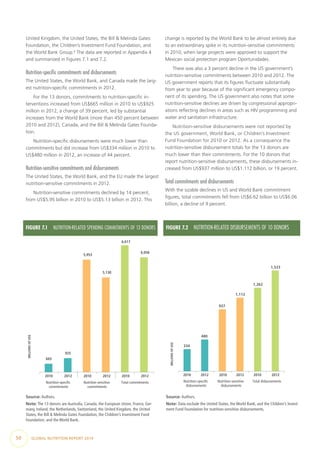
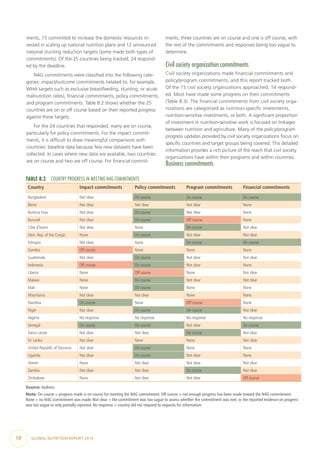
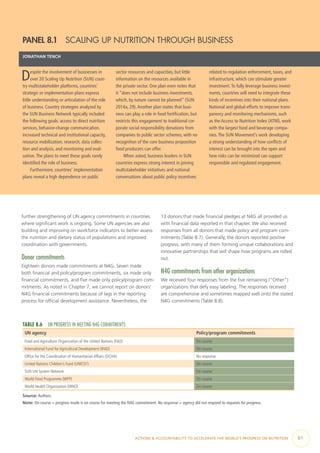
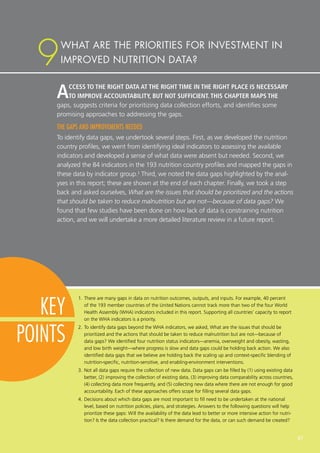
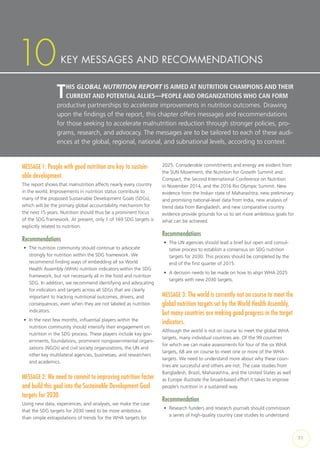
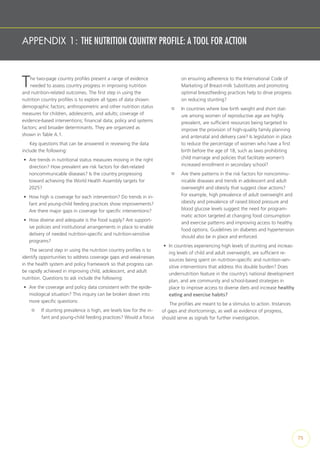
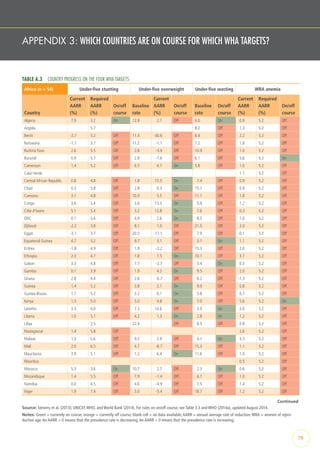
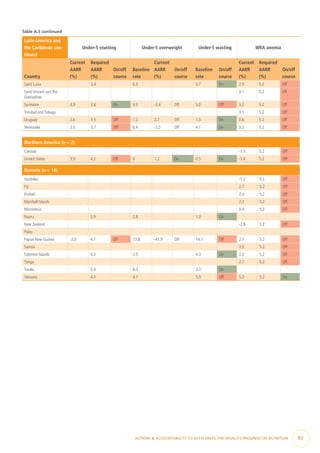
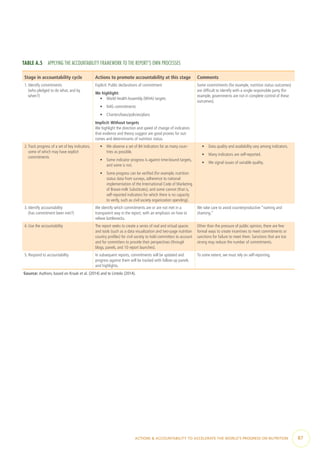
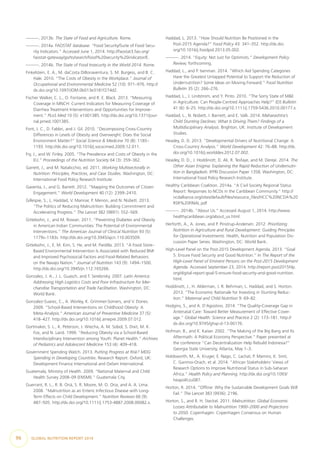
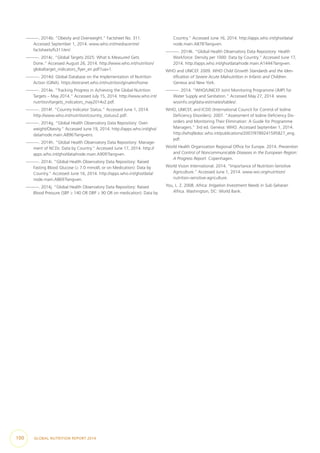
FIGURE 1.1 CONCEPTUAL FRAMEWORK OF THIS REPORT
IDENTIFY
COMMITMENTS
TRACK PROGRESS
AGAINST
COMMITMENTS
DETERMINE
WHETHER
COMMITMENTS
WERE MET
LEVERAGE INFORMATION ON ACCOUNTABILITY
TO PUSH FOR NEW COMMITMENTS
DESCRIBE
RESPONSE TO
ACCOUNTABILITY
1 2
3
4
5
Country-driven combinations of nutrition-specific and nutrition-senstive programs
and approaches, supported by trends in areas and sectors related to nutrition such
as food, health, social welfare, education, water, sanitation, hygiene, and gender
Identify key data and capacity gaps
Enabling environment for nutrition improvement
Progress in improving nutrition status
Benefits of improved nutrition status
Source: Authors, based on Kraak et al. (2014) and te Lintelo (2014).](https://image.slidesharecdn.com/gnr14-150115040612-conversion-gate01/85/Global-Nutrition-Report-14-22-320.jpg)
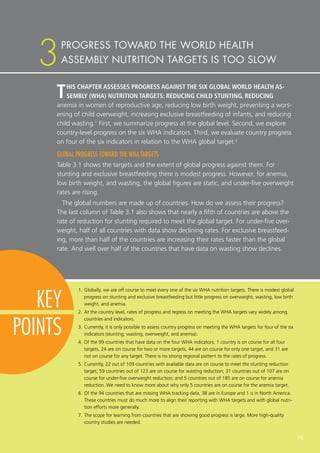
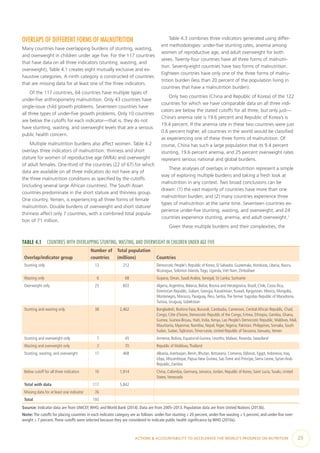
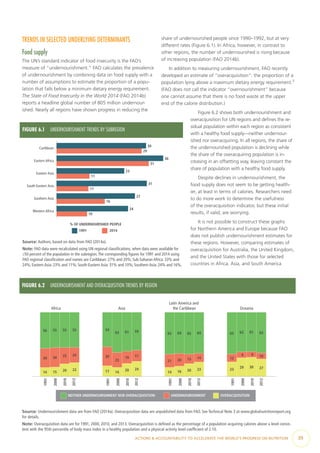
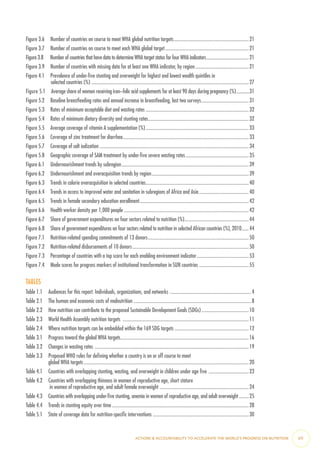
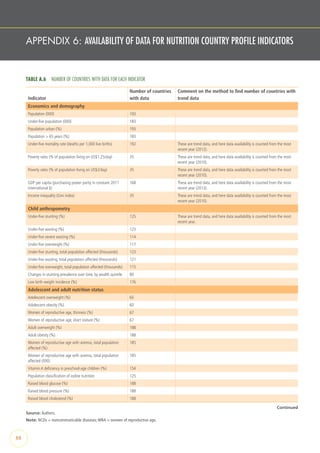
![ACTIONS & ACCOUNTABILITY TO ACCELERATE THE WORLD’S PROGRESS ON NUTRITION 63
Conclusions
• A response rate of 92 percent is respectable. Nonetheless,
given repeated requests and offers of help completing the
templates over a five-month period, it is disappointing that 8
percent of signatories did not respond.
• There are more “on course” ratings than “off course” ones,
which is encouraging.
• The “not clear” category is dominant. This reflects the
difficulty of identifying clear commitments (what do they
actually mean? who actually made them? are they time
bound?), tracking progress, and identifying accountability
(have commitments been met?).
• A rating of “on course” can be achieved by making and
meeting a very modest commitment, while an “off course”
rating can be achieved by making a challenging commitment
and then falling just short of it (as happened, for example,
with Concern Worldwide). We observed these tendencies
on several occasions. These occurrences seem counter to the
spirit of the accountability exercise, and we will explore ways
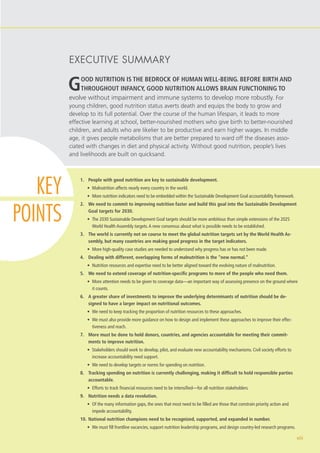
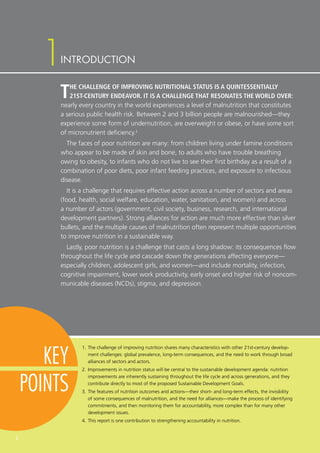
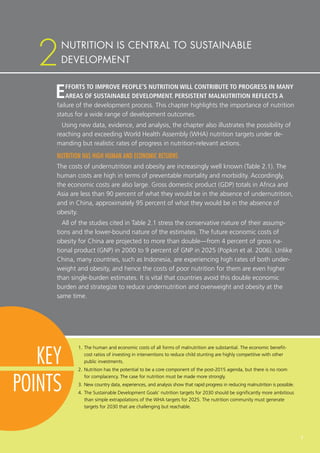
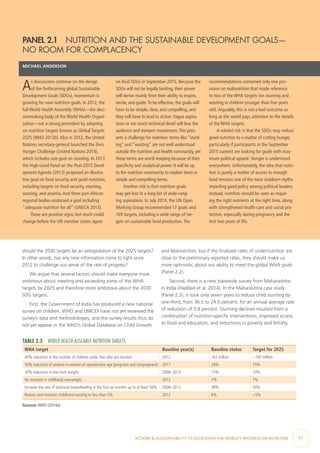
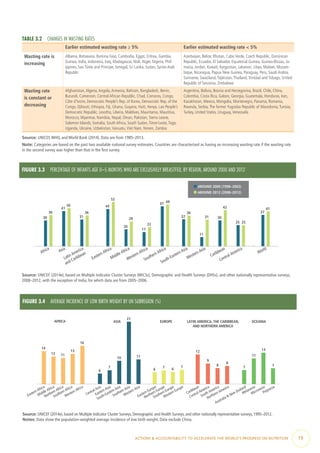
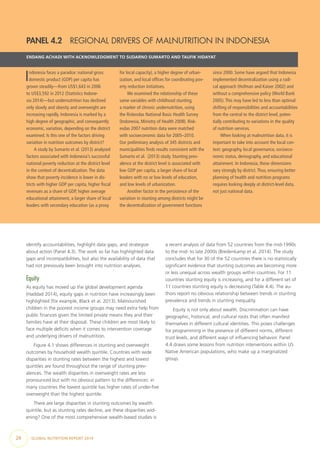
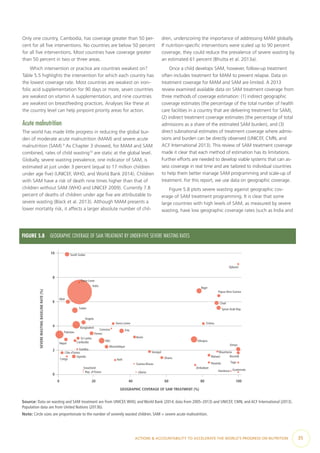
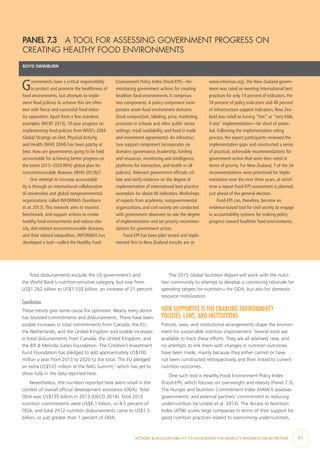
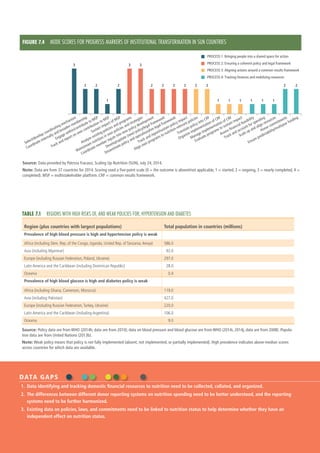
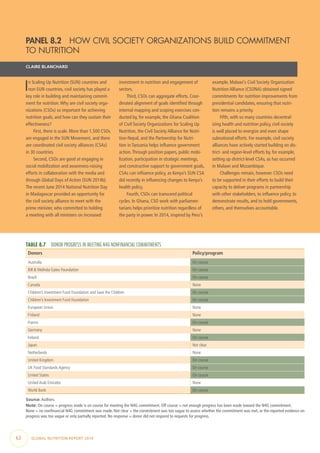
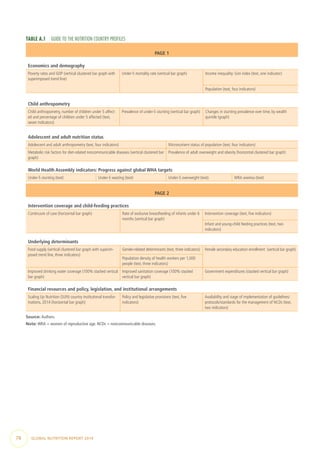
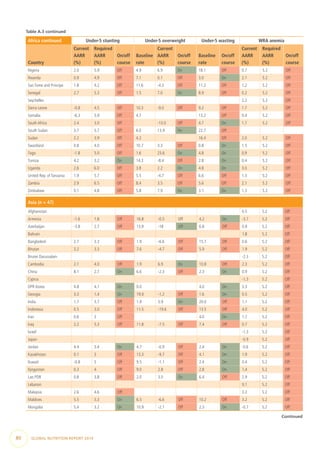
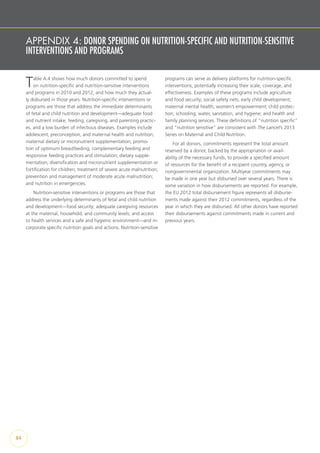
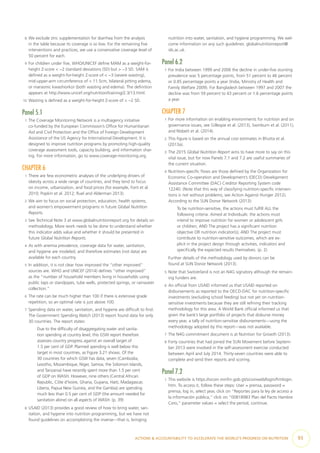
TABLE 8.8 OTHER ORGANIZATIONS’ PROGRESS IN MEETING N4G COMMITMENTS
Other organizations Policy/program commitments
CABI Not clear
CGIAR On course
GlobalAlliance for Improved Nutrition (GAIN) On course
Naandi Foundation No response
Grand Challenges Canada Not clear
Source: Authors.
Note: On course = progress made is on course for meeting the N4G commitment.
Not clear = the commitment was too vague to assess whether the commitment was
met, or the reported evidence on progress was too vague or only partially reported.
No response = organization did not respond to requests for progress.
PANEL 8.3 BUILDING CIVIL SOCIETY’S CAPACITY TO PUSH FOR POLICIES
ON OBESITY AND NONCOMMUNICABLE DISEASES
CORINNA HAWKES
In 2011, the 193 member governments of the
United Nations made a series of commit-
ments to prevent and control noncommunica-
ble diseases (NCDs) (United Nations General
Assembly 2011). Governments committed
to, among other things, advance policies for
healthy diets, improve governance of obesity
by engaging multiple sectors, and build the
capacity of nongovernmental organizations
(NGOs).WHO established a roadmap for
implementing and monitoring these commit-
ments in its Global Action Plan for the Prevention
and Control of NCDs 2013–2020 (WHO 2013b)
and Global Monitoring Framework (WHO
2013a).
As public interest watchdogs, civil soci-
ety organizations (CSOs) have a unique role
to play in monitoring the implementation of
these commitments.Yet—as these documents
recognize—to do so effectively, they need
greater capacity. Significant investment can
pave the way. For example, Denmark’s devel-
opment cooperation agency, Danida, has since
2010 funded a series of NCD alliances in East
Africa (Kenya, Rwanda,Tanzania, Uganda,
Zanzibar) (NCD Alliance 2014a). Modeled on
the global NCD Alliance, the organizations
bring together groups concerned with heart
disease, cancer, diabetes, and lung diseases to
raise the political profile of NCDs, build public
awareness, and provide support for education,
treatment, and patient concerns (Ministry of
Foreign Affairs in Denmark [DANIDA] 2008).
Another example is the Obesity Prevention
Program at Bloomberg Philanthropies (2014),
which has provided a US$10 million, three-
year grant to Mexican civil society organiza-
tions and research institutes to build obesity
prevention into their work.
Facilitated by funding and international
monitoring tools, these CSOs work to hold
governments to account.The Healthy Carib-
bean Coalition (2014b)—an alliance of more
than 40 health-based NGOs—published an
assessment of progress in 2014, guided by the
benchmarking tool developed by the global
NCD Alliance (2014b).The assessment identi-
fied nutrition as the area of least progress; no
countries reported having nutrition strate-
gies or policies on food marketing to children,
despite having committed to implementing
the WHO recommendations on marketing to
children (Healthy Caribbean Coalition 2014a).
Investments in global-scale monitoring
are needed to bring together national-level
data.WHO has several instruments for
assessing progress on international commit-
ments on obesity and NCDs, including a 2010
survey of countries’ capacity to prevent and
control NCDs (WHO 2010c) and the Global
Database on the Implementation of Nutri-
tion Action (GINA) (WHO 2014d). CSOs have
developed more detailed tools. For example,
the World Cancer Research Fund Interna-
tional’s NOURISHING Framework includes a
regularly updated repository of healthy eating
policies from around the world (WCRF 2013).
The International Baby Food Action Network
(2014) and UNICEF monitor the actions of 198
governments toward implementing the WHO
International Code of Marketing of Breast-
milk Substitutes.
To improve accountability, funders should
invest in increasing staffing capacity in
national CSOs.They should also finance the
time-consuming process of collecting and
collating information on NCD policy imple-
mentation and indicators of good nutrition
governance. CSOs need to engage with the
research community in this process and
develop projects and proposals for monitoring
policy and governance to hold their govern-
ments to account.](https://image.slidesharecdn.com/gnr14-150115040612-conversion-gate01/85/Global-Nutrition-Report-14-80-320.jpg)
![NOTES
CHAPTER 1
1 The World Health Organization estimates that at least a third of the
world’s population is affected by micronutrient malnutrition (Allen et
al. 2006) and that in 2008 more than 1.4 billion adults over the age
of 20 were overweight (WHO 2014b).
2 Nutritional needs change over the life course, and adequate nu-
trition early in life—particularly during the 1,000 days between a
woman’s pregnancy and a child’s second birthday—has enormous
benefits throughout the life cycle and across generations.
3 The scope for progress in nutrition outcomes will depend on ex-
ternal factors such as climate, conflict, trade, and financial shocks;
political opportunities generated by changes in leadership or crisis;
and the capacity of different actors to deliver nutrition-relevant ac-
tions. Data can play a vital role in building commitment and guiding
action, but it is only one of the factors at play.
4 For more information, see http://globalnutritionreport.org
/governance/concept-note/.
5 The main criterion for selecting indicators was evidence of relevance
in improving nutrition outcomes. Many other indicators were con-
sidered but not included because there was little evidence that they
mattered for nutrition outcomes or they were not available for more
than a handful of countries. The nutrition country profile document
on the Global Nutrition Report website (www.globalnutrition
report.org) provides a rationale for each indicator included and
for indicators considered but not included. Appendix 1 describes
how to use the nutrition country profiles as a diagnostic tool, and
Appendix 6 summarizes the indicators by category. Technical Note 1
(available at www.globalnutritionreport.org) provides definitions and
full data sources for all 84 indicators.
6 In addition to the report, key data can be found on the Global
Nutrition Report website (www.globalnutritionreport.org), includ-
ing nutrition country profiles, more in-depth panels and additional
panels beyond those presented in the report, detailed Nutrition for
Growth tracking tables, and relevant blogs and news pieces.
Panel 1.1
1 These concepts are based on Ruel and Alderman (2013), Gillespie et
al. (2013), and Haddad and Isenman (2014).
CHAPTER 2
1 In fact they may be more competitive because they exclude several
benefit categories that these health sector studies included: (1) the
social value of human life, (2) morbidity averted, and (3) changes in
the dependency ratio due to subsequent fertility declines resulting
from improved child survival.
2 The rate of progress required for countries to meet targets is
expressed by WHO as the annual average rate of reduction (AARR)
or annual average rate of increase (AARI). They can be applied to
prevalence rates or numbers of individuals. For example, the AARR
for a change from a 40 percent stunting rate in 2005 (P1) to a 30
percent rate in 2012 (P2), a seven-year time frame, is ([7√(P2/P1)] -
1) * 100 = an AARI of −4.026 percent or an AARR of 4.026 percent.
AARI is analogous to a compound rate of interest that generates P2
after being applied to P1 over a period of, in this case, seven years.
For more details, see http://www.childinfo.org/files/Technical_Note_
AARR.pdf.
3 For example, the WHA goal of reducing the number of stunted
children under the age of five from 162 million in 2012 to 102.5
million in 2025 translates into an average annual rate of reduction
(AARR) of 3.9 percent (de Onis et al. 2013). But the new data on
stunting in India may generate an opportunity for more ambitious
steps. If the number of stunted children globally, say, is now actually
about 150 million (not 162 million as in Table 2.3) because of the
new India results, then an AARR of 3.9 percent from 2013 to 2025
would reduce the number of stunted children to about 93 million
and to 76 million by 2030. Moreover, as prevalence rates decline, it
becomes mathematically easier to attain a given AARR, suggesting
that we should increase our AARR ambitions as progress is made in
stunting rates. A modest increase in the target AARR to 4.2 percent,
applied from 2013 to 2030 from a base of 150 million stunted
children would make the 2030 target 61 million. We do not suggest
this as a 2030 SDG target for stunting. What we do suggest is that
it is time to reassess our aspirations for nutritional status improve-
ments toward 2030 in the light of new data and evidence.
Panel 2.2
1 Anthropometric measurements were made for 90,667 children
younger than five years old. Inquiries on the methodological details
can be directed to UNICEF’s India office.
Panel 2.3
1 Haddad et al. (2014) used a review of existing studies and reports,
a comparison of 2005–2006 and 2012 survey data, and a set of 28
stakeholder interviews in four districts.
Panel 2.4
1 Using a multiyear sample covering 1970 to 2012 and 116 low- and
middle-income developing countries (accounting for 96 percent of
the developing world’s population), we generated panel regression
estimates for the associations between stunting prevalence and
the six underlying determinants of stunting. The regression model
(six proxy underlying determinants, country dummy variables, and
time-period dummy variables) predicted much of the variation in
stunting and was stable over time (pre- and post-2000).
2 For access to improved water source, Brazil had a level of 95 percent
in 2006; Vietnam had access to improved sanitation facilities of
76 percent in 2011 and Sri Lanka had 89 percent in 2006. For
female secondary school enrollment, South Africa posted a rate of
95 percent in 2008. For the ratio of female to male life expectan-
cy, Indonesia had 1.06 in 2004, Honduras had 1.07 in 2005, and
the Central African Republic had 1.08 in 2010. For dietary energy
supply, Ghana had 2,934 in 2011. Finally, for the share of dietary
energy supply from nonstaples, Guatemala had 49 percent in 2008,
Brazil had 64 percent in 2006, Thailand had 50 percent in 2005, and
Swaziland had 45 percent in 2005.
CHAPTER 3
1 The rationale for and formulation of the WHA nutrition targets is
provided in WHO (2012b).
91](https://image.slidesharecdn.com/gnr14-150115040612-conversion-gate01/85/Global-Nutrition-Report-14-108-320.jpg)

The 2014 Global Nutrition Report highlights the widespread issue of malnutrition affecting millions globally and emphasizes the need for concerted strategies to address it. It calls for increased political commitment and investment in nutrition, recognizing that collaboration among various stakeholders is essential for sustainable development. The report outlines the progress made and reinforces the urgency for actions to unify efforts in combating all forms of malnutrition.


