Download to read offline

![Methodology
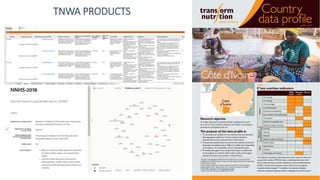
Process for identifying primary data sources
• Identification of national surveys through
Global Health Data Exchange and World
Bank Microdata search engines.
• Google search for indicators linked to the
country : [indicator]+[country]+ [data], to
identify sources we may have missed
• Cross-checking with experts for additional
data sources
• Validation through the sources from the
secondary data platforms
Process for identifying platforms
• Platforms identified through the
inception work
• DataDENT Visualization Tools profiling
(see www.datadent.org)
40](https://image.slidesharecdn.com/session2countdownworkshop9juneengl-200109093941/85/Nutrition-measurement-Indicators-data-sources-and-gaps-39-320.jpg)
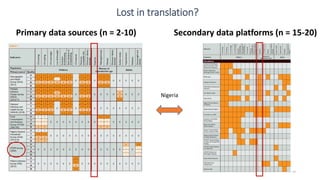

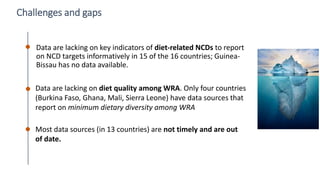

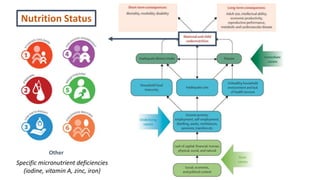
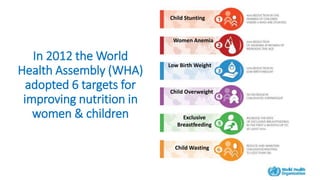
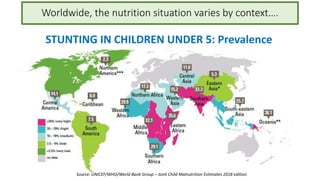
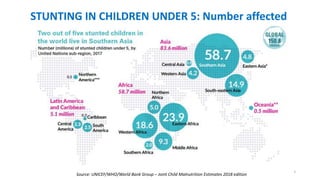
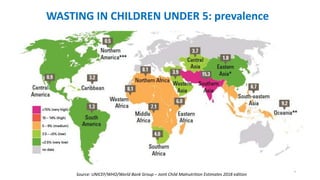
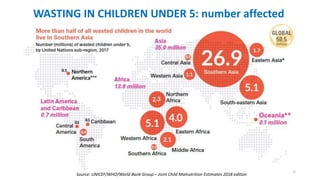
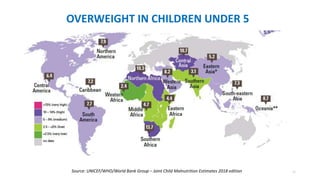
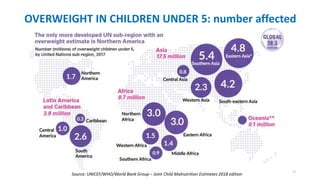
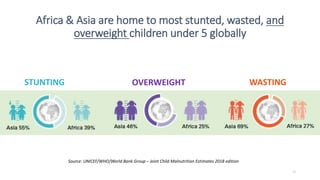
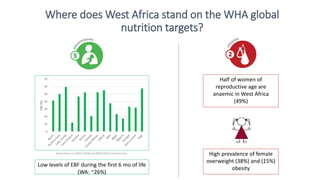
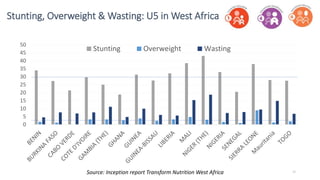
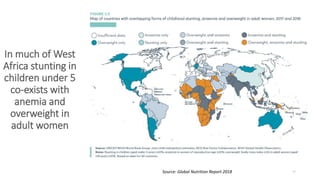
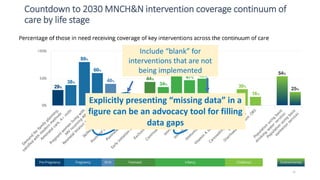
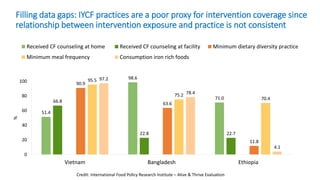
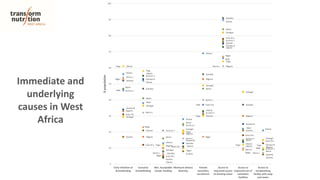
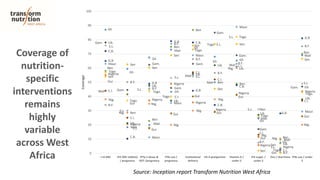
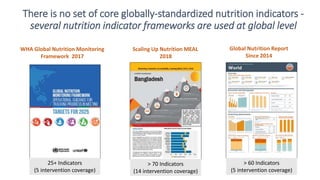
The document discusses the necessity of comprehensive nutrition measurement in West Africa, highlighting the need for data to track malnutrition indicators like stunting, wasting, and anemia among women and children. It addresses existing data gaps, the importance of accurate indicators, and the role of various data sources, while emphasizing the challenges of timely and representative data collection. Strategies for improving nutrition policies and programs in the region are also outlined, aiming to align with global health goals set by organizations like the World Health Assembly.


